
Quality Evaluation of the Occupancy Grids without Ground Truth
Maps
Ilze Andersone
a
Riga Technical University, Kalku Street 1, Riga, Latvia
Keywords: Robot Map Merging, Multi-robot Mapping, Occupancy Grid Maps, Convolutional Neural Network.
Abstract: Robot map merging is an important task in mobile multi-robot systems to facilitate cooperation and higher
performance. Map merging has been extensively researched in recent years, but little attention has been paid
to the merging of maps that have different quality levels. In this paper a method is proposed that allows the
quality evaluation of occupancy grid maps without the need for ground truth maps. The method uses
Convolutional Neural Network (CNN) for map fragment classification and can be used for overall map quality
evaluation as well as for evaluation of map regions, which is especially useful for map merging purposes.
1 INTRODUCTION
Map merging is an important task in any multi-robot
system, where robots create their own environment
models and need to share them. There are many map
merging methods developed to find the
transformation between two robot maps (Konolige et
al, 2003; Birk and Carpin, 2006; Carpin, 2008;
Adluru et al, 2008), but the act of map integration is
rarely considered in detail. If both maps are high
quality, then it is a relatively simple task given the
transformation. However, if the maps differ
significantly, then integration of data from lower
quality map can decrease the quality of higher quality
map, which is generally undesired effect and should
be avoided when possible.
This paper addresses the quality evaluation of
occupancy grid maps (Elfes, 1990) without the need
for ground truth maps. An occupancy grid map
represents the environment as 2D array of cells,
where each cell represents occupancy of
corresponding environment area in interval [0, 1],
where 0 represents ‘free’ area, 1 represents
‘occupied’ area and 0.5 – ‘unknown’ area.
According to (Schwertfeger and Birk, 2013) there
are at least six robot map quality attributes:
Coverage. Represents how much of the total
environment area is covered by the map.
a
https://orcid.org/0000-0003-1711-9393
Resolution quality. Detail level of the map
features.
Global accuracy. Describes how accurately are
the features positioned in the global reference
frame.
Relative accuracy. Describes how accurate are
the relative positions of features.
Local consistencies. Describes how accurate are
features relative to each other in localized feature
groups.
Brokenness. Describes how often the map is
broken (number of portions into which map is
partitioned due to structural errors) (Birk, 2010).
Most of these quality attributes can only be
evaluated when ground truth map is available,
because they require knowledge of environment
configuration and feature locations. The only
exception is the resolution quality, which is usually a
known parameter in the robot mapping system.
Although the ground truth map is necessary to
evaluate the absolute quality of an occupancy grid
map, it can be argued that for the map merging
purposes relative quality evaluation can be used
instead. In such case, when merging two robot maps,
the higher rated map or map region can be given
higher weight in the map merging process.
The proposed method for the map quality
evaluation uses Convolutional Neural Network
(CNN) (LeCun et al, 1998) that is trained to
determine the quality of individual map fragments,
Andersone, I.
Quality Evaluation of the Occupancy Grids without Ground Truth Maps.
DOI: 10.5220/0009175503190326
In Proceedings of the 12th International Conference on Agents and Artificial Intelligence (ICAART 2020) - Volume 1, pages 319-326
ISBN: 978-989-758-395-7; ISSN: 2184-433X
Copyright
c
2022 by SCITEPRESS – Science and Technology Publications, Lda. All rights reserved
319
which are then used to evaluate map quality. It is
inspired by the work of Kang et al (Kang et al, 2014)
in no-reference image assessment field. The results
show that both the overall robot map quality and
quality of individual map regions can be determined
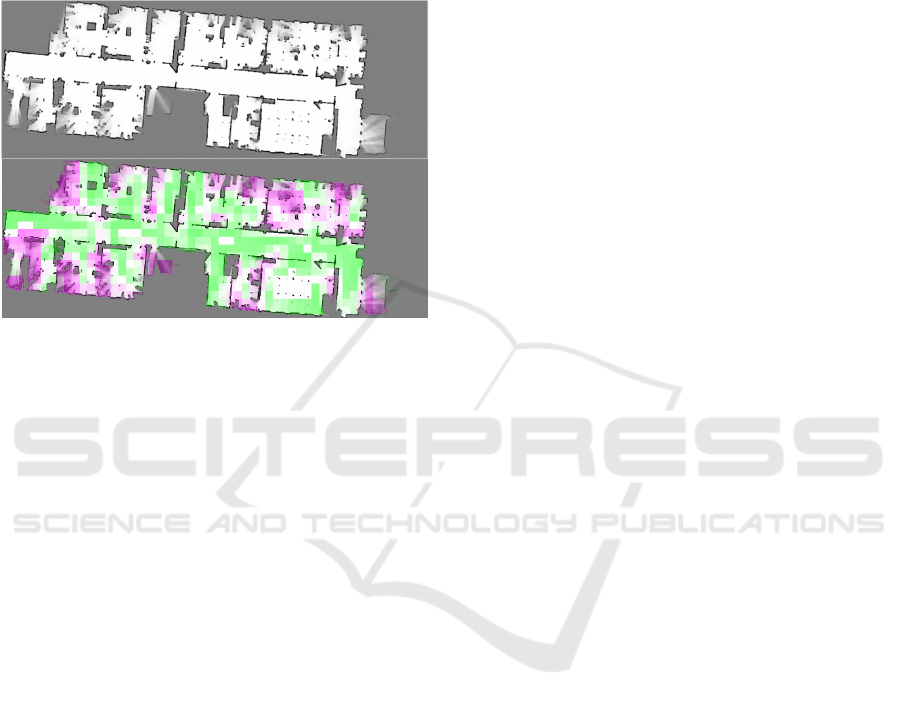
with reasonable accuracy (Figure 1 shows a visual
representation of region quality evaluation).
Figure 1: Region quality evaluation (original map source:
C. Stachniss, Freiburg, Building 079 data set,
http://www.ipb.uni-bonn.de/datasets/). Green color shows
high quality regions; red color – poor quality regions.
The main contributions of the paper are the
following: (1) the use of Convolutional Neural
Network for grid map quality evaluation without the
need for ground truth maps is proposed and tested, (2)
The guidelines for the map merging decision making
based on the evaluations are given.
The rest of the paper is organized as follows.
Section 2 gives an overview of the related works in
robot map and image quality evaluation. Section 3
describes the proposed approach for robot map
quality evaluation with CNN. Section 4 gives the
evaluation of the proposed method with experimental
results. Section 5 discusses the results and gives
guidelines how to use the evaluation for map
merging. And finally, in Section 6, the conclusions
are drawn, and future research directions indicated.
2 RELATED WORK
Map merging has been extensively studied problem
in robotics for many years and generally deals with
finding transformation between two (Konolige et al,
2003; Birk and Carpin, 2006; Carpin, 2008; Adluru et
al, 2008). A common assumption in these merging
approaches is that the maps are assumed to be
homogeneous (similar) in quality. There are some
methods that modify the maps to improve the quality
of merging (Bonanni et al, 2014), but those address
only overall structural integrity of map.
Several researchers have studied the map quality
evaluation with reference to ground truth map.
Colleens et al (Colleens and Colleens, 2007) compare
the map with ground truth map based on three
metrics: image comparison based on correlation,
direct comparison and path usefulness analysis.
Wagan et al (Wagan et al, 2008) extracts and matches
various features between two maps: Harris corners,
Hough based lines and Scale Invariant Feature
Transform (SIFT) features. Balaguer et al (Balaguer
et al, 2009) evaluates maps based on four criteria:
local and global metric quality, skeleton quality,
useful features and utility. Varsadan et al (Varsadan
et al, 2008) propose to use image similarity metric
based on computation of Manhattan distances
between two maps to evaluate their differences. Birk
in (Birk, 2010) introduces map brokenness concept
and a general way how to compute it. This work was
later expanded by Schwertfeger et al (Schwertfeger
and Birk, 2013), where topology graphs based on
post-processed Voronoi diagrams is used to evaluate
the map brokenness.
All the listed approaches rely on the existence of
ground truth maps and are designed to evaluate the
mapping algorithms but have limited use in map
merging. Unfortunately, ground truth maps are
generally unavailable when robots explore new
locations. In such situations evaluation without
reference map is required.
No-reference image quality assessment is the
closest research area to the map quality evaluation
without ground truth map. Initially no-reference
image quality metrics were only feasible if the prior
knowledge about image distortions was available
(Wang et al, 2002). However, during recent years
methods based in Convolutional neural networks
have become prominent that are able to identify
various distortions such as Gaussian blur, JPEG
compression, additive white Gaussian noise and
others (Kang et al, 2014; Bosse et al, 2018).
The image quality evaluation method proposed by
Kang et al (Kang et al, 2014), which evaluates image
patches with CNN, is the most similar to the approach
employed in this paper, but there are two important
distinctions:
1. First, the occupancy grid map data set with quality
scores isn’t readily available and must be created
from scratch. Even with the data set of various
quality maps, it isn’t feasible to just assign one
quality score to each map due to their internal
variations – closely explored areas will generally
ICAART 2020 - 12th International Conference on Agents and Artificial Intelligence
320
be better mapped than areas only sensed afar
regardless of used sensor configurations and
mapping algorithms.
2. Another distinction is the extraction of training
samples. Unlike images, occupancy grid maps
contain a large amount of data irrelevant to quality
assessment – cells with value ‘unknown’. This
plays role when the overall quality of map is
evaluated.
3 THE PROPOSED METHOD
The proposed map quality evaluation method is based
on the use of Convolutional Neural Network (CNN)
and is inspired by no-reference image evaluation
work in (Kang et al, 2014). Because the robot maps
can differ wildly in size and resolution, CNN takes a
fixed size robot map fragment as an input and returns
its evaluation. Fragment scores can be combined to
determine the overall quality of the occupancy grid
maps and their individual regions.
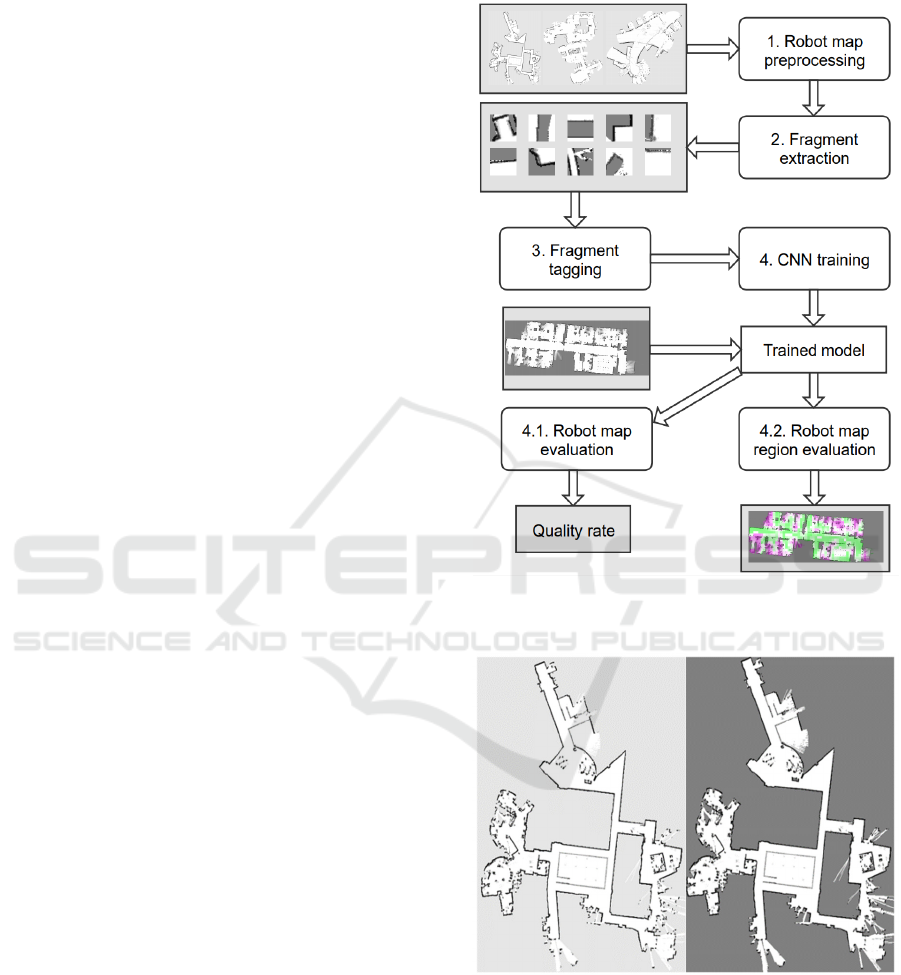
The proposed method’s main steps and inputs are
depicted in Figure 2. First, robot occupancy grid
maps are pre-processed for training. Then training,
validation and testing fragments are extracted from
the maps and their quality evaluated by a human
expert. Extracted fragments are used for the training
of the Convolutional Neural Network resulting in a
model, which is then used to evaluate the quality of
maps (either overall or region quality).
3.1 Pre-processing
The occupancy grid maps in robotics data sets are
mostly available as grayscale images, and it is the
format used in this work. Grayscale images are
natural visual representation of occupancy grids,
where occupied cells are black and free – white.
Everything between these two extremes is some
shade of grey. The transformation of occupancy grids
to grayscale images and vice versa is a trivial task.
To be comparable, all the maps in training,
validation and testing set were pre-processed to have
similar format (an example is shown in Figure 3).
Two steps were performed in pre-processing:
Unknown value normalization. All maps must
have the same value for unknown areas, or some
areas may be incorrectly interpreted as occupied
or free. This is not always true in publicly
available maps, which often use lighter shade of
gray for display purposes.
The unknown side areas in images were cropped
to reduce map dimensions for faster processing.
Figure 2: The structure of the proposed robot map quality
evaluation method.
Figure 3: Map before and after preprocessing (original map
source: C. Stachniss, MIT CSAIL data set,
http://www.ipb.uni-bonn.de/datasets/).
The quality and the resolution of the maps were
not changed in any way to keep the quality
differences.
Quality Evaluation of the Occupancy Grids without Ground Truth Maps
321

3.2 CNN Architecture
For the training the following CNN architecture was
chosen (this architecture is similar to the architecture
used by Kang et al in (Kang et al, 2014), which
proved effective for image fragment classification of
similar size):
Three convolution layers: 8, 16 and 32 filters (size
3x3, stride 1), ReLu activation.
Three Max pooling layers (one after each
convolution layer): first two layers have 2x2
pools, third is 3x3. Stride: 2.
Adam optimizator, categorical cross entropy loss,
learning rate = 0.001.
After convolution and Max pooling layers follows
fully connected 50-unit layer with ReLu
activation and Dropout layers (0.4 dropout). Fully
connected layer is followed by output layer with
two outputs (‘Good’ and ‘Poor’) with softmax
activation.
This CNN architecture proved to be quickly
trainable and returned reasonable results given the
noisy training and testing data.
3.3 Fragment Extraction and Tagging
From the pre-processed maps the fragments for
training, validation and testing were extracted. When
extracting fragments, the following parameters were
considered:
Fragment size. Smaller size is useful when
considering local quality of map (resolution and
local noise) while larger fragment size can better
represent the structural quality of the map.
Fragment size of 32x32 was chosen similar to the
work by Kang et al (Kang et al, 2014).
Minimum rate of significant cells. Generally large
areas of occupancy grid maps consist of cells with
‘unknown’ values, which represent unobserved
environment. Only cells, which contain
significant information (occupied and free parts of
environment), should be used for quality
evaluation. The minimum rate was chosen to be
0.4 (40% of all cells), but anything from 0.3 to 0.6
is reasonable (these rates are both representative
and able to represent border areas of the
environment).
Minimum rate of occupied cells. It is difficult to
determine the map quality just from free space
representation. Occupied cells provide the most
important information about the location of the
obstacles, and at least some part of the fragment
should contain occupied cells. Rate 0.025 (2.5%
of all cells) was chosen as the minimum rate
where the fragment contained enough occupied
cells to be evaluated by human expert.
The tagging of fragments was performed
manually. For each extracted fragment, a human
expert evaluated whether it is belongs to the class
‘good’ or ‘poor’. Only two classes are used to classify
each fragment, because it is difficult enough for the
expert to divide the data set in two classes, and more
classes would make such a task even more
complicated.
It must be noted that expert evaluation is
inherently subjective and based on the preferences of
the expert. It has the benefit of introducing desirable
properties in evaluation but is also prone to human
error introduced noise. If such subjectivity is
undesirable, then the expert evaluation can be
replaced with more formal metrics assuming that the
ground truth maps are available, e.g. by using map
quality evaluation metric in (Varsadan et al, 2008).
4 EXPERIMENTAL RESULTS
To train and test the CNN, data set of 37 various
quality maps was collected from several open source
data sets.
Pre-2014 Robotics 2D-Laser Datasets
(http://www.ipb.uni-bonn.de/datasets/): MIT
CSAIL (C. Stachniss), Freiburg Campus (C.
Stachniss, G. Grisetti), Intel Research Lab (D.
Haehnel), Seattle UW (D. Haehnel), MIT Infinite
Corridor Dataset (M. Bosse, J. Leonard), Orebro
(H. Andreasson, P. Larsson, T. Duckett),
Belgioioso castle (D. Haehnel), FHW (D.
Haehnel), ACES3 Austin (P. Beeson), Edmonton
(N. Roy), Freiburg, Building 079 (C. Stachniss),
Acapulco Convention Center, Mexico (N. Roy).
Radish: Robotics Research Datasets (Howard and
Roy, 2015): sdr_site_b (A. Howard), stanford-
gates1 (B. Gerkey), intel_oregon (M. Batalin),
ubremen-cartesium (C. Stachniss), csc-mezzanine
(A. Howard), usc-sal200-021120 (A. Howard).
Robot@Home Dataset (Ruiz-Sarmiento et al,
2017).
Data set also includes several unpublished maps
collected in Riga Technical university.
From each map, 20 random map fragments for
CNN training and 8 fragments were extracted for
testing and validation (4 for each). The decision to use
the same maps for training and testing was made due
to the limited amount of available occupancy grid
maps (in total 37 maps). Initial tests showed that
using too few maps (10 out of 37) for validation led
ICAART 2020 - 12th International Conference on Agents and Artificial Intelligence
322
to unstable training results as the data set variety was
not sufficiently represented.
In total, 32 various quality occupancy grid maps
were used for training. Even though the fragments
come from the same maps, they are extracted at
random places and have almost no overlap (see
Figure 4 for example). Nevertheless, 5 maps were not
used in training and were only used to evaluate
whether there was significant impact of using the
same maps for training, validation and testing.
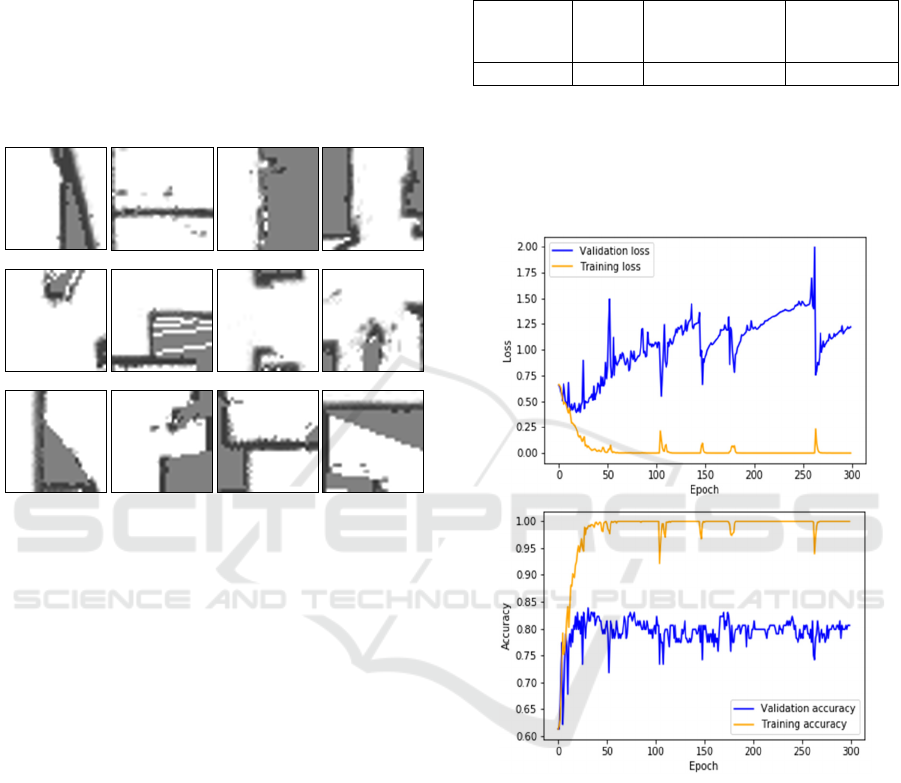
Figure 4: Example of fragments extracted from the same
map. Top row: validation fragments; Middle row: testing
fragments; Bottom row: part of training fragments.
4.1 CNN Training and Testing
The CNN model was trained with 640 map fragments
from 32 maps (20 examples from each). The training
was performed for 300 epochs 10 times with batch
size 20. Figure 5 depicts the training and validation
accuracy and loss of one training. It turned out that
300 epochs much more than necessary: Fig. 5 shows
that the neural network actually achieves the
maximum accuracy in the first 50 epochs, and overfits
at about 30 epochs (the model acquired before the
overfitting was used for testing).
The testing results of the acquired model are
shown in Table 1. The testing results with test
examples from the maps in training set (in total 128)
are shown on the left (on average 83.95%, standard
deviation 1.16), and testing results with unused maps
(5 maps, 10 fragments each) on the right (average
85.8%, standard deviation 3.15).
The test results with unused maps have higher
standard deviation, but the average accuracy is higher
than for testing with maps used in training. Even
though actual accuracy may change with larger test
sets, these test results show that the acquired model is
also applicable to maps, which were not included in
the training set.
Table 1: CNN testing results.
Test set
accuracy
(%)
Test
set
stdev
Test set
(unused maps)
acc. (%)
Test set
(unused
maps) stdev
83.95
1.16 85.8 3.15
While the correctly classified sample rate is not
high when compared to results achieved in other data
sets, it must be noted that not all examples are easily
classified in ‘good’ or ‘poor’ class and can be
something in between.
Figure 5: Training and validation loss and accuracy of one
training session.
Considering this factor, the achieved average
83.95% classification rate is sufficient to identify the
relatively higher quality occupancy grid map regions
(the accuracy is high enough for the map merging
purposes as will be shown in section 4.2). The errors
mostly represent human subjectivity and ambiguity
about the class of some examples.
4.2 Map Quality Assessment
Based on the fragment evaluation, the overall quality
of several maps was assessed. Without the ground
truth maps the possibility of quantitative evaluation is
Quality Evaluation of the Occupancy Grids without Ground Truth Maps
323
limited, but qualitative evaluation can still be
performed.
In each evaluated map size 32x32 fragments with
at least 0.4 significant cell rate and 0.025 occupied
cell rate were extracted. To reduce the count of total
fragments, a step of 8 was used in extraction for both
map axis.
All extracted fragment quality predictions were
calculated with CNN model trained in the 4.1 section,
and the overall quality rating was acquired by
averaging the ‘good’ output values of all fragments
(value ‘0’ for ‘good’ output meaning ‘poor’ quality
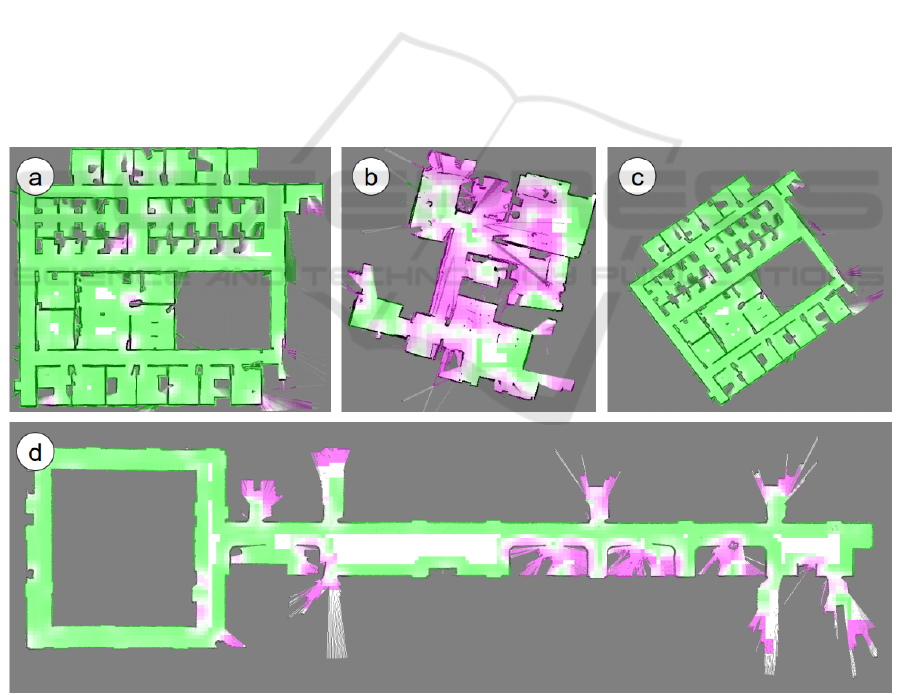
fragment). Four maps and their overall quality ratings
are given in Figure 6.
To evaluate the region quality of the map, each
region cell’s quality was calculated by averaging all
fragment values, where this cell is included. In Figure
6 high quality regions are colored in green, and the
red color depicts low quality regions.
To demonstrate that the rotation doesn’t
significantly influence the overall quality rating, map
(c) in Figure 6. is included. Although the rating is
slightly different, it is very close to the original and
the same areas are marked as lower quality.
5 DISCUSSION
The experimental results show that the results
acquired by the proposed method can be useful for
different quality occupancy grid map merging. Even
if the testing results are not perfect, the potentially
problematic maps and/or map regions can be clearly
distinguished, as seen in Figure 6.
The resolution quality assessment can be
combined with any existing occupancy grid map
merging method. After the transformation is
determined, the proposed quality metric can be used
to determine which map should have more weight in
the fusion of various map regions or if the fusion
should be rejected due to the low quality of one map.
Qualitative evaluation of results shows that there
are mainly two region types in maps evaluated as poor
quality (below 0.5 quality threshold): (1) actual low-
quality regions due to high noise or incomplete
exploration, and (2) areas with multiple objects even
when they visually appear to be good quality. There
are two options to address this issue:
Figure 6: (a) High quality map: quality evaluation 0.87. (b) Poor quality map: quality evaluation 0.342. (c) Rotated high
quality map: quality evaluation 0.878. (d) Unfinished high quality map: quality evaluation 0.684. (a) and (c): Radish: Robotics
Research Datasets (Wagan et al., 2008): sdr_site_b (A. Howard). (b): Robot@Home Dataset (Wang et al., 2002). (d): Pre-
2014 Robotics 2D-Laser Datasets (http://www.ipb.uni-bonn.de/datasets/): Seattle UW (D. Haehnel).
ICAART 2020 - 12th International Conference on Agents and Artificial Intelligence
324

The low-quality scores of fragments with multiple
objects is caused by abundance of low-quality
noisy fragments in the data set used for training
when compared to very few high-quality
fragments containing several objects. The data set
used for CNN training can be increased with more
high-quality maps.
The issue of some incorrect low quality scores can
be somewhat ignored, if the robot maps are
merged in a relative manner, i.e., it doesn’t matter
much if both maps have low or high quality score
of the region, but what is important is the relative
difference between two region scores. It means,
that even if both maps have low quality scores in
some region, then the best of maps is given more
weight relative to the other.
The main drawback of the proposed evaluation
method is that it is unable to determine the absolute
quality of the occupancy grid map. The best
application of this method is to use it to determine the
low quality regions in both maps whose integration in
the other map should be avoided. The maps can then
be integrated by using the following scheme:
If one map contains significant information in a
common region and the other does not (it is not
explored) then the explored map region is
integrated in the other map without any changes.
It is assumed that some information about the
region is better than no information.
If both maps have significant information in a
common region, then information from both maps
is used to calculate the new cell values based on
region quality. The weight of the new information
for each map is calculated based on the region
quality difference.
6 CONCLUSIONS
In this paper the quality evaluation method of
occupancy grid maps without the need for ground
truth maps was proposed. The map evaluation results
acquired in the experiments show that the results are
consistent with intuitive map evaluation.
There are several ways how the results of the
proposed approach can be improved and are subject
of future research:
The occupancy grid map count in training,
validation and testing sets can be increased to
introduce more variety in data set.
The manual expert-based tagging of map
fragments can be replaced with automatic
evaluation if the reference map is available. To
achieve this, the existing metrics based in ground
truth quality evaluation can be adapted, but a
natural limitation is the necessity of ground truth
maps.
Another direction of future research is the
application of the proposed no-reference map quality
evaluation in real-life occupancy grid map merging
scenario.
ACKNOWLEDGEMENTS
This work has been supported by the European
Regional Development Fund within the Activity
1.1.1.2 “Post-doctoral Research Aid” of the Specific
Aid Objective 1.1.1 “To increase the research and
innovative capacity of scientific institutions of Latvia
and the ability to attract external financing, investing
in human resources and infrastructure” of the
Operational Programme “Growth and Employment”
(No. 1.1.1.2/VIAA/1/16/030)
REFERENCES
Adluru N., Latecki L.J., Sobel M., and Lakaemper R., 2008.
Merging maps of multiple robots. In 2008 19th
International Conference on Pattern Recognition, pp.
1-4.
Balaguer B., Balakirsky S., Carpin S., and Visser A., 2009.
Evaluating maps produced by urban search and rescue
robots: lessons learned from RoboCup. Autonomous
Robots, 27, no. 4,
Birk A., and Carpin S., 2006. Merging occupancy grid maps
from multiple robots. Proceedings of the IEEE, vol. 94,
no. 7, pp. 1384-1397.
Birk A., 2010. A quantitative assessment of structural errors
in grid maps. Autonomous Robots, 28, no. 2,
Bonanni T. M., Grisetti G., and Iocchi L., 2014. Merging
partially consistent maps. In International Conference
on Simulation, Modeling, and Programming for
Autonomous Robots, pp. 352-363.
Bosse S., Maniry D., Müller K., Wiegand T., and Samek
W., 2018. Deep neural networks for no-reference and
full-reference image quality assessment. IEEE
Transactions on Image Processing, 27, no. 1, pp. 206-
219.
Carpin S., 2008. Fast and accurate map merging for multi-
robot systems. Autonomous Robots, 25, no. 3, pp. 305-
316.
Colleens T., and Colleens J. J., 2007. Occupancy grid
mapping: An empirical evaluation. In 2007
Mediterranean Conference on Control & Automation,
pp. 1-6.
Elfes A., 1990. Occupancy grids: A stochastic spatial
representation for active robot perception.
Quality Evaluation of the Occupancy Grids without Ground Truth Maps
325

In Proceedings of the Sixth Conference on Uncertainty
in AI, vol. 2929,
Howard A., and Roy N., 2015. The robotics data set
repository (Radish). URL http://radish. sourceforge.
net30,
Kang L., Ye P., Li Y., and Doermann D., 2014.
Convolutional neural networks for no-reference image
quality assessment. In Proceedings of the IEEE
conference on computer vision and pattern recognition,
pp. 1733-1740.
Konolige K., Fox D., Limketkai B., Ko J., and Stewart B.,
2003. Map merging for distributed robot navigation.
In Proceedings 2003 IEEE/RSJ international
conference on intelligent robots and systems (IROS),
vol. 1, pp. 212-217.
LeCun Y., Bottou L., Bengio Y., and Haffner P., 1998.
Gradient-based learning applied to document
recognition. Proceedings of the IEEE, 86, no. 11, pp.
2278-2324.
Ruiz-Sarmiento J. R., Galindo C., and Gonzalez-Jimenez J.,
2017. Robot@Home, a Robotic Dataset for Semantic
Mapping of Home Environments. International
Journal of Robotics Research,
Schwertfeger S., and Birk A., 2013. Evaluation of map
quality by matching and scoring high-level, topological
map structures. In 2013 IEEE international conference
on robotics and automation, pp. 2221-2226.
Varsadan I., Birk A., and Pfingsthorn M., 2008.
Determining map quality through an image similarity
metric. In Robot Soccer World Cup, pp. 355-365.
Wagan A. I., Godil A., and Li X., 2008. Map quality
assessment. In Proceedings of the 8th Workshop on
Performance Metrics for Intelligent Systems, pp. 278-
282.
Wang Z., Sheikh H. R., and Bovik A. C., 2002. No-
reference perceptual quality assessment of JPEG
compressed images. In Proceedings. International
Conference on Image Processing, vol. 1,
ICAART 2020 - 12th International Conference on Agents and Artificial Intelligence
326
