
Identification of Sustainable Locations in Pigeon Flights
using Flow Simulation Method
Margarita Zaleshina
and Alexander Zaleshin
Moscow Institute of Physics and Technology, Moscow, Russia
Keywords: Visual Perception, Spatial Navigation, Flow Simulation.
Abstract: Navigation behaviour in nature is based on data obtained from perception of the terrain where movement
occurs. The aim of this work is to study the influence of visual factors on the flight of birds over medium
distances (about 10 km). In this study, we propose a method for probabilistic analysis of pigeon flights over
combined countryside and urban terrain, based on surface flow simulation. Z-value – an altitude analogue
that describes the characteristic gradient of the flow – is calculated as a function of "landscape complexity"
based on the density of significant landscape objects. The calculated probabilistic model is compared with
data on GPS-tracks of untrained and trained pigeons. As a result, significant features of terrain that
determine sustainable locations in pigeon flights are identified. In the study, visual characteristics of the
territories over which pigeons flew are calculated using remote sensing data from open sources, and spatial
data are processed using the geographical information system QGIS.
1 INTRODUCTION
Here we studied the properties of pigeon flight
trajectories over combined countryside and urban
terrain. The aim of this study is to identify the
interdependence of the characteristics of the
trajectories of pigeons and the visual properties of
the landscape, based on surface topology.
Study of the typical ways in which pigeons
respond to changes in the landscape over which they
fly shows that pigeons rely on visual perception of
the terrain to determine their routes. Their
perception of the terrain allows them to distinguish
characteristic features that are suitable for guiding
flight above terrain. These features are determined
by such parameters as tone, colour, and density of
detached objects.
Moreover, the way in which a pigeon orients
itself based on visual data is directly influenced by
the degree to which the landscape is filled with
separate stimuli. Mann et al. (2014) studied the
influence of “landscape complexity” on pigeon
navigational behaviour. The authors concluded that
pigeons orient themselves better when flying above
territory where “landscape complexity” is neither
too high nor too low.
To assess the probabilistic characteristics of a
flight over surface, the visual perceptibility factor is
used here, depending on saturation of the terrain
with visual objects. It can be represented as z-value,
an analogue of height, which describes the
characteristic directions of flight. To find potential
flight trajectories, the flow paths over the surface
caused z-value differences are calculated. The
computational model is compared with pigeon GPS-
track data over this area.
Visual features in the landscape that are
important for long-range navigation can be
identified by Kano and colleagues (Kano et al.,
2018). These authors discuss the training of a
particular route by repeated flights on the same
terrain.
The properties of trained and untrained birds can
be reflected in perception preferences for objects on
the ground and in flight paths, which is also shown
in this work.
This paper is structured as follows. In Section 2,
we provide a brief review of the following topics: i)
visual perception of the terrain during flight; ii)
formation of flight trajectories based on visual data
perceived by a pigeon; iii) analysis of surface
properties to determine the possibility of external
dynamic processes; and iv) representing the density
of objects as a surface on which flow can potentially
Zaleshina, M. and Zaleshin, A.
Identification of Sustainable Locations in Pigeon Flights using Flow Simulation Method.
DOI: 10.5220/0009000305350541
In Proceedings of the 9th International Conference on Pattern Recognition Applications and Methods (ICPRAM 2020), pages 535-541
ISBN: 978-989-758-397-1; ISSN: 2184-4313
Copyright
c
2022 by SCITEPRESS – Science and Technology Publications, Lda. All rights reserved
535
occur. In Section 3, we describe data and data
processing methods for calculations used for surface
flow simulation. In Section 4, we compare data on
calculating flows over a landscape and real flight
paths for untrained and weakly trained pigeons. In
Section 5 we discuss the applicability of
identification of sustainable locations in pigeon
flights using flow simulation method.
2 BACKGROUND AND RELATED
WORKS
2.1 Visual Perception of the Terrain
during Flight
Navigation mental maps can be formed by animals
based on the results of perception of the terrain.
Birds can orient themselves based on both
“landscape complexity” and individual reference
objects. In general, during medium-distance flights,
bird trajectories are determined by visual perception
of the terrain and reflect the visible characteristics of
the surface.
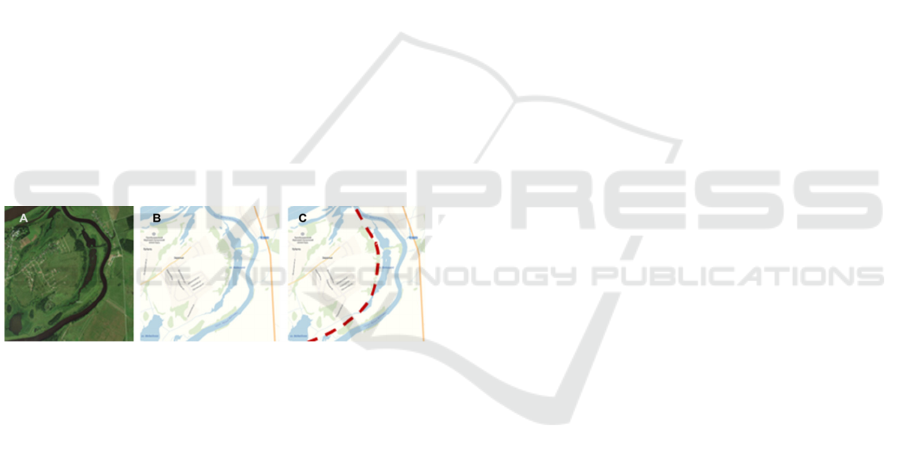
Figure 1 shows adjustment of pigeon trajectories
caused by perception of the terrain.
Figure 1: The consecutive places of "attraction" caused by
terrain perception: (A) Satellite view, (B) map view, (C)
pigeon flight near places of "attraction".
The navigational behaviour of pigeons in
different situations is described in many
publications. Mann et al. (2014) showed that pigeons
can make use of some form of navigational map,
combined with time-compensated solar compass
information, to orient homeward from distant
unfamiliar places. Blaser et al. (2013) showed that
birds knew their geographical position in relation to
targets, and chose a flight direction according to
their needs – clearly the essence of a cognitive
navigational map. Also, in paper (Blaser et al., 2013)
the authors proved that pigeons are able to
remember routes and fly to the objects which are
important to them, such as home or feeding spots,
and that they can also choose where to turn
depending on the degree of their satiety.
The significance of visual stimuli is different for
investigatory flights, when a pigeon surveys
unknown terrain, than for purposeful flights, when a
pigeon flies along the known path to the known
goal. In an unknown place untrained pigeons first try
to explore the area, and perform survey flights in
different directions, while trained pigeons head
straight to the goal (Blaser et al., 2013; Wiltschko
and Wiltschko, 2015; Pettit et al., 2012).
The path of the investigatory survey flight may
cover a large territory. It is during the survey flight
that a pigeon actively reacts to the terrain features in
a way that is noticeable based on its flight. A trained
pigeon mostly flies almost directly to the goal with
insignificant deviations from a set route. Biro et al.
(2007) state that when orienting itself while flying
above known terrain, a pigeon may combine
purposeful movement in a chosen direction with
landmark guidance. Even over previously unfamiliar
terrain pigeons demonstrate fairly stable sets of
behaviour. For example, they prefer not to fly over a
wide water surface. At the same time, pigeons have
a tendency to use linear structures, such as roads,
rivers, or boundaries between dissimilar surfaces
(Kano et al., 2018; Lipp et al., 2004; Vyssotski et al.,
2009).
To simulate the flight of untrained and trained
pigeons, the following assumptions can be adopted:
When choosing a route, untrained pigeons
are guided by the visual perceptibility of
the terrain; their flight route is directed
from the places that are least visually
attractive to more attractive places.
Trained pigeons are guided by routes that
they learned earlier, and to which they try
to return when they have deviated from
their accustomed route. As a result, they
may stop responding to many visual
stimuli, except for the main reference
points.
2.2 Formation of Pigeons’ Routes
based on Visual Data Perception
In unfamiliar conditions, birds look for objects that
they have previously encountered, stable options for
the location of these objects, and the usual sequence
in which these objects appear as a basis for
recognition of other information.
A bird's behaviour over previously familiar
terrain changes during flights. Thus, repeated
viewing of the same point of the terrain (or localized
site) forms changes in behaviour over this point.
ICPRAM 2020 - 9th International Conference on Pattern Recognition Applications and Methods
536
Visually, terrain is perceived from different
heights and viewing angles, at different scales, and
with different degrees of detail. Thus, when flying
over a forest, only the boundary line of this forest
can be tracked, but smaller details – such as
commonly viewed margins and clearings – can also
be observed, although transitions between them are
less noticeable and significant.
A bird flying along a certain trajectory forms a
panoramic perception of its environment,
complementing, if necessary, the general visual
scene with elements that are not always observable
at some specific instant. At the same time, it is
possible to fully observe the borders and extended
areal interrelations of the terrain elements, including
those outside the current viewing angle of the bird.
Moreover, in the process of panoramic viewing
during flight, such extended areal interrelations can
be established or not established for a short time.
In addition, with repeated observation of the
same mixed and erratic data, birds can form unstable
interrelations, while maintaining a stable
composition of the data. This differs from rare
observations of the same mixed and erratic data,
when perception of different data occurs separately
and the interrelations are not formed.
Depending on the scale and the flight route,
selection of individual terrain elements – which
differ from each other in some ways – may not
occur. Similarly, selection of boundaries and
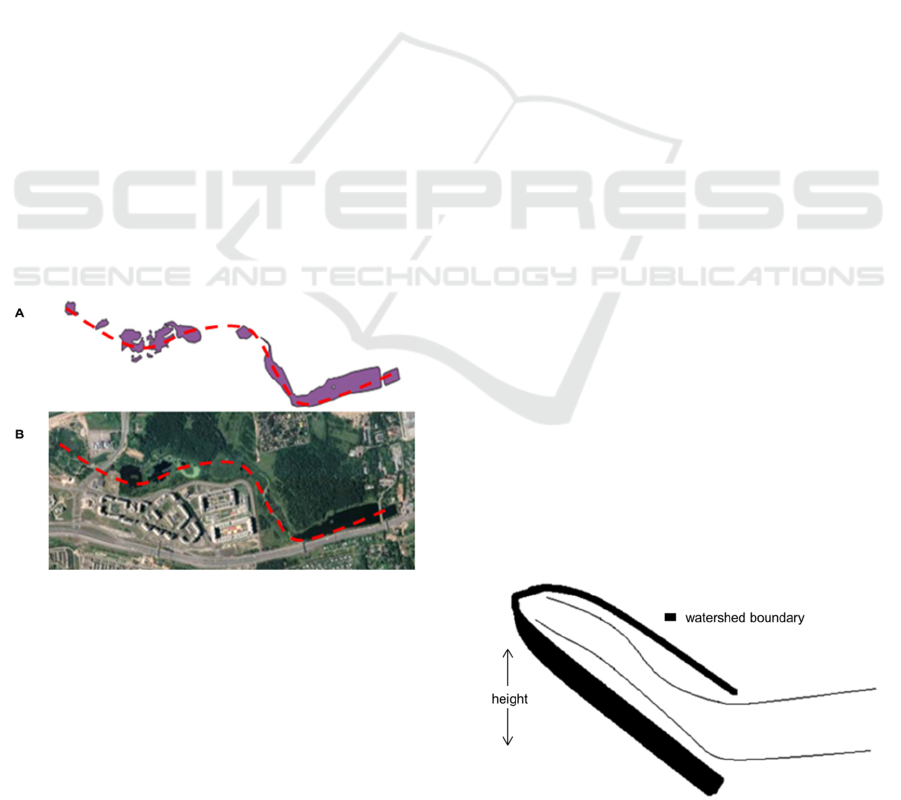
extended area objects may not occur (Figure 2).
Figure 2: Adjustment of the pigeon flight route, taking into
account perception of elements of the terrain that are not
visually connected and preference for flying over linear
objects. (A) schematic view of water objects, (B) satellite
view.
2.3 Analysis of Surface Properties to
Determine the Possibility of
External Dynamic Processes
The properties of a surface affect the dynamics of
external processes that occur over it. Thus,
landscape have a significant impact on urban
development: interpretation of time series processing
is represented in urban growth monitoring (Sexton et
al., 2013). Fluid dynamics simulation methods are
also applied in biomedical analysis (Ferrari et al.,
2018; Rispoli et al., 2015). Shape of a river bank,
and formation of its bends, inflow and inner islands
are determined by relief over which it flows.
Interpretation of complex flow patterns is
represented in geosciences (Gallien et al., 2018;
Graser et al., 2019) and geological survey (Essaid,
1990; Essaid et al., 2015) in generalized analysis of
topography induced stream subsurface exchange
(Stonedahl et al., 2010) and in considering ground
water and surface water as a single resource (Winter
et al., 1998).
Probable pigeon flight routes can be calculated
using surface flow simulation, on different parts of
the routes. To accomplish this, the isolines with the
same “landscape complexity” are used to construct
typical cases of pigeon “flow”. In particular, surface
flow can be constructed for places with a sharp
change in “landscape complexity” and/or for places
with dense accumulations of isolines. Such a
method, in general, resembles typical methods for
calculating for water stream on hilly terrain.
Formation of the flow path, taking into account
the steep slope, is limited on the sides in watershed.
(Figure 3). Similarly, the location of arc-shaped
thresholds is formed where pigeon route cross the
texture border isolines. When flying over texture
boundaries, perception of a pigeon can change
abruptly. Differences in density of perceived
textures can either be presented in the form of a
“sharp change” or be smoothed. A considerable
height differential, as a rule, is localized in a small
area.
Figure 3: Formation of the flow path in watershed.
Identification of Sustainable Locations in Pigeon Flights using Flow Simulation Method
537
2.4 Representing the Density of Objects
as a Surface on Which Flow Can
Potentially Occur
Computational methods for modelling flows can be
applied in cases where there is a certain “height”
analogue (z-value). Density of stand-alone
distinguishable objects, variation in density and
direction makes it possible to create a flow model
for the terrain, where the density of objects is used to
determine the height, taking into account the
perceptibility of the terrain. Surface characteristics
which are attributed to all units of the surface,
providing sets of direction gradients "top-down".
Based on the fact that pigeons prefer a certain
density of separately standing distinguishable
objects for flight (Mann et al., 2014), it is possible to
snap such points by lines in cases where the points
are close to each other and the density drop is
insignificant.
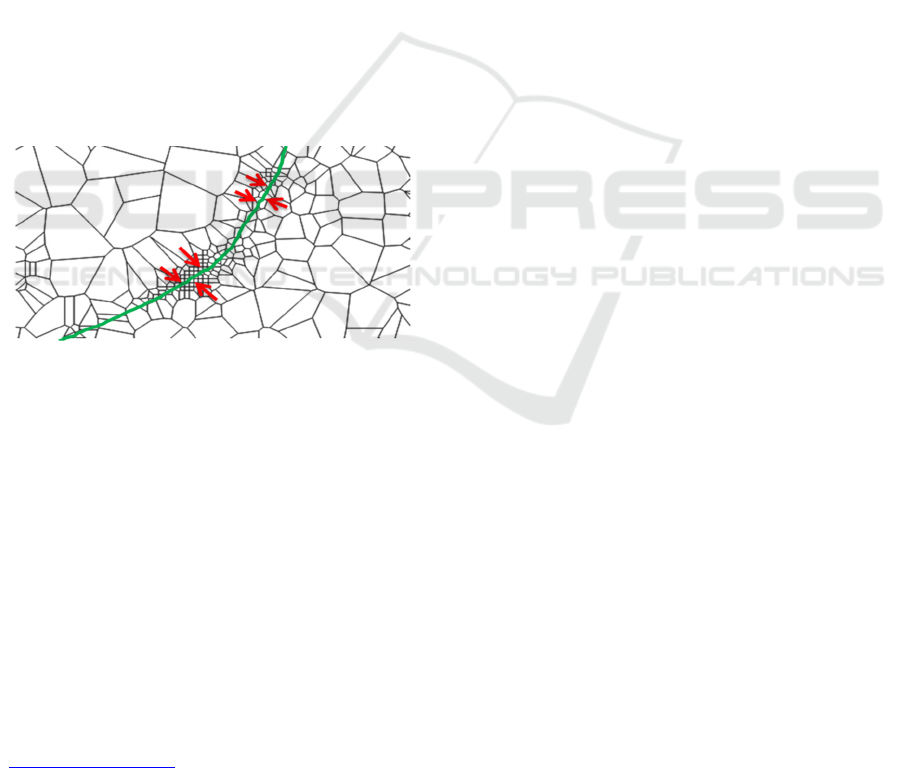
Figure 4 shows an example of representing the
density of objects as a surface on which flow can
potentially occur: layer contains “voronoi polygons”
corresponding to input data about density.
Figure 4: Flow path calculation using data on the density
of objects as a “height” analogue. Red arrows indicate
direction of gradient, leading to flow formation (green
line).
3 MATERIALS AND METHODS
3.1 Materials
The calculated flow paths over the surface can be
compared with observed flight paths of pigeons. In
this work, data on the flights of pigeons and remote
sensing data for terrain over which these flights took
place were used as primary source materials. Data
packages with GPS-tracks of pigeons were collected
from Dryad Digital Repository
(https://datadryad.org, dataset (Pettit et al., 2012),
publication (Pettit et al., 2012)) in the form of CSV
files.
The pigeons flew over two types of
heterogeneous terrains: over countryside terrain
covered with forests and fields (site 1, where the
distance between start and finish points was 11.5
km) and over urban terrain with buildings and roads
(site 2, where the distance between start and finish
points was 12.5 km). Measurements of coordinates
between individual points of GPS-tracks were taken
one time per second. The characteristic distance
between separate coordinate values of pigeons’
GPS-tracks is in the range of 20-40 meters. The
areas at a distance of 150 meters from flying up and
landing of pigeons were not considered (in these
areas paths crossed themselves more often and
movement direction was constantly changing).
The study was performed for flights of untrained
pigeons (the first flights over the previously
unknown terrain) and weakly trained pigeons (the
second and third flights over the previously
unknown terrain): 21 flights over site 1, 27 flights
over site 2.
Remote sensing data (satellite images) in the
form of OpenLayers (http:// openlayers.org) was
used for ground surface information about the
surface of terrain. The coordinate system for the
project was WGS 84/Pseudo-Mercator
(EPSG:3857).
3.2 Methods
Z-value and flight characteristics calculation was
accomplished for the untrained and trained pigeons.
Calculations were performed in the following steps:
Creation of primary data layers:
- Point and line vector layers with pigeon
flight data based on GPS-tracks.
- Raster layers with satellite image materials
for the area of pigeon flights.
Mapping “landscape complexity”
“Landscape complexity” map was built based on
the remote sensing data. Visual features of the
landscape (“landscape complexity”) were identified
according to the density of visually observed
objects. Firstly, boundaries of individual
homogeneous surfaces were identified by
constructing isolines. A density map of the existing
terrain inhomogeneities was then constructed based
on the resulting clusters of isolines for characteristic
inhomogeneity dimensions of 50 and more meters.
The specified accuracy for the inhomogeneity map
corresponds to the typical distance between two
neighbouring points of the GPS pigeon tracks.
ICPRAM 2020 - 9th International Conference on Pattern Recognition Applications and Methods
538
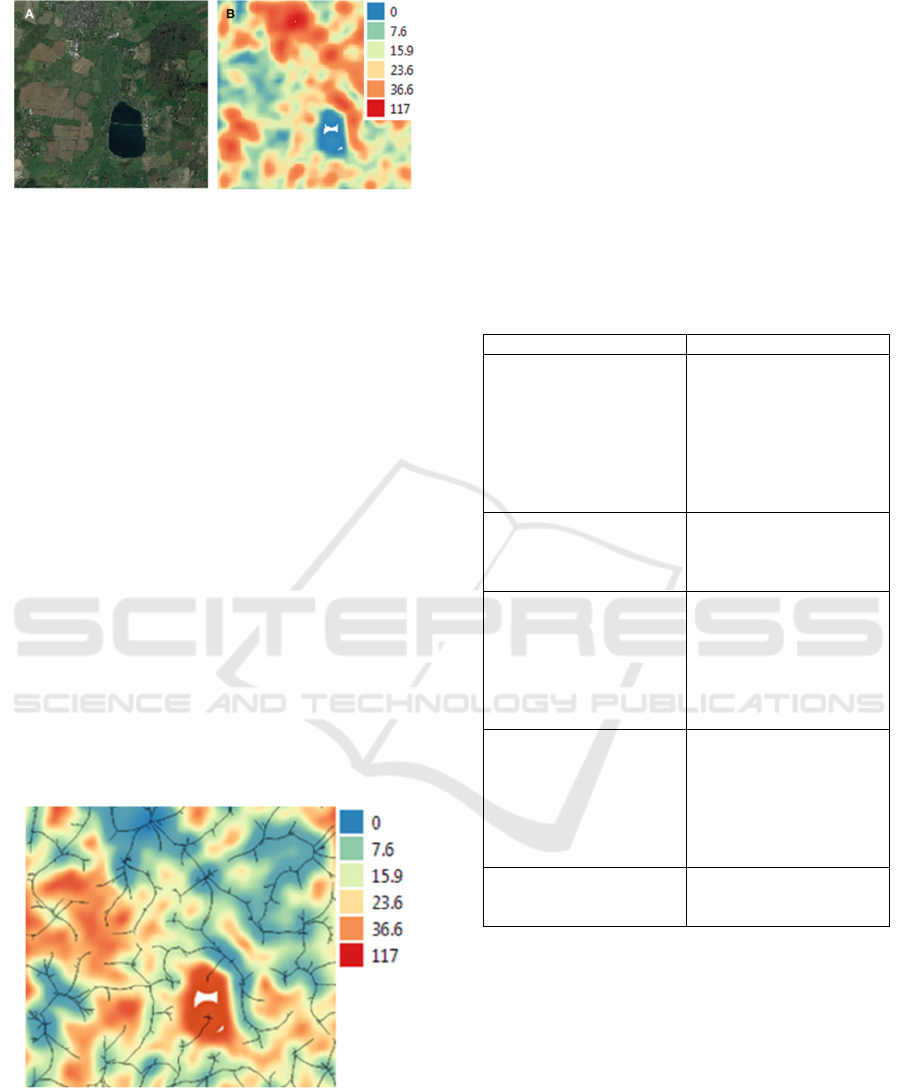
Figure 5: Construction of the terrain inhomogeneity map:
(A) the analyzed area (site1); (B) “landscape complexity”
map; the range shows the density of perceived elements in
the territory.
Figure 5 shows an example of the analysed area
(a) and the corresponding “landscape complexity”
map in the form of a “heat map” (b).
Z-value definition and flow mapping using
z-value
Z-value and flight characteristics were calculated
for pigeons. Based on the “landscape complexity”
map, z-value was calculated (as Invert Grid) for all
parts of the terrain; this is the equivalent of the
height used in relief maps. Z-value determines flow
direction for pigeon flight (“top-down”) in the
absence of additional stimuli. Flows were calculated
on the basis of the constructed heat map, using the
plugin GRASS r.watershed (Figure 6).
Thereafter, base centroids of calculated flow
paths points were constructed, and then applied to
analyse the results. This calculation takes into
account the fact that the distance between
neighbouring z-value isolines is significantly less
than distance between start and finish points (about
1%).
Figure 6: The calculated flows in the z-value map, built
from data on "landscape of difficulty".
3.3 QGIS Plugins
The data were processed using the open source
software program QGIS (http://qgis.org), including
additional analysis plugins: QGIS geoalgorithms and
GDAL tools (http://www.gdal.org) integrated into
QGIS. The source data layers were added using the
OpenLayers Plugin in QGIS, which allows to obtain
Google Maps, Bing Maps and another open layers.
In addition, analogues of "hydrological
parameters" were calculated in our model and a set
of maps was formed indicating the accumulation of
runoff towards the most saturated complex
landscape.
The applied QGIS tools and plugins are
presented in Table 1.
Table 1: Applied QGIS tools and external plugins.
Plugin Description
OpenLayers Plugin:
https://github.com/sourcepol
e/qgis-openlayers-plugin
QGIS plugin embeds
OpenLayers
(http://openlayers.org)
functionality.
It allows to obtain Google
Maps, Bing Maps,
OpenStreetMap and anothe
r
open source layers.
Points2One:
http://plugins.qgis.org/plugin
s/points2one
Create lines and polygons
from vertices. Connects
p
oints in a layer to form lines
and polygons.
Heatmap Plugin:
http://www.qgistutorials.com
/en/docs/creating_heatmaps.h
tml
Create a density raster of an
input point vector laye
r
b
ased on the number o
f
p
oints in a location, with
larger numbers of clustered
p
oints resulting in large
r
values.
GRASS r.watershed
https://grass.osgeo.org/grass7
6/manuals/r.watershed.html
Calculates hydrological
p
arameters and generates a
set of maps indicating flow
accumulation, drainage
direction, the location o
f
streams and watershe
d
basins.
SAGA Invert Grid
http://sagagis.org/saga_tool_
doc/7.1.1/grid_tools_34.html
Inverts a grid, i.e. the highest
value becomes the lowest
and vice versa.
4 RESULTS
4.1 Calculated Flow Paths and Real
Flight Routes for Pigeons
We compared the flow paths calculated based on the
surface flow simulation and the real GPS-trajectories
of untrained pigeons, using QGIS.
After simulation was completed, calculated flow
paths and real flight routes were compared using
pigeon GPS-tracks.
Identification of Sustainable Locations in Pigeon Flights using Flow Simulation Method
539
As the result of calculations, it was obtained that
for the countryside terrain (site 1), pigeons prefer to
fly over the calculated flow paths with a probability
of 16% greater than to not fly (p-value < .05). For
the urban area (site 2), there is no significant
dependence of flight over the calculated flow paths.
The samples of calculated flow paths and real
trajectories are shown in Figure 7.
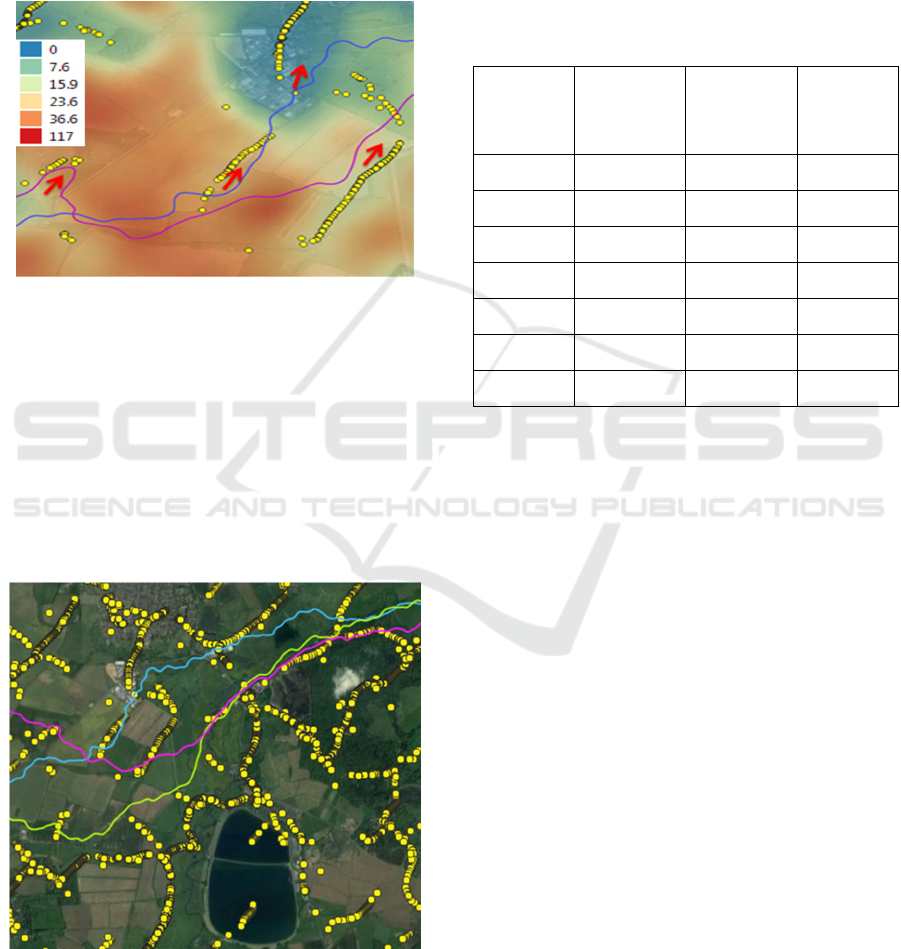
Figure 7: The flow paths calculated based on the surface
flow simulation and real flight routes of pigeons. Yellow
dots shows calculated flow paths, blue and magenta lines
shows real pigeons’ flight routes. A heat map with z-value
is shown as an additional layer (the legend for z-value is
shown in the upper left corner). Red arrows indicate places
of “adjustment” in the flight routes of pigeons, depending
on the surface properties.
Based on comparison of untrained and weakly
trained pigeons’ flights, it is apparent that training
leads to cases of reducing in the perceptibility of
terrain parameters (Figure 8).
Figure 8: Difference between the real route parameters for
one pigeon in first, second and third flights. Magenta line
– Flight1, green line – Flight2, blue line - Flight3, yellow
dots – centroids of calculated flow paths.
It was obtained that pigeons prefer to fly over
places with noticeable extended variations on
countryside landscape, with a probability of 16%
greater than to fly not over them.
Table 2 shows the ratio of the length of the flight
path within the flow area to the total length of the
flight path for untrained (1st flight) and weakly
trained (2nd and 3rd flights) pigeons.
Table 2: Comparison of results for untrained and weakly
trained pigeons.
Pigeons Untrained
1st flight
Weakly
trained
2nd flight
Weakly
trained
3rd flight
Pigeon 1 15,70% 29,80% 28,00%
Pigeon 2 37,30% 17,60% 19,70%
Pigeon 3 20,30% 32,20% 37,00%
Pigeon 4 39,00% 36,50% 32,50%
Pigeon 5 36,60% 33,00% 30,30%
Pigeon 6 30,40% 20,20% 18,00%
Pigeon 7 37,00% 25,80% 27,60%
The results of the comparison of calculated flow
paths and real flight routes were different for
untrained and weakly trained pigeons.
5 CONCLUSIONS
When pigeons fly across medium distances (about
10 km), visual features of the surface significantly
affect the probability of pigeon flights over this area.
The paper explored the flights of different
pigeons over mixed terrain. The trajectories of flight
of untrained and weakly trained pigeons are guided
not only by reference points or extended landmarks,
but also by the general structure of the terrain. After
perception, terrain’s surface determines the
sequential flow forms and influences the choice of
the direction of movement.
The influence of external visual information
causes birds to change their trajectories, which are
partially "attracted" not only to specific points of
interest, but also to areas with the most saturated
landscape.
In the present work it is shown that the attention
of untrained pigeons was most often diverted, they
deviated from the usual path selection algorithm,
ICPRAM 2020 - 9th International Conference on Pattern Recognition Applications and Methods
540

and began to shift to the areas of "saturated
landscape complexity".
The results of this work can be used to
understand the selection algorithms for the
navigational behavior of birds, other animals, or
humans.
REFERENCES
Biro, D. et al. (2007) ‘Pigeons combine compass and
landmark guidance in familiar route navigation’,
Proceedings of the National Academy of Sciences,
104(18), pp. 7471–7476. doi:
10.1073/pnas.0701575104.
Blaser, N. et al. (2013) ‘Testing cognitive navigation in
unknown territories: homing pigeons choose different
targets’, Journal of Experimental Biology, 216(16),
pp. 3123–3131. doi: 10.1242/jeb.083246.
Essaid, H. I. (1990) ‘A multilayered sharp interface model
of coupled freshwater and saltwater flow in coastal
systems: Model development and application’, Water
Resources Research. doi:
10.1029/WR026i007p01431.
Essaid, H. I., Bekins, B. A. and Cozzarelli, I. M. (2015)
‘Organic contaminant transport and fate in the
subsurface: Evolution of knowledge and
understanding’, Water Resources Research. doi:
10.1002/2015WR017121.
Ferrari, S. et al. (2018) ‘The Ring Vortex: A Candidate for
a Liquid-Based Complex Flow Phantom for Medical
Imaging’, in Tavares, J. M. R. S. and Natal Jorge, R.
M. (eds) VipIMAGE 2017. Cham: Springer
International Publishing, pp. 893–902. doi:
10.1007/978-3-319-68195-5_97.
Gallien, T. et al. (2018) ‘Coastal Flood Modeling
Challenges in Defended Urban Backshores’,
Geosciences, 8(12), p. 450. doi:
10.3390/geosciences8120450.
Graser, A. et al. (2019) ‘Untangling origin-destination
flows in geographic information systems’, Information
Visualization, 18(1), pp. 153–172. doi:
10.1177/1473871617738122.
Kano, F. et al. (2018) ‘Head-mounted sensors reveal
visual attention of free-flying homing pigeons’, The
Journal of Experimental Biology, 221(17), p.
jeb183475. doi: 10.1242/jeb.183475.
Lipp, H.-P. et al. (2004) ‘Pigeon Homing along Highways
and Exits’, Current Biology. England, 14(14), pp.
1239–1249. doi: 10.1016/j.cub.2004.07.024.
Mann, R. P. et al. (2014) ‘Landscape complexity
influences route-memory formation in navigating
pigeons’, Biology Letters, 10(1), pp. 20130885–
20130885. doi: 10.1098/rsbl.2013.0885.
Pettit, B et al. (2012) ‘Data from: Not just passengers:
Pigeons, Columba livia, can learn homing routes while
flying with a more experienced conspecific’,
Proceedings of the Royal Society B. Dryad Digital
Repository. doi: 10.5061/dryad.53f4b.
Pettit, Benjamin et al. (2012) ‘Not just passengers:
pigeons, Columba livia, can learn homing routes while
flying with a more experienced conspecific’,
Proceedings of the Royal Society B: Biological
Sciences, 280(1750), pp. 20122160–20122160. doi:
10.1098/rspb.2012.2160.
Rispoli, V. C. et al. (2015) ‘Computational fluid dynamics
simulations of blood flow regularized by 3D phase
contrast MRI.’, Biomedical engineering online.
BioMed Central, 14(1), p. 110. doi: 10.1186/s12938-
015-0104-7.
Sexton, J. O. et al. (2013) ‘Urban growth of the
Washington, D.C.–Baltimore, MD metropolitan region
from 1984 to 2010 by annual, Landsat-based estimates
of impervious cover’, Remote Sensing of Environment,
129, pp. 42–53. doi: 10.1016/j.rse.2012.10.025.
Stonedahl, S. H. et al. (2010) ‘A multiscale model for
integrating hyporheic exchange from ripples to
meanders’, Water Resources Research, 46(12). doi:
10.1029/2009WR008865.
Vyssotski, A. L. et al. (2009) ‘EEG Responses to Visual
Landmarks in Flying Pigeons’, Current Biology.
Elsevier Ltd, 19(14), pp. 1159–1166. doi:
10.1016/j.cub.2009.05.070.
Wiltschko, R. and Wiltschko, W. (2015) ‘Avian
Navigation: A Combination of Innate and Learned
Mechanisms’, in Advances in the Study of Behavior.
Elsevier Ltd, pp. 229–310. doi:
10.1016/bs.asb.2014.12.002.
Winter, T. C. et al. (1998) ‘Ground Water and Surface
Water - A single Resource - U.S. Geological Survey
Circular 1139’, USGS Publications. doi:
10.3133/CIR1139.
Identification of Sustainable Locations in Pigeon Flights using Flow Simulation Method
541
