
Graph-based Model Inspection Tool for Multi-disciplinary Production
Systems Engineering
Felix Rinker
1,2 a
, Laura Waltersdorfer
1,2 b
, Manuel Sch
¨
uller
1
and Dietmar Winkler
1,2 c
1
Institute of Information Systems Engineering, TU Wien, Austria
2
Christian Doppler Laboratory for Security and Quality Improvement in the Production System Lifecycle (CDL-SQI),
TU Wien, Austria
Keywords:
Domain-specific Modeling, Production Systems Engineering, Model-driven Engineering, Domain-specific
Languages, Model Quality, Multi-disciplinary Engineering.
Abstract:
Background. In Production Systems Engineering (PSE), the planning of production systems involves domain
experts from various domains, such as mechanical, electrical and software engineering collaborating and mod-
eling their specific views on the system. These models, describing entire plants, can reach a large size (up to
several GBs) with complex relationships and dependencies. Due to the size, ambiguous semantics and diverg-
ing views, consistency of data and the awareness of changes are challenging to track. Aim. In this paper we
explore visualizations mechanisms for a model inspection tool to support consistency checking and the aware-
ness of changes in multi-disciplinary PSE environments, as well has more efficient handing of AutomationML
(AML) files. Method. We explore various visualization capabilities that are suitable for hierarchical structures
common in PSE and identified requirements for a model-inspection tool for PSE purposes based on work-
shops with our company partner. A proof-of concept software prototype is developed based on the elicited
requirements. Results. We evaluate the effectiveness of our Information Visualisation (InfoVis) approach in
comparison to a standard modeling tool in PSE, the AutomationML Editor. The evaluation showed promising
results for handling large-scale engineering models based on AML for the selected scenarios, but also areas
for future improvement, such as more advanced capabilities. Conclusion. Although InfoVis was found useful
in the evaluation context, in-depth analysis with domain experts from industry regarding usability and features
remain for future work.
1 INTRODUCTION
Domain experts design production systems by mod-
eling various different components, which are again
made up of multiple other components, e.g. coil
cars with motors and which are connected to convey-
ors. In industrial settings, the number of such com-
ponents can rise up to thousands of single compo-
nents, which are clustered in hierarchical structures
depicting, important dependencies and relationships
in relation to neighboring elements. Multiple do-
main experts from different disciplines are involved
in this highly complex model engineering task in a
so-called round-trip engineering (RTE) process (Win-
kler et al., 2019). Engineers receive updates from
their colleagues and update the engineering artefacts
a
https://orcid.org/0000-0002-6409-8639
b
https://orcid.org/0000-0002-6932-5036
c
https://orcid.org/0000-0002-4743-3124
based on their domain-specific context (by using vari-
ous tools and local data models). Thus, changes from
different involved disciplines need to be incorporated
in the work of the workgroup and can easily cause
inconsistencies (Feldmann et al., 2016) and loss of
changes (Mordinyi and Biffl, 2015). The simulta-
neous contributions and adaptations to the common
repository and data model result in big and complex
model files, around 30 MB to several GBs with thou-
sands of elements. Traditional model inspection and
manipulation tools are mostly text-based, which are
hard to perceive and manage (Schiffelers et al., 2018).
However, so far, useful alternative approaches for this
kind of specialised models are limited: AML
1
is a
common data format, used in the engineering of pro-
duction systems, based on Extensible Markup Lan-
guage (XML).
Text-based approaches such as XML editors, are
1
AutomationML: www.automationml.org
116
Rinker, F., Waltersdorfer, L., Schüller, M. and Winkler, D.
Graph-based Model Inspection Tool for Multi-disciplinary Production Systems Engineering.
DOI: 10.5220/0008990001160125
In Proceedings of the 8th International Conference on Model-Driven Engineering and Software Development (MODELSWARD 2020), pages 116-125
ISBN: 978-989-758-400-8; ISSN: 2184-4348
Copyright
c
2022 by SCITEPRESS – Science and Technology Publications, Lda. All rights reserved

useful for the automated data exchange and simple
models. Unfortunately, for complex use cases com-
mon for PSE projects, models in text-based editors
are very hard to read for human domain experts, and
even more challenging for non-experts.
InfoVis is a field of research, which is concerned
with how humans perceive data and how to improve
this process by creating guidelines and best practices
(Mazza, 2009). Unstructured and large data sets are
challenging to be analysed by humans, if they are
not well presented in a human-readable way. Graph-
based data representation can support effective and
efficient model processing (Card et al., 1999) by re-
ducing the user’s cognitive load and search effort and
by supporting the recognition of patterns and data
changes. Therefore, visualization approaches for this
knowledge-intensive working process could be the
foundation to enable easier checking for a) data con-
sistency and (b) tracking of changes across disciplines
in PSE projects.
Because of a large amount of generated engineer-
ing data in typical engineering projects, such as pro-
duction plants or steel mills, an appropriate model
inspection approach is essential to focus on relevant
information parts to stakeholders (such as discipline-
specific views).
The goal of this paper is to explore graph-based
visualisation methods in PSE to improve the represen-
tation of engineering models to increase the efficiency
and effectiveness of overall modeling process. Based
on elicited requirements and use cases from key stake-
holders, we built a software prototype and conceptu-
ally evaluated the prototype against a standard PSE
tool, the AML editor. From the research, we expect
the following contributions for the model-driven en-
gineering community: The use cases can give Infor-
mation System Engineering (ISE) researchers insights
into needs for model inspection requirements for PSE
engineering data sets in order to improve engineering
projects and products. The research questions (RQs)
are formulated as follows:
RQ1. What are critical requirements and fea-
tures for handling multi-disciplinary PSE models?
Multi-disciplinary PSE models are associated with
multiple challenges, such as diverging formats views
and semantics and the needed integration of various
tools (Trunzer et al., 2017). Models and artefacts tend
to be complex and not straightforward for human ex-
perts to analyse.
Therefore, we propose InfoVis a general research
area to design data according to user’s specific
needs to improve perception and to support informed
decision-making (Mazza, 2009).
However, suggested methods are often not de-
signed to support visualization in the heterogeneous
engineering environments, such as the production
systems domain. In order to adapt these methods to
the domain’s specific needs, we discuss different rep-
resentation means for visualising model data. Fur-
thermore, we analysed the basic use case of data ex-
change and modeling in the process of production
systems engineering. We paired up with the most op-
timal design choices for identified challenges in PSE
and derive requirements and scenarios for a graph-
based visualisation tool in multi-disciplinary PSE.
RQ2. How does the graph-based modeling ap-
proach perform compared to a standard modeling
tool in PSE in terms of modeling inspection capabil-
ities? Based on the derived requirements, we devel-
oped a proof-of-concept software prototype, handling
AML files, which applies the visualization approach
to the PSE context. In a comparative feasibility study
we investigated the performance of the prototype in
comparison with the AMLEditor (as one example of
best practices for AML data handling). The evalua-
tion context was that both tools were tested for a se-
quence of steps from the use cases. Performance was
measured based on Keystroke-Level Method (KLM)
with focus on effectiveness and effort for data han-
dling by measuring the time needed in both software
tools.
The remainder of this paper is structured as fol-
lows: Section 2 presents related work on fundamental
data structures and visualization in PSE and Automa-
tionML as representative for a standardized data ex-
change language based on XML. Section 3 presents
identified requirements and common tasks for the use
case of model exchange and manipulation. We de-
scribe the solution approach in Section 4 and present
the results of the evaluation in Section 5. We discuss
our findings and related limitations in Section 6. Fi-
nally, Section 7 concludes and identifies future work.
2 RELATED WORK
This section summarizes related work on data struc-
tures and visualization in PSE and AML.
2.1 Visualisation Techniques
There are multiple well-known visualization ap-
proaches for structural data (Holten, 2006), common
to PSE projects, such as Rooted Trees, Tree Maps, Ra-
dial Trees and Force-directed Tree, shown in figure 1.
Rooted Trees support the visualization of hierarchi-
cal relations (see Fig. 1a). However, for large
Graph-based Model Inspection Tool for Multi-disciplinary Production Systems Engineering
117

Company
Project
Area Area
SubArea Group FunctionGroup
FunctionGroup
(a)
(b)
(c) (d)
Figure 1: Tree visualizations approaches: (a) Rooted Trees
(b) Radial Trees (c) Tree-Maps (d) Force-directed Tree.
data structures this representation requires addi-
tional functionality for efficient model handling.
Radial Trees. In comparison to the rooted tree, the
representation of a Radial Tree has a central posi-
tioned root node, which provides a more efficient
utilization of the available space (Fig. 1b).
Tree Maps represent the data in rectangular sections
accordingly to the size of the representing data
(Fig. 1c), which is better suited for displaying
larger data structures, but not for cross-references.
Force-Directed Graphs (Fig. 1d) are usually created
by algorithms simulating the position of nodes
based on force simulation (force between nodes,
attracting or repelling each other). The usage of
the available space for visualization is optimized
by algorithms.
2.2 Domain Modeling in Production
Systems Engineering
In PSE, L
¨
uder et al. (L
¨
uder et al., 2018) identified
two major challenges for efficient data and model ex-
change: (a) Unclear requirements and limited benefits
of data exchange for stakeholders and (b) the com-
plexity of integrating heterogeneous engineering tools
and data. Change and consistency management are
important topics, but are challenging due to the mul-
titude of data sources (Vogel-Heuser et al., 2014).
These topics are often handled only in local con-
texts in workgroups without considering relationships
outside these context, e.g., on organizational level.
Furthermore, the tool-driven approach to model en-
gineering also affects the overall process: Proprietary
file formats and modeling structures hinder the seam-
less model integration and transformation (Biffl et al.,
2009). Making element and attribute changes and
effects on related dependencies (between these ele-
ments) visible to involved stakeholders can increase
data model exchange efficiency and can improve the
quality of the overall engineering output (Biffl et al.,
2019). In multi-disciplinary PSE, system designs
and plans are typically modeled based on hierarchi-
cal structures including a set of different views.
Although, tools help to increase productivity and
product quality, there are still several shortcomings
to be addressed: Lack of usability and interoperabil-
ity and high complexity require high trainings effort
and lots of domain expertise (Bordeleau et al., 2017).
Traceability modeling in hetereogenous systems is
also more tailored to specific formats, such as Ecore
for example (Mustafa and Labiche, 2015). However,
consistency and changes tracking is an essential char-
acteristic in order to guarantee high quality of outputs,
such as control code or simulation models for param-
eter estimation (Feldmann et al., 2016).
Schiffelers et al. have proposed the concept
of multi-disciplinary ecosystems in order to for-
malise means for automatic consistency checking and
improved model transformation (Schiffelers et al.,
2018). Therefore, we aim to visualise the grow-
ing hierarchical structure of plant topologies, as an
important step towards increasing the efficiency in
domain-specific modeling in terms of providing a bet-
ter overview about data model structures. Vathoopan
et al. describe how mechatronic AML models can
be visualised to enable model-based automation en-
gineering (Vathoopan et al., 2018) and report positive
initial experiences from prototype development.
2.3 AutomationML
In context of a PSE project, AML is an important
data exchange format for modeling hierarchical struc-
tures as a foundation for efficient data exchange in
heterogeneous engineering environments. AML is a
standardized data format, based on XML, especially
designed for storing and exchanging plant engineer-
ing information. The standard extends other already
established standards in PSE, such as Computer-
Aided Engineering eXchange (CAEX) , COLLADA,
and PLCopenXML (Drath, 2009). The usage of
CAEX enables an object-orientated approach (Drath
et al., 2008): System unit classes define system ob-
jects and can be gathered in system unit libraries.
RoleClasses define the semantics of an object.
Interface classes describe an abstract relation
an object can have or also information which is not
covered within the CAEX based model. AML files
are described in a hierarchical structure, also called
MODELSWARD 2020 - 8th International Conference on Model-Driven Engineering and Software Development
118
Instance Hierarchy.
Because AML is a XML-based data format, en-
gineers can view and modify engineering data with
common text editors or XML editors, however for
large structures this approach does not provide a clear
overview.
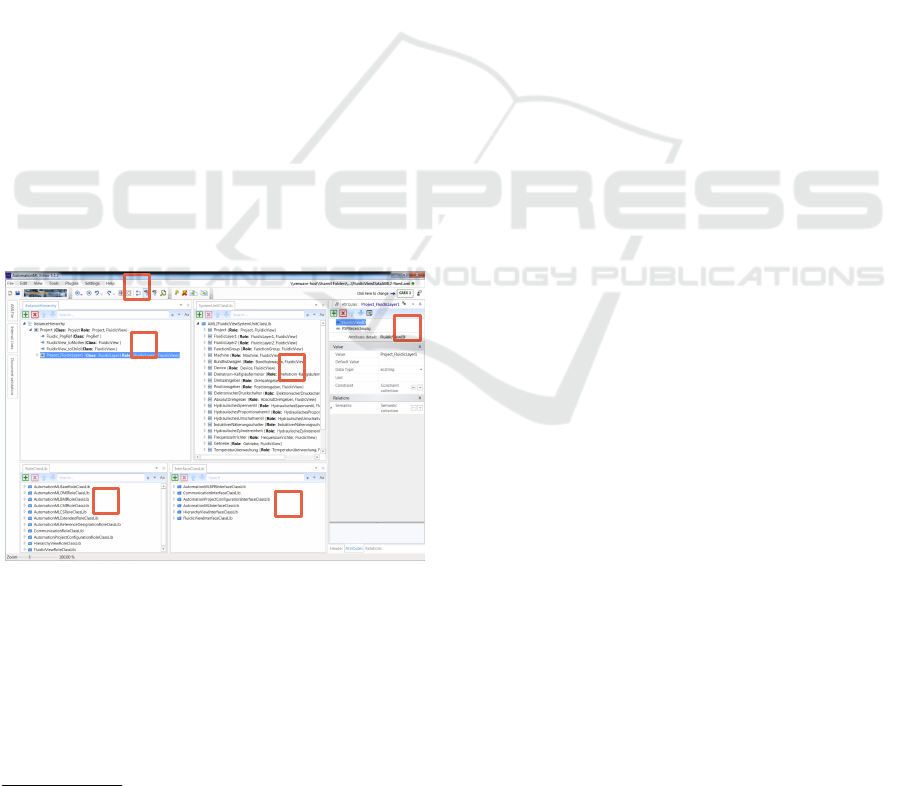
ForAML, an AutomationML Editor
2
is available.
Note that the editor has been designed for support-
ing engineers in handling AML files and represents
the recommended tool
3
in PSE context. Fig. 2 il-
lustrates the AutomationML Editor using the intended
tree structure to visualize the project instance hier-
archy (1). Individual elements can be expanded to
their sub-nodes, also the side panel helps to under-
stand the project instance hierarchy (5). Other win-
dows areas displaying further parts of an AML file
such as SystemUnitClass libraries (2), RoleClass
libararies (3) and InterfaceClass libraries (4). In
the top panel are editing options located such as sav-
ing, importing etc. (6).
However, a major disadvantage of this editor is the
poor utilization of the given screen space. The tree
representation mostly expands downwards (1), which
means that especially for larger structures, users have
to scroll and search extensively to search for compo-
nents. Further, the search functionality is quite lim-
ited, e.g., searching for attribute values of a certain
device is not supported until now.
1
2
3
4
5
6
Figure 2: AutomationML Editor Components and a sample
instance hierarchy in PSE.
Because AML represents the foundation for (a)
engineering data and model exchange in PSE and (b)
the identified limitations of the AutomationML Editor
there is the need to support engineers by improving
AML data handling.
2
AML Editor: www.automationml.org
3
AML Association:www.automationml.org
3 REQUIREMENTS FOR THE
VISUALISATION OF
ENGINEERING DATA
This section summarizes identifies requirements and
common use cases for the visualisation of PSE data.
3.1 Requirements for an Engineering
Data Visualisation
Following the design science cycle (Wieringa, 2014),
we conducted an improvement initiative at our in-
dustry partner to explore AML data handling. In
workshops with 28 domain experts from 12 work-
groups, we collected material and provided data from
the company partner. Based on this input we identi-
fied a set of fundamental requirements for AML data
visualization and data handling in PSE context. Con-
cluding, we derived the following requirements for a
graph-based visualization approach.
Project Hierarchy (R1). AML uses a hierarchi-
cal structure for representing the topology of the
plant. Different engineering concepts in PSE are
typically organized within this structure. Thus, a
visualization approach needs to support a hierar-
chical project structure.
Cross-references (R2). This requirement describes
relationships and dependencies between different
concepts and attributes. To prevent consistency
errors, the connections between different disci-
plines need to be visible.
Size of Data Structures (R3). Typical AML files
could be quite big (up to GBs of structured in-
formation in XML format). Therefore, engineers
need to have a concise and efficient overview over
this structure to assess individual elements.
Discipline-neutral View (R4). In PSE different
disciplines, such as electrical, mechanical, and
software disciplines, have to collaborate and ex-
change data. However, specific engineers want
to focus on their local views (within their dis-
ciplines) without getting bothered by informa-
tion that are not relevant for them. Therefore,
discipline-neutral views are needed.
Note that these requirements have been elicited from
industry and domain experts in context of PSE as
foundation for the visualization of AML data.
3.2 Scenarios for Evaluation
For evaluation purposes, we focus on typical use
cases, derived from basic functions of the Automa-
Graph-based Model Inspection Tool for Multi-disciplinary Production Systems Engineering
119
tionML Editor as reference implementation for AML
data handling. These function include importing
AML files, adding, modifying and removing AML
data elements and searching for AML data. Further-
more, we include expected functions, not available in
the editor, such as search for attribute values. There-
fore, we derived the following set of use cases:
UC-1: Import & Export of an AML file. To support
a round-trip engineering process (Winkler et al.,
2019), the import (UC-1.1) and export (UC-1.2)
of AML files is essential as the basis for data man-
agement. A user’s first step is usually the import
of a AML file in order to view or edit imported
data. Exporting an AML file is necessary to share
data with other stakeholders or to import the data
into another tool (within the tool chain) for ad-
vanced data manipulation operations.
UC-2: Navigation in Project Data. Engineers
need to navigate through project data in order
to efficiently process engineering data: (UC-2.1)
Show individual components that are relevant to
one specific engineering discipline and get an
overview of a specific discipline; or (UC-2.2) Get
an overview on relationships and dependencies to
related disciplines, such as attributes relevant for
the electrical and software discipline.
UC-3: Search in Project Data. This use case con-
cerns the search for specific values in the project
data: (UC-3.1) Engineers need to be able to search
for a specific name of a component; or (UC-3.2)
Engineers need to search for a specific attribute
value of a component.
UC-4: Modify Project Data. The user also needs to
be able to interact with the data: (UC-4.1) to add a
component, (UC-4.2) to edit a component , (UC-
4.3) to move component within the hierarchical
structure, or (UC-4.4) to remove a component.
To support elicited requirements and identified use
cases, we developed a prototype solution based on a
graph-based visualization for AML files.
4 SOLUTION APPROACH
In this section we present our solution approach based
on the required capabilities and requirements, and use
cases.
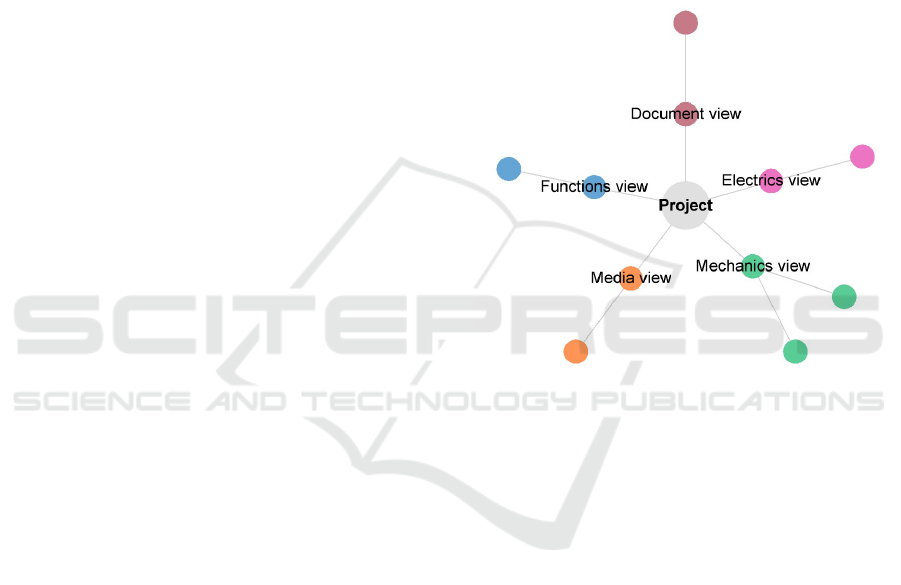
4.1 Visualisation of Project Hierarchy
We decided to use a node-link graph as main visual-
isation approach for the project structure. Main ben-
efit of this form is that users intuitively are aware of
the hierarchical structure of components without be-
ing trained for this visualisation technique. Further-
more, the Radial Tree visualisation was chosen since
the usage of available space is much more efficient in
comparison to other techniques. The project hierar-
chy is visualised by differently colored tree branches
show in Fig. 3. The maximum of simultaneously dis-
played items was chosen to be two levels to reduce
the load of working memory limits. By default com-
ponent names are hidden to reduce unnecessary infor-
mation, by hovering over the component the name of
the component is displayed.
Figure 3: Discipline-specific views in radial tree represen-
tation.
4.2 Visualisation of Cross-references
Pure tree visualizations are not the best approach to
visualize non-hierarchical relationships and depen-
dencies, therefore the chosen Radial Tree approach
needs adaptations to accommodate to the require-
ments described in section 3. One example for a
cross-reference is the component of an electrical mo-
tor that is described in multiple disciplines: Electri-
cal engineers specify the required power supply while
mechanical engineers specify the dimensions of the
motors and other parameters. Therefore, we visualise
the InstanceHierarchy by drawing connections be-
tween the nodes with links, if selected. The rest of the
tree is greyed out during the selection to let the user
focus on the relevant connections as seen in figure 4.
4.3 Space-efficient Visualisation
Certain decisions were made to de-clutter the visual
space, but use effective means of information visuali-
MODELSWARD 2020 - 8th International Conference on Model-Driven Engineering and Software Development
120

Figure 4: Visualising cross-references.
sation, and to make the most out of the limited avail-
able space:
Force-directed Graph Algorithm was imple-
mented to arrange the nodes in an optimal way.
Labels were only displayed where needed, for ex-
ample the label of the root node, for nodes repre-
senting views Mechanical view and currently se-
lected nodes.
Color is used to visualise the view the nodes be-
longs to, the Electrics view is colored in pink, or-
phan nodes (without a parent), are colored in red
to bring attention to them.
Shapes In our case, shapes codify hierarchical infor-
mation about the node:
Circles denote components that have one or
more sub-components.
Squares denote components without any sub-
component.
Triangles denote orphan nodes.
Size This feature was only used for the root node,
being bigger than the others.
4.4 Evaluation Prototype
A prototype, consisting of a frontend web application
and a simple backend service for data model manage-
ment, was built to show the feasibility of the concepts
and as a foundation for further validation. The fron-
tend web application is based on Angular 6
4
. Fur-
ther noteworthy libraries are the Reactive Program-
ming library RXJS
5
and the JavaScript (JS) library
4
Angular: angular.io
5
RXJS: reactivex.io
Data-Driven Documents (D3)
6
. The backend service
is based on Spring Boot
7
. The User Interface (UI)
as shown in Fig. 5 consists of a main view, display-
ing the hierarchy of the current project (1) and im-
port and export function (2). Nodes can be double-
clicked to re-arrange the view around them. An-
other panel presents detailed information of the se-
lected node (3). Currently, the following information
are displayed here, Details (Name, ID, Parent Node),
Attributes, Values. The different views can also be
viewed (4). The edit function for nodes is on the bot-
tom right. Add, remove and edit functions are also
supported (5).
A search function is also implemented (6), so that
users can search components by name or attribute.
For better understanding of functionalities, we have
provided several screencasts.
8
5 PERFORMANCE EVALUATION
This section reports on the evaluation of the ap-
plied visualisation techniques in the PSE domain. To
evaluate whether the proposed solution approach and
the developed prototype supports the process perfor-
mance for domain experts in real-life, we measured
the tasks, introduced in Section 3.2, via the KLM first
described in (Card et al., 1983).
Table 1: List of standard KLM operators, including short-
hands and estimated execution time (in seconds) (Kieras,
2001).
Shorthand Operator Exec. time
K Keystroke 0.12 – 1.2
T(n) Type sequence of n
characters
n x K
P Point with mouse to
target on display
1.1
B Press or release mouse
button
0.1
BB Click mouse button 0.2
H Move hand to key-
board or mouse
0.4
M Mental act of routine
thinking
0.6 - 1.35
W(t) Waiting for the system
to respond
t
The aim of this method is to measure the needed
execution time by expert users. To achieve this, per-
6
Java Script Library D3: https://d3js.orgd3js.org
7
Spring Boot: spring.io/projects/spring-boot
8
https://qse.ifs.tuwien.ac.at/2019-graph-visualization/
Graph-based Model Inspection Tool for Multi-disciplinary Production Systems Engineering
121
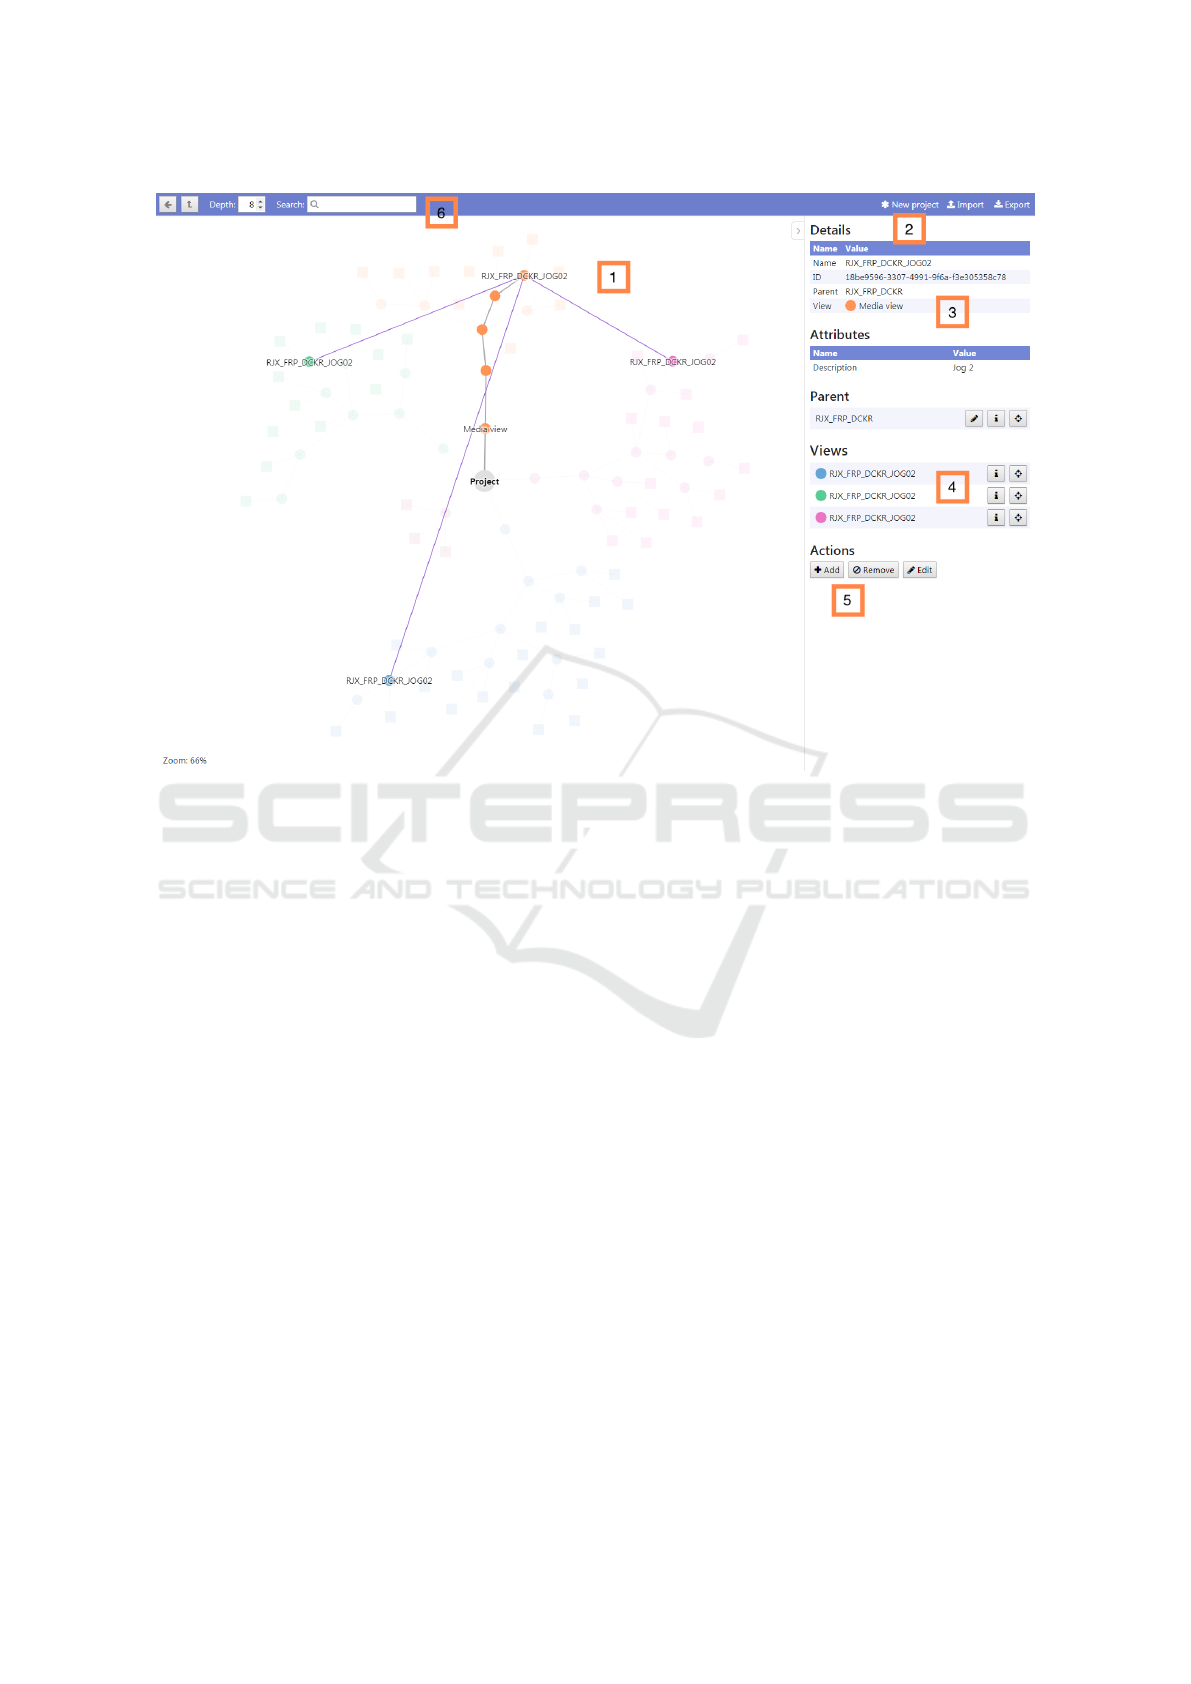
Figure 5: User Interface of the Visualization Software Prototype.
formed tasks are broken into atomic keystroke-level
actions. For so-called Operators, a standard set of ac-
tions and empirical data has been collected that repre-
sents the average execution time frames, which can be
observed in Table 1. The method can also take into ac-
count Mental Operators, breaks where the user stops
the action and thinks either to find a function in the
UI or recalling an information. Finally, all execution
times are added up, so the time efficiency between
different systems can be measured. To test an initial
evaluation, a relatively small and simple data set was
created to measure performance between the Automa-
tionML Editor and the software prototype. To imi-
tate the multi-disciplinary engineering environment,
that is common in PSE, 98 components were created,
which were modelled in different views (disciplines).
The following tasks were measured, according to the
derived requirements and grouped by the scenarios in-
troduced in Section 3.2:
UC-1 Import & Export of an AML File
Task-1a Import an AML file
Task-1b Export an AML file
UC-2 Navigate in Project Data
Task-2a Showing only components relevant to a
specific engineering discipline
Task-2b Showing which other views a compo-
nent is related to
UC-3 Search in Project Data
Task-3a Searching for a component by name
Task-3b Searching for a component by attribute
value
UC-4 Modify the Project Data
Task-4a Add a new component
Task-4b Editing the details of a component
Task-4c Changing the hierarchy of a component
Task-4d Removing a component
5.1 Results
In this section we focus on the calculations of the first
use case Import & Export of a AML file in both Au-
tomationML Editor and the Prototype Solution. Ta-
ble 2 presents the summarized results of all use cases.
For details refer to (Rinker et al., 2019). The summa-
rized results in Table 2 show, that except from two
scenarios import an AML file and edit project data
the proposed prototype fares better measured with the
KLM method. These results are promising that the
designed solution could help PSE engineers to man-
age engineering models more efficiently. However,
MODELSWARD 2020 - 8th International Conference on Model-Driven Engineering and Software Development
122

this hypothesis must be tested in more detail in future
work.
UC 1.1: Importing an AutomationML File
AutomationML Editor. (1) Initiate the import
(decide to carry out the task) M (2) Find, point to and
click the ”Open a file” button M, P, BB (3) Wait for
the ”Select file” dialog to open W(0.5) (4) Find the
desired file in the shown list M (5) Point to to the
desired file P (6) Double click the left mouse button
2BB (7) Check that the root component is visible in
the Instance Hierarchy window M
Total time = 4M + 2P + 3BB + W(0.5) = 4*1.2
+ 2*1.1 + 3*0.2 + 0.5 = 8.1 sec
Prototype. (1) Initiate the import (decide to carry
out the task) M (2) Find, point to and click the
”Import” button M, P, BB (3) Wait for the ”Select
file” dialog to open W(0.5) (4) Find the desired file
in the shown list M (5) Point to the desired file P (6)
Double click the left mouse button 2BB (7) Wait for
the graph to initialize W(1.5) (8) Check that the root
component is visible in the main view M
Total time = 4M + 2P + 3BB + W(1.5) + W(0.5) =
4*1.2 + 2*1.1 + 3*0.2 + 1.5 + 0.5 = 9.6 sec
UC 1.2: Exporting an AutomationML File
AutomationML Editor. (1) Initiate the export
(decide to carry out the task) M (2) Find, point to and
click the ”File” dropdown menu M, P, BB (3) Wait
for the ”File” dropdown menu to open W(0.5) (4)
Find, point to and click the ”Save as...” menu item
M, P, BB (5) Wait for the ”Save as” dialog to open
W(0.5) (6) Decide what name the new file should
be given M (7) Move hand from mouse to keyboard
H (8) Enter the name of the new file (”export.aml”)
T(10) (9) Hit the Enter key K (10) Wait for the file to
be stored W(0.5)
Total time = 4M + 2P + H + K + 2BB + T(10)
+ 3W(0.5) = 4*1.2 + 2*1.1 + 0.4 + 0.28 + 2*0.2 +
10*0.28 + 3*0.5 = 12.38 sec
Prototype. (1) Initiate the export (decide to carry
out the task) M (2) Find, point to and click the
”Export” button M, P, BB (3) Wait for the ”Save as”
dialog to open W(0.5) (4) Decide what name the new
file should be given M (5) Move hand from mouse
to keyboard H (6) Enter the name of the new file
(”export.aml”) T(10) (7) Hit the Enter key K (8) Wait
for the file to be stored W(0.5)
Total time = 3M + P + H + K + BB + T(10) +
2W(0.5) = 3*1.2 + 1.1 + 0.4 + 0.28 + 0.2 + 10*0.28
+ 2*0.5 = 9.38 sec
Table 2: Calculated execution times for the tasks (in sec-
onds), first performed with AutomationML Editor and then
with the Prototype solution.
Tasks AML-Editor Prototype
Task-1a 8.1 9.6
Task-1b 12.38 9.38
Task-2a - 4.4
Task-2b 36.3 13.9
Task-3a 18.98 12.16
Task-3b - 12.44
Task-4a 35.28 22.4
Task-4b 13.18 13.68
Task-4c 9.0 8.7
Task-4d 35.6 10.4
6 DISCUSSION
This section discusses results of the research ques-
tions introduced in Section 1.
RQ1. What are critical requirements and features
for handling complex PSE models ?
We derived requirements and actions that are usu-
ally performed by engineers in multi-disciplinary
environments in Section 3. The following re-
quirements were identified: The ability to repre-
sent project hierarchy, The capability to repre-
sent cross-references between components, An ef-
ficient way to represent large data structures and
A discipline-neutral view. Furthermore, we de-
rived the following four basic use cases described
in Section 3.2, which are representative for the
daily work of an engineer in PSE: UC-1 Import &
Export of an AML file, UC-2 Navigate in Project
Data, UC-3 Search in Project Data, UC-4 Modify
the Project data.
RQ2. How does the graph-based modeling ap-
proach perform compared to a standard model-
ing tool in PSE in terms of modeling inspection
capabilities?
To answer this research question, we designed
and implemented a web-based prototype to test
whether our design decisions could have a posi-
tive impact on the effectiveness of handling engi-
neering data. To test this hypothesis, we conduced
a comparison study with a default PSE-modeling
Graph-based Model Inspection Tool for Multi-disciplinary Production Systems Engineering
123

tool the AutomationML Editor and measured with
KLM, needed steps for both approaches. The out-
come showed promising results in terms of mod-
eling efficiency in favor of our software prototype.
However, the results must be validated also with
more complex use cases and under different as-
pects, such as understandability.
Limitations. There are certain limitations and
threats to validity to this work: The prototype in
its current form, only covers the discussed scenar-
ios, however there are more advanced and com-
plex use cases, that are necessary for the daily work
and to support true round-trip engineering in PSE.
The generated test data was relatively simple and
small in comparison to real-world production sys-
tem data sets. Furthermore, it does not cover the
whole functionality of the AML standard, such as
SystemUnitClasses, RoleClasses, and references
to external resources. Furthermore, the visual aspects
for graph-based model inspection need to be tested if
they produce better results for model comprehension
of users.
Concerning the evaluation, KLM is a static calcu-
lation method. This validation does not test the data
with real participants, regarding usability. These lim-
itations should be covered in future work to ensure
increased validity for the results.
7 CONCLUSION AND FUTURE
WORK
Graph-based model inspection approaches in PSE
have not gained much attention so far, although there
are various benefits of implementing such a visuali-
sation: Such tool-based solutions can provide a bet-
ter understanding of project relationships and depen-
dencies between disciplines. The holistic overview
over multiple disciplines has the potential to decrease
defects and effort for data integration, such as con-
sistency and change checking. Consequently, data
quality and chances for successful completion of PSE
projects could be increased.
We introduced and investigated PSE scenarios and
InfoVis methods to improve the model perception in
PSE. Our proposed solution has the mentioned draw-
backs and shortcomings that need to be addressed in
future research. However, the identified gaps in re-
search, the requirements for visualising engineering
data and proof of concept in form of a developed soft-
ware prototype contribute to the field of model-based
engineering and can be a foundation for future re-
search. Our results are an initial step to gather knowl-
edge in the area of applying InfoVis methods in the
PSE domain to improve the model quality in a multi-
disciplinary industrial context.
Future Work. To overcome the limitations of the
basic test data and to evaluate the findings of this pa-
per additional research is needed. Suggestions for
future work is to extend and configure the prototype
with special test data-sets for each discussed use case
and to collect empirical data instead of relying on the
KLM method. Usability tests or field studies would
be viable approaches and also the testing of other vi-
sualisation techniques could add more value to the re-
search. In this work we focused on visualising the
project hierarchy, to make it more useful for real-
world applications, more functions of AML should be
added.
ACKNOWLEDGEMENT
The financial support by the Christian Doppler Re-
search Association, the Austrian Federal Ministry for
Digital & Economic Affairs and the National Foun-
dation for Research, Technology and Development is
gratefully acknowledged.
REFERENCES
Biffl, S., L
¨
uder, A., Rinker, F., and Waltersdorfer, L.
(2019). Efficient engineering data exchange in multi-
disciplinary systems engineering. In International
Conference on Advanced Information Systems Engi-
neering, pages 17–31. Springer.
Biffl, S., Schatten, A., and Zoitl, A. (2009). Integration of
heterogeneous engineering environments for the au-
tomation systems lifecycle. In 2009 7th IEEE Inter-
national Conference on Industrial Informatics, pages
576–581. IEEE.
Bordeleau, F., Liebel, G., Raschke, A., Stieglbauer, G., and
Tichy, M. (2017). Challenges and research directions
for successfully applying mbe tools in practice. In
MODELS (Satellite Events), pages 338–343.
Card, S. K., Mackinlay, J. D., and Shneiderman, B., editors
(1999). Readings in Information Visualization: Using
Vision To Think. Morgan Kaufmann Publishers Inc.,
San Francisco, CA, USA.
Card, S. K., Moran, T. P., and Newell, A. (1983). The psy-
chology of human-computer interaction, volume 15.
CRC Press.
Drath, R. (2009). Datenaustausch in der Anlagenplanung
mit AutomationML: Integration von CAEX, PLCopen
XML und COLLADA. Springer-Verlag.
MODELSWARD 2020 - 8th International Conference on Model-Driven Engineering and Software Development
124

Drath, R., Luder, A., Peschke, J., and Hundt, L. (2008).
Automationml-the glue for seamless automation en-
gineering. In 2008 IEEE International Conference
on Emerging Technologies and Factory Automation,
pages 616–623. IEEE.
Feldmann, S., Wimmer, M., Kernschmidt, K., and Vogel-
Heuser, B. (2016). A comprehensive approach for
managing inter-model inconsistencies in automated
production systems engineering. In 2016 IEEE Inter-
national Conference on Automation Science and En-
gineering (CASE), pages 1120–1127. IEEE.
Holten, D. (2006). Hierarchical edge bundles: Visualiza-
tion of adjacency relations in hierarchical data. IEEE
Transactions on Visualization and Computer Graph-
ics, 12(5):741–748.
Kieras, D. (2001). Using the keystroke-level model to esti-
mate execution times. Technical report, University of
Michigan.
L
¨
uder, A., Pauly, J.-L., Kirchheim, K., Rinker, F., and Biffl,
S. (2018). Migration to AutomationML based Tool
Chains - incrementally overcoming Engineering Net-
work Challenges. In 5th AutomationML User Confer-
ence.
Mazza, R. (2009). Introduction to information visualiza-
tion. Springer Science & Business Media.
Mordinyi, R. and Biffl, S. (2015). Versioning in cyber-
physical production system engineering: best-practice
and research agenda. In Proceedings of the First Inter-
national Workshop on Software Engineering for Smart
Cyber-Physical Systems, pages 44–47. IEEE Press.
Mustafa, N. and Labiche, Y. (2015). Towards traceabil-
ity modeling for the engineering of heterogeneous
systems. In 2015 3rd International Conference on
Model-Driven Engineering and Software Develop-
ment (MODELSWARD), pages 321–328. IEEE.
Rinker, F., Waltersdorfer, L., Sch
¨
uller, M., and Winkler, D.
(2019). Information Visualization in Production Sys-
tems Engineering. Tech. Report CDL-SQI 2019-15,
TU Wien.
Schiffelers, R. R., Luo, Y., Mengerink, J., and van den
Brand, M. (2018). Towards automated analysis
of model-driven artifacts in industry. In MODEL-
SWARD, pages 743–751.
Trunzer, E., Kirchen, I., Folmer, J., Koltun, G., and Vogel-
Heuser, B. (2017). A flexible architecture for data
mining from heterogeneous data sources in automated
production systems. In 2017 IEEE International Con-
ference on Industrial Technology (ICIT), pages 1106–
1111. IEEE.
Vathoopan, M., Walzel, H., Eisenmenger, W., Zoitl, A., and
Brandenbourger, B. (2018). Automationml mecha-
tronic models as enabler of automation systems engi-
neering: Use-case and evaluation. In 2018 IEEE 23rd
International Conference on Emerging Technologies
and Factory Automation (ETFA), volume 1, pages 51–
58. IEEE.
Vogel-Heuser, B., Diedrich, C., Pantf
¨
order, D., and G
¨
ohner,
P. (2014). Coupling heterogeneous production sys-
tems by a multi-agent based cyber-physical produc-
tion system. In 2014 12th IEEE International Confer-
ence on Industrial Informatics (INDIN), pages 713–
719. IEEE.
Wieringa, R. J. (2014). Design science methodology
for information systems and software engineering.
Springer.
Winkler, D., Rinker, F., and Kieseberg, P. (2019). Towards a
flexible and secure round-trip-engineering process for
production systems engineering with agile practices.
In Proc. of the Software Quality Days (SWQD), pages
14–30, Cham. Springer Int. Publishing.
Graph-based Model Inspection Tool for Multi-disciplinary Production Systems Engineering
125
