
Analysis of Vessel Movements using Association Rules
Noviyanti Santoso, Wahyu Wibowo, and Nur Azizah
Department of Business Statistics, Institut Teknologi Sepuluh Nopember, Surabaya, Indonesia
Keywords: Vessel Movements, Association Rules, VISITS
Abstract: Currently, ship traffic and the situation of sea waters are essential for several countries, including Indonesia
as an archipelago. The automatic Identification System of ITS (VISITS) provides data containing a variety
of information about vessel movements and traffic characteristics in Java sea waters. We use data mining
techniques to identify and determine ships' movement patterns in the Java sea, especially the Lombok Strait.
The objects of research are ships around the Lombok Strait because it is one with hefty ship traffic. Based
on the analysis results, we obtain information that the dominant types of ships passing in the Lombok Strait
are cargo ships with medium vessel speed and relatively spread out the course over ground, as many as 25%
of ships heading to the South. Furthermore, using the a priori algorithm association rules method, 14 rules
are obtained for a maximum of 3 items and 26 rules for a maximum of 4 items. The rules with the highest
lift score state that if the ship's coordinates are at Latitude = 7 and Longitude = 116, and type = Cargo ship,
then the course over ground is about 180° - 225° or the vessel is heading South.
1 INTRODUCTION
Indonesia is a country with a big sea area called an
archipelago. Indonesia has the potential to develop
the existing marine. Apart from abundant marine
resources, Indonesian seas are also a route for world
trade. As much as 90% of world trade routes are
transported by sea, 40% of this trade passes through
Indonesia. Indonesia has an opportunity to become a
World Maritime Axis Country by improving an
integrated marine transportation system.
Traditionally, the process of tracking vessels at sea
is using radar. However, with the development of
technology, currently, there is a satellite-based
Automatic Identification System (AIS) to monitor
the activities and movements of ships passing in sea
waters.
AIS data provides much information, including
ship identity, passage time, latitude-longitude, type,
speed, course over ground, etc. Predicting the status
of vessel motion, patterns, and ship anomaly status
can use that type of data (Gustisatya, 2017). The
result is essential to maintain the security of
interactions between ships and ship traffic in sea
waters.
Several data mining approaches have been
applied to AIS data to analyze ship movements used
the Association rules and Markov model to inform
the motion patterns of ships in Chinese waters
(Deng, et al., 2014). The Markov model became the
solution for the continuous transaction. In 2011,
Mascaro detected anomalous motion of ships
passing through Sydney waters using the Bayesian
Network method (Mascaro, et al., 2013).
Furthermore, the visualization and interaction of
anomalous status on ships in Sweden using the
combined Gaussian Mixture Model and Kernel
Density Estimation and Clustering based on the
ship's trajectory (Riveiro and Falkman, 2014). Zhu F
applies Agrawal’s association rule in mining ship
trajectory patterns (Agrawal, et al., 1993).
In this study, we analyse the vessel movements
using the association rules method based on the
frequency. This work aims to determine an
appropriate pattern of vessel motions. The result
sustains and simplify to control, monitor, and predict
the vessel's activities. The paper is structured as
follows. In the first section, the background and
descriptions of several studies were appropriate. The
second section explained the analytical methods
used in the study, followed by the research
methodology covering the data sources and pre-
processing. In the third section, data analysis
consists of ship data characteristics and ship motion
patterns using association rules. The last section is
the conclusion of the research.
Santoso, N., Wibowo, W. and Azizah, N.
Analysis of Vessel Movements using Association Rules.
DOI: 10.5220/0010797800003317
In Proceedings of the 2nd International Conference on Science, Technology, and Environment (ICoSTE 2020) - Green Technology and Science to Face a New Century, pages 125-130
ISBN: 978-989-758-545-6
Copyright
c
2022 by SCITEPRESS – Science and Technology Publications, Lda. All rights reserved
125
2 RESEARCH METHODS
Data mining is the exploration and analysis of a set
of data to find essential patterns and rules (Margaret,
2003). There are several data mining techniques,
including classification, clustering, and association
rules, where each technique has a different function.
The following section will describe the theory of the
association rules.
2.1 Association Rules
Association rules are techniques of data mining to
find patterns of the combination of an item. The
function of the association rule is to find shared
value items that often appear together in a database.
Several references mention association rule with
market basket analysis based on a priori algorithm
which has the principle "if an itemset is frequent
appears, then all subsets of the itemset are also
frequent appear". This principle refers to the nature
of the support measure, which means that the
support of an item set is less than its data subsets
support.
The importance of a rule is determined
according to two parameters: support (the
percentage of the item combination) and confidence
(the strength of the relationship between items).
Association analysis has defined a process for
finding all associative rules that meet the minimum
requirements for support score and minimum
requirements for confidence score [8]. The function
to determine the support value of one item as
follows:
𝑠𝑢𝑝𝑝𝑜𝑟𝑡
𝐴
𝑛𝑢𝑚𝑏𝑒𝑟 𝑜𝑓 𝑖𝑡𝑒𝑚 𝐴
𝑛𝑢𝑚𝑏𝑒𝑟 𝑜𝑓 𝑎𝑙𝑙 𝑖𝑡𝑒𝑚
(1)
Equation (1) shows that item A's support is
determined by dividing the number of item A that
occurs with all items. Meanwhile, the support of
items A and B (two items) is calculated by equation
(2) as follows:
𝑠𝑢𝑝𝑝𝑜𝑟𝑡
𝐴, 𝐵
𝑛𝑢𝑚𝑏𝑒𝑟 𝑜𝑓 𝑖𝑡𝑒𝑚 𝐴 𝑎𝑛𝑑 𝐵
𝑛𝑢𝑚𝑏𝑒𝑟 𝑜𝑓 𝑎𝑙𝑙 𝑖𝑡𝑒𝑚
𝑃
𝐴∪𝐵
(2)
The next step after finding all high-frequency
patterns is searching the rule which meets the
minimum of confidence. The confidence score is a
measure of the rule’s accuracy. The highest
confidence, the most substantial relationship
between items in the association rules. Formulas to
calculate the confidence score of two items are as
follows:
𝑐𝑜𝑛𝑓𝑖𝑑𝑒𝑛𝑐𝑒
𝐴→𝐵
𝑠𝑢𝑝𝑝𝑜𝑟𝑡
𝐴∪𝐵
𝑠𝑢𝑝𝑝𝑜𝑟𝑡
𝐴
𝑃𝐴 ∪ 𝐵
𝑃𝐴
(3)
𝐿𝑖𝑓𝑡
𝐴→𝐵
𝑐𝑜𝑛𝑓𝑖𝑑𝑒𝑛𝑐𝑒
𝐴→𝐵
𝑠𝑢𝑝𝑝𝑜𝑟𝑡
𝐵
𝑃𝐴 ∪ 𝐵
𝑃
𝐴
𝑃𝐵
(4)
Furthermore, a priori algorithm also uses score
lift as a parameter. Lift is a ratio number that shows
how many times it is possible to find an attribute
that occurs with other attributes compared to all
occurrences of the whole attribute. The value
obtained from the lift score shows the strength or
failure of the resulting rules, also supported by the
value of the support and confidence generated
(Melita, et al., 2013). The function to determine the
lift score is written in equation (Riveiro and
Falkman, 2011).
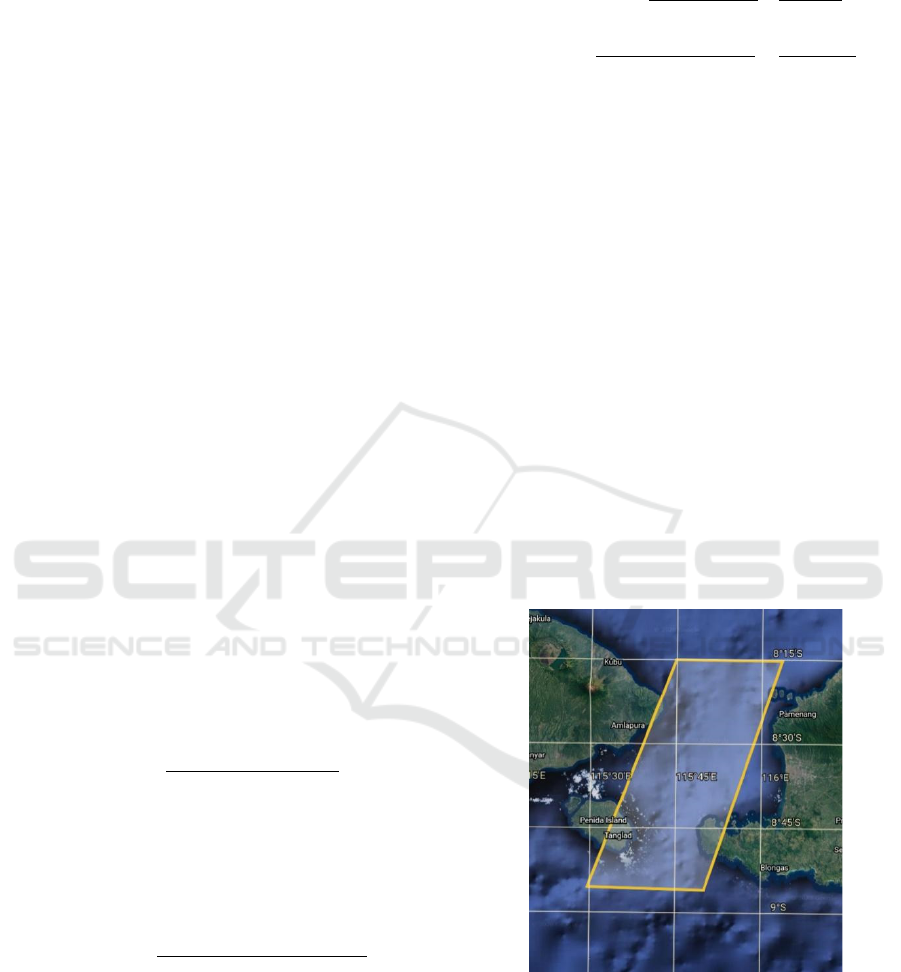
2.2 Dataset
The study uses a limited area and period of AIS
dataset. The selected AIS data from 1
st
October 2018
to 31
st
December 2018, which distributed from
latitude S 7,14° to S 8,55° and longitude E 115,29°
to E 116,03° as visualized in Figure 1. There are
over ten thousand records in the raw dataset.
Therefore, we do pre-process covering data cleaning
and data transforming.
Figure 1. Coordinate point selected area
2.3 Methodology
In the data cleaning process, first, we delete data
without MMSI, position, time, course over ground,
speed and ship type. Second, fill the ship type with
the same MMSI. Third, removing multiple data
(exact time and location) and finally removing
ICoSTE 2020 - the International Conference on Science, Technology, and Environment (ICoSTE)
126
unused attributes in the analysis. Table 1 present
the attributes used in this study.
Table 1. Attributes of research
Attribute Definition Data
t
yp
e
MSI Maritime Mobile
Service Identify
Integer
Latitude Latitude ship position Numeric
Longitude Longitude ship position Numeric
Speed Speed of ship (km/hr) Numeric
Course
over
g
roun
d
course over ground of
shi
p
Numeric
Type Type of ship (cargo,
p
assenger, thanker)
Text
The last pre-processing is data transformation.
We perform a transformation on the attributes of the
ship speed and course over the ground. Based on the
AIS dynamic information standard (Deng, et al.,
2014), we categorized the speeds into five, which
are presented in Table 2. The "Exceptions" speed
category is anomalous data. Usually, the recorded
data is due to recording errors. In this study, we did
not find a ship with more than 99 km/hr speed.
Additionally, based on information from the data
and the weather in the water area, we define the
course over ground attribute into eight categories.
The interval for each category is 45° as written in
Table 3. After pre-processing the data, about 60% of
the data remains for further analysis.
Table 2. Discrete of speed
Range of speed (km/hr) Category
0 – 3 Slow
3 – 14 Medium
14 – 23 High
23 – 99 Very high
over 99 Exception
Table 3. Discrete of course over ground
Interval Cate
g
or
y
360° - 45° North
45° - 90° North East
90° - 135° East
135° - 180° South East
180° - 225° South
Interval Cate
g
or
y
225° - 270° South West
270° - 315° West
315° - 360° North West
3 RESULTS AND DISCUSSION
In this section, the results describe into two
subsections, namely descriptive statistics and
association rules analysis.
3.1 Statistics
The characteristics of the AIS data analyzed include
speed, type, and the distribution of the ship's course
over ground from the clean data obtained in the pre-
processing. The results of the analysis are presented
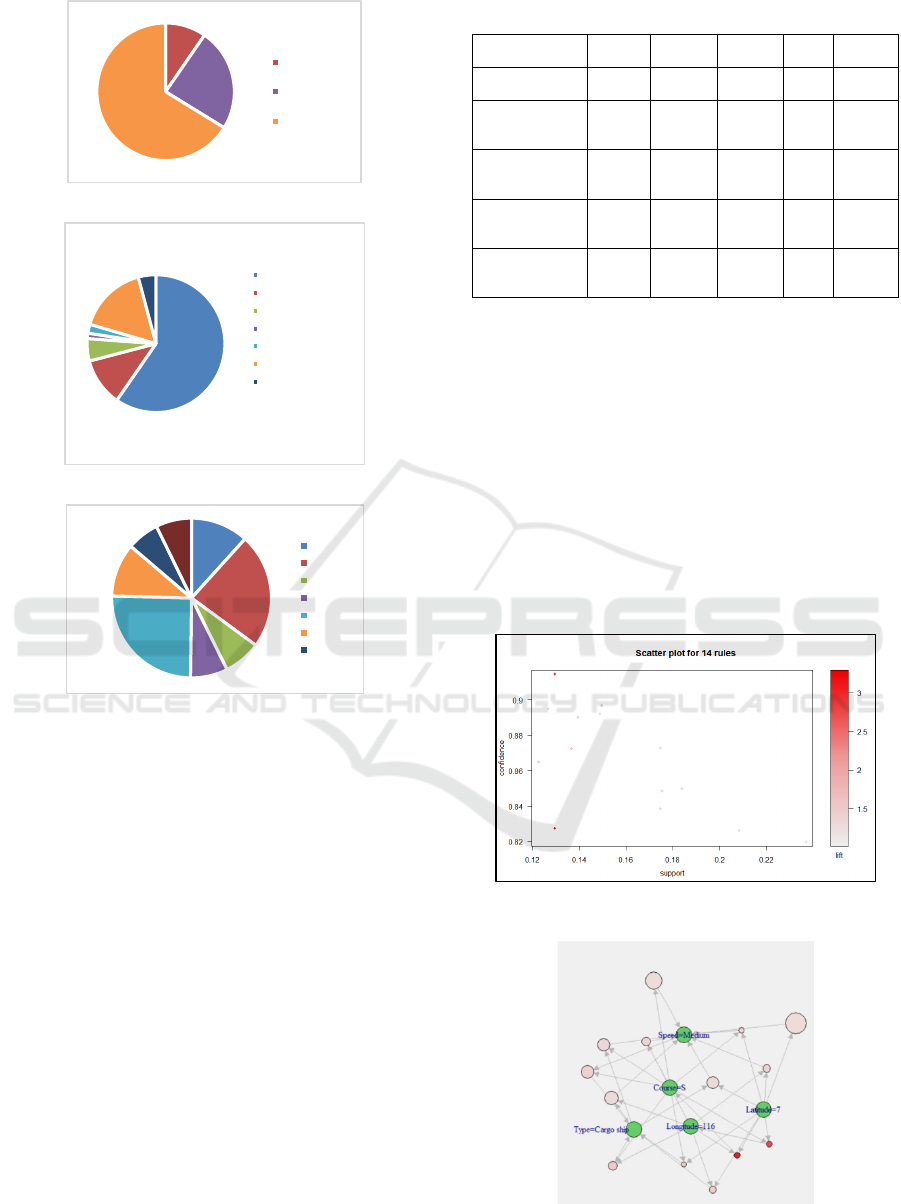
in Figure 3.
Based on Figure 3, ships with medium speed and
cargo ships have the most significant proportion. We
know that the area used in this study is around the
Lombok Strait, which is a busy trade route with a
high level of ship traffic density. So that the speed
"Medium" - "Low" is the recommended condition to
avoid ship accidents.
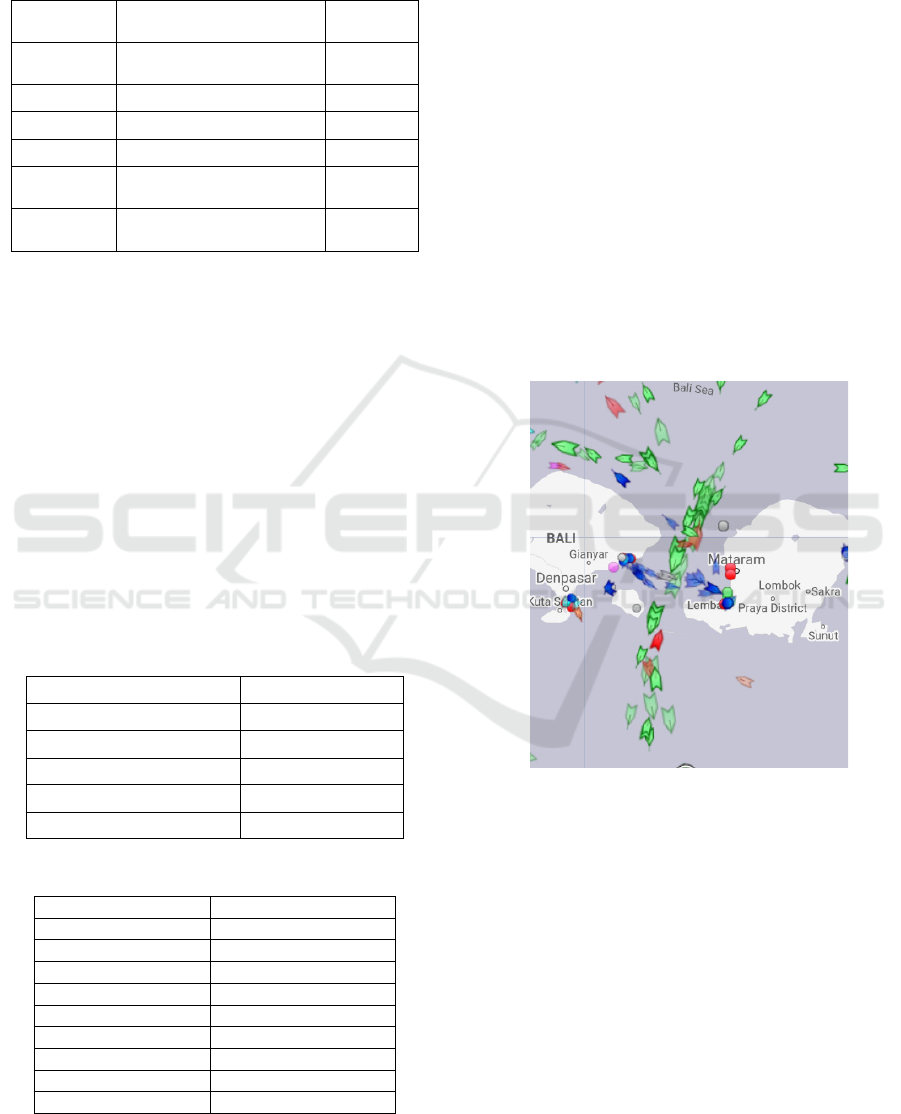
Figure 2. Traffic in the Lombok Strait
Besides, the distribution of the course over the
ship's ground shows relatively balanced data. There
are 25% of ships toward the South, 23% of ships
move towards the North, and the rest spread in other
directions according to their destination. Visually,
the marine traffic around the Lombok Strait can be
seen in Figure 2. In this figure, the green-coloured
ships, namely the type of cargo, dominate the water
traffic in the Lombok Strait. Either across the island
of Lombok - Bali, as well as to other islands.
Analysis of Vessel Movements using Association Rules
127
(a)
(b)
(c)
Figure 3. statistics of data based on (a) speed, (b) type, and
(c) course over ground
3.2 Association Rules Analysis
This study analyses vessel movement data using
association rules that use a priori algorithm method
based on the lift value. Lift is a ratio number that
shows how many times it is possible to find an
attribute with other attributes. Rules formation is
obtained based on item appearance. In this study, the
items in question are the course attributes over the
ground, speed and type of ship. We set two schemes
to compare the performance. The result of each
scheme is described as follows.
3.2.1 Scheme 1
Scheme 1 builds rules with a priori algorithm with
the provisions of the parameter max length = 3,
support = 0.1 and confidence = 0.8. The results are
14 rules. Here are five rules based on the highest lift.
Table 4. The highest five rules of scheme 1
lhs RHS support
confi
dence
lift count
{Latitude=7,
Lon
g
itude=116
}
{Cours
e=S
}
0.1296 0.8275 3.281 331
{Latitude=7,
Course=S}
{Longit
ude=11
6
}
0.1296 0.9143 2.937 331
{Longitude=116,
Course=S}
{Type=
Cargo
ship}
0.1495 0.8967 1.504 382
{Latitude=7,
Longitude=116}
{Type=
Cargo
shi
p}
0.1366 0.8725 1.464 349
{Latitude=7,
Course=S
{Type=
Cargo
shi
p}
0.1225 0.8646 1.450 313
Based on Table 4, it can be explained in the first
rule that if the ship's coordinate point is at Latitude =
7 and Longitude = 116, then the course over ground
is South or the ship is from the South direction.
These rules have a lift score of 3.281 with 82.75%
confidence, 0.1296 support, and the number of
activities with the same item is 331 ships. At the
value of lift 1.45, the rules are if Latitude = 7 and
Course = South, then the type of ship is cargo. The
level of confidence for these rules is 86.46%,
followed by support at 0.1225. Visually, the
distribution of parameter values in all rules can be
seen in Figure 4.
Figure 4. Scatter plot of the parameter by scheme 1
Figure 5. Rules pattern by scheme 1
10%
24%
66%
High
Low
Medium
60%
11%
5%
1
2%
17%
4%
Cargo ship
Other type
Passenger ship
Pleasure Craft
Sailing vessel
Tanker
Tug
12%
23%
8%
8%
25%
11%
6%
7%
E
N
NE
NW
S
SE
SW
ICoSTE 2020 - the International Conference on Science, Technology, and Environment (ICoSTE)
128
Based on Figure 4, the rules with high
confidence have a high lift value (the colour is
getting brighter), but the support value is relatively
small. Conversely, rules with a higher support value
lower the lift value (the colour fades), with a
confidence value ranging from 80% to 90%. The
visualization of patterns between items that often
appear is shown in Figure 5, which can be explained
that items Speed = Medium and Type = Cargo Ship
are items that become result (RHS) indicated by the
direction of the arrow leading to the item.
Meanwhile, the items Course=South, Latitude=7,
and Longitude=116 are required (lhs) indicated by
the direction of the arrow that comes out of the item.
The green colour shows the main item, the red
colour shows the high lift value, and the large circle
size shows a high confidence value.
3.2.2 Scheme 2
Scheme 2 builds rules with a priori algorithm with
the provisions of the parameter max length = 4,
support = 0.1 and confidence = 0.8. The results are
26 rules. Here are five rules based on the highest lift.
Table 5. The highest five rules of scheme 2
lhs rhs support confidence lift count
{Latitude=7,
Longitude=116,
Type=Cargo
ship}
{Course=S} 0.1194 0.8739 3.465 305
{Latitude=7,
Longitude=116,
Speed=Medium}
{Course=S} 0.1170 0.8398 3.330 299
{Latitude=7,
Longitude=116}
{Course=S} 0.1296 0.8275 3.281 331
{Latitude=7,
Course=S,
Type=Cargo
ship}
{Longitude=116} 0.1194 0.9744 3.130 305
{Latitude=7,
Course=S,
Speed=Medium}
{Longitude=116} 0.1170 0.9228 2.964 299
Based on Table 5, it can be explained in the first
rule that if the ship's coordinate point is at Latitude =
7 and Longitude = 116, the type = cargo ship, then
the course over ground is South. These rules have a
lift score of 3.465 with 87.39% confidence, 0.1194
support, and the number of activities with the same
item is 305 ships. Visually, the distribution of
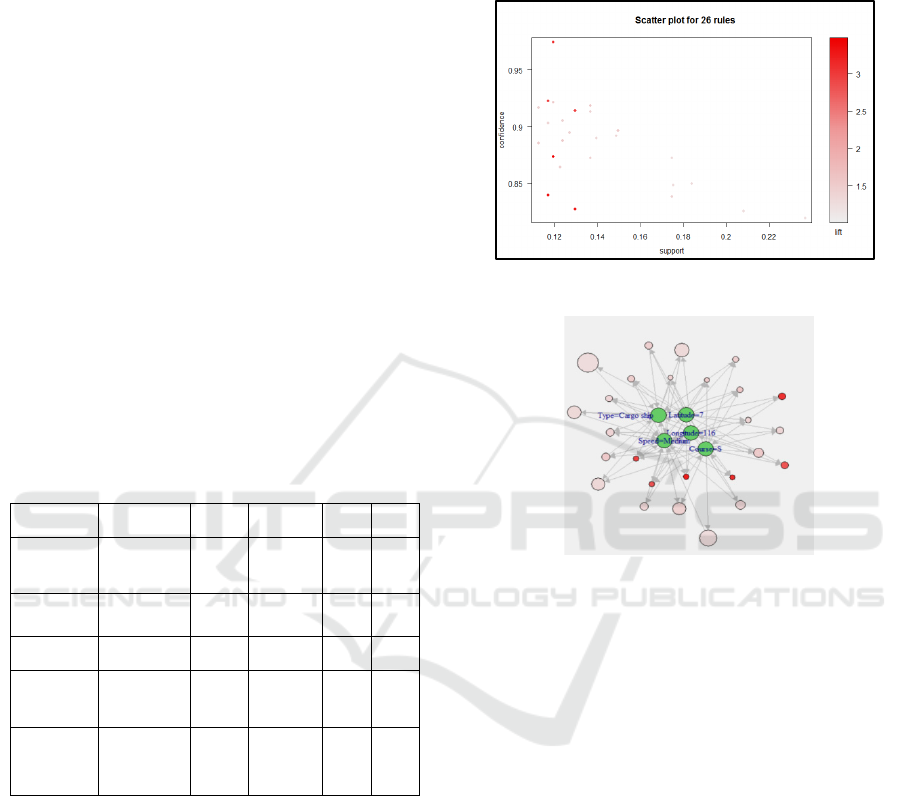
parameter values in all rules can be seen in Figure 6.
Based on Figure 6, the lift value is inversely
proportional to support. Rules with a high lift value
(bright red colour) followed by a support value of
0.12 - 0.13.
On the contrary, the higher the support value, the
smaller the lift value (pink colour). Likewise, the
value of confidence is inversely related to support. It
is known that the rules with the highest confidence
(98%) have a high lift, but the support value is
relatively low compared to other rules.
Figure 6. Scatter plot of the parameter by scheme 2
Figure 7. Rules pattern by scheme 2
The pattern rules for scheme two are presented in
Figure 7. The image is more complicated than in
scheme one because more arrows indicate the
combination of items set for a maximum of 4. There
are six red circles which mean the rules with the
highest lift. Besides that, there are rules with the
highest confidence (the most extensive circle size)
with Latitude = 7, then Speed = Medium.
4 CONCLUSION
The association rules are successful in analysing the
vessel movements. The pattern based on the
frequency of item which occurs together show the
prediction of the next to ship characteristics. The
outstanding lift score is obtained by maximum
length of item = 4, support = 0.1994, confidence =
87.39%. The rule state is if latitude = 7, longitude =
116, type = cargo ship, then course over ground =
South. The result is appropriate to detect the pattern
of vessel motion. It will simplify the officers to
monitor and control traffic lines in Lombok Strait.
Analysis of Vessel Movements using Association Rules
129

Furthermore, it useful for an early warning system to
prevent the accident in the sea trade route.
ACKNOWLEDGEMENTS
The author would like to thank AISITS Surabaya for
providing data sets, and Grant supported this work
for the Department of Business Statistics 2020 ITS
Surabaya.
REFERENCES
Agrawal R, Imielinski T, and Swami A 1993 Mining
association rules between sets of items in large
databases ser. ACM SIGMOD International
Conference on Management of Data 207–216.
Deng F, Guo S, Deng Y, Chu H, Zhu Q and Sun F 2014
Vessel track information mining using AIS data
International Conference on Multisensor Fusion and
Information Integration for Intelligent Systems (MFI)
1-6.
Feixiang Z 2011 Mining ship spatial trajectory patterns
from AIS database
for maritime surveillance ser. Proceedings of 2nd Intl.
conference on Emergency Management and
Management Science 772–775.
Gustisatya P 2017 Determining Anomaly Activities of
Ships Based on Data Analysis from AIS Final Project
(ITS).
Harahap M, Husein A M, Aisyah S, Lubis F R, Wijaya B
A 2018 Mining association rule based on the diseases
population for recommendation of medicine need IOP
Conf. Series: Journal of Physics: Conf. Series 1007.
Mascaro S, A. E. Nicholson A E, Korb K 2013 Anomaly
detection in vessel tracks using bayesian networks
International Journal of Approximate Reasoning.
Margaret H D 2003 Data Mining: Introductory and
Advanced Topics Prentice Hall.
Melita H, Marie O, Hilaire S T, Sean W and Elisa S 2013
Maritime Traffic Data Mining Using R 16th
International Conference on Information (FUSION)
Turkey.
Riveiro M and Falkman G 2011 The role of visualization
and interaction in maritime anomaly detection
IS&T/SPIE Electronic Imaging. International Society
for Optics and Photonics 78680M-78680M-12.
ICoSTE 2020 - the International Conference on Science, Technology, and Environment (ICoSTE)
130
