
Soil Deformation Monitoring System using
Soil Vibration and Moisture Sensors
Yakobus Yulianto Kevin, Erwin Susanto and Husneni Mukhtar
Telkom University, Jl. Telekomunikasi Terusan Buah Batu, Bandung, Indonesia
Keywords: Landslide Monitoring System, Geophone Sensor, Soil Moisture Sensor, Zigbee
Abstract: Landslides are natural disasters that often occur in Indonesia. In 2018 474 landslides in Indonesia resulted in
many fatalities and many damaged buildings. To minimize losses caused by landslides, a tool for monitoring
the soil condition is needed. In this research, sensors of soil vibration and soil moisture were utilized to
develop a monitoring system of soil deformation that was able to perform continuously in real-time. For the
data transfer, the Zigbee module, as wireless data communication, sent the acquired data from both sensors
to Antares as an IoT platform via node-MCU ESP8266. The monitoring simulation of the soil deformation
was carried out on a plant prototype placed indoors by embedding a spring on all four corners or feet of the
plant prototype. Results of this monitoring system were displaying the vibration and moisture data of soil
condition is continuous and real-time. The vibration data from the geophone sensor with 99.97% of sensor
accuracy were sent to the IoT platform and displayed on the monitor. While the moisture sensor (soil moisture
v1.2) with 99.71% of average accuracy. The communication system sending data from the sensor to Antares
produces an average delay of 2.3 seconds.
1 INTRODUCTION
Indonesia is one of the countries prone to natural
disasters globally because it has a geographical
condition that consists mainly of mountains, hills,
valleys, and vast seas. One of the natural disasters that
often occurs in Indonesia is landslides. A landslide is
a geological event that occurs due to rock or soil mass
movement with various types and types, such as
falling rocks or large lumps of soil. According to the
National Disaster Management Agency (BNBP) in
Indonesia, in 2018, 474 landslide incidents in
Indonesia resulted in many fatalities and many
damaged buildings. Landslides usually occur in
mountainous areas, hills, steep slopes, or cliffs. The
cause of landslides is high rainfall, deforested forests,
not dense soil and small vibrations caused by vehicle
traffic around the hillsides. Due to the frequent
occurrence of landslides, we need a monitoring
system of ground movement in a particular area. This
system is that it can monitor the condition of ground
movement continuously in real-time.
Some previous research reports on landslide
warning system can be found, for example, is the
Landslide Warning System on the Railroad Track
(Hartalita, et al., 2018). This study used an
accelerometer sensor ADXL345 with the advantage
of detecting the tilt and converting it to angular
degrees with a sensor accuracy of 96.45%. The
drawback of this sensor is that it cannot follow fast
movements due to its slow response. The other report
uses light sensors, i.e., light-dependent resistor
(LDR), to detect landslide events (Sudibyo,
Herawadi, 2015). The advantage of this sensor is that
it can read ground motion by utilizing light. The
drawback is that the error value obtained from the
measurement is about 5%.
Landslide detection using ultrasonic and infrared
with short message service (SMS) notification was
reported in (Widhiantoro and Purwarupa, 2015). The
advantage of the infrared sensor is that it can detect
the existence of moving objects such as humans and
animals and soil movements. In contrast, the
ultrasonic sensor can be used to detect their
movements. The disadvantage is that if the ground
movement is less than 2 cm, the sensor cannot read
the variations accurately. In this paper, we use a
vibration sensor and humidity sensor to monitor
ground motion. Then the data is processed and
displayed as information on the condition of soil
movement.
Kevin, Y., Susanto, E. and Mukhtar, H.
Soil Deformation Monitoring System using Soil Vibration and Moisture Sensors.
DOI: 10.5220/0010797100003317
In Proceedings of the 2nd International Conference on Science, Technology, and Environment (ICoSTE 2020) - Green Technology and Science to Face a New Century, pages 117-124
ISBN: 978-989-758-545-6
Copyright
c
2022 by SCITEPRESS – Science and Technology Publications, Lda. All rights reserved
117
2 RESULTS AND DISCUSSION
2.1 Basic Theory
2.1.1 Geophone Sensor
A geophone principle work is the conversion of
ground motion (displacement) into voltage. Zan et al.
deployed a geophone to sense the landslide early
warning system (Zan, et al., 2002). Many types of
vibration signals induced by traffic, train movement
or regular tapping can be sensed by a geophone
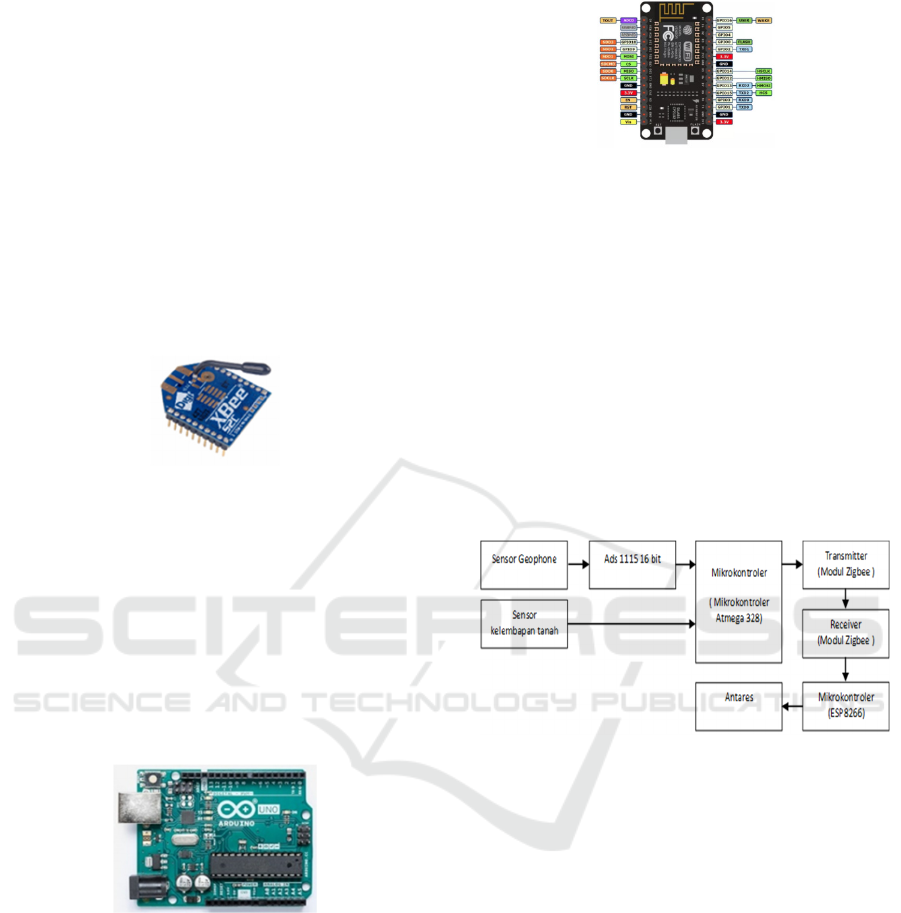
(Kunnath, et al., 2010). Geophone has two main
components, namely permanent magnets and wire
windings, shown in Figure 2.1.
Figure 2.1. Main Components of Geophones
Geophone works based on Faraday's law, where
the magnetic flux variations cause the electric current
flow in a coil in varied times. The magnitude of the
stress on a geophone that occurs is directly
proportional to the flux changes concerning time.
Faraday's Law can be stated by the formula below:
𝜀𝑁ΔΦ/Δ𝑡 (1)
where
ε = induced GGL (volts),
N = Number of coil windings
ΔΦ = Change in magnetic flux (weber)
Δt = time-lapse (s)
The negative sign indicates the direction of the
induced electromotive force (emf).
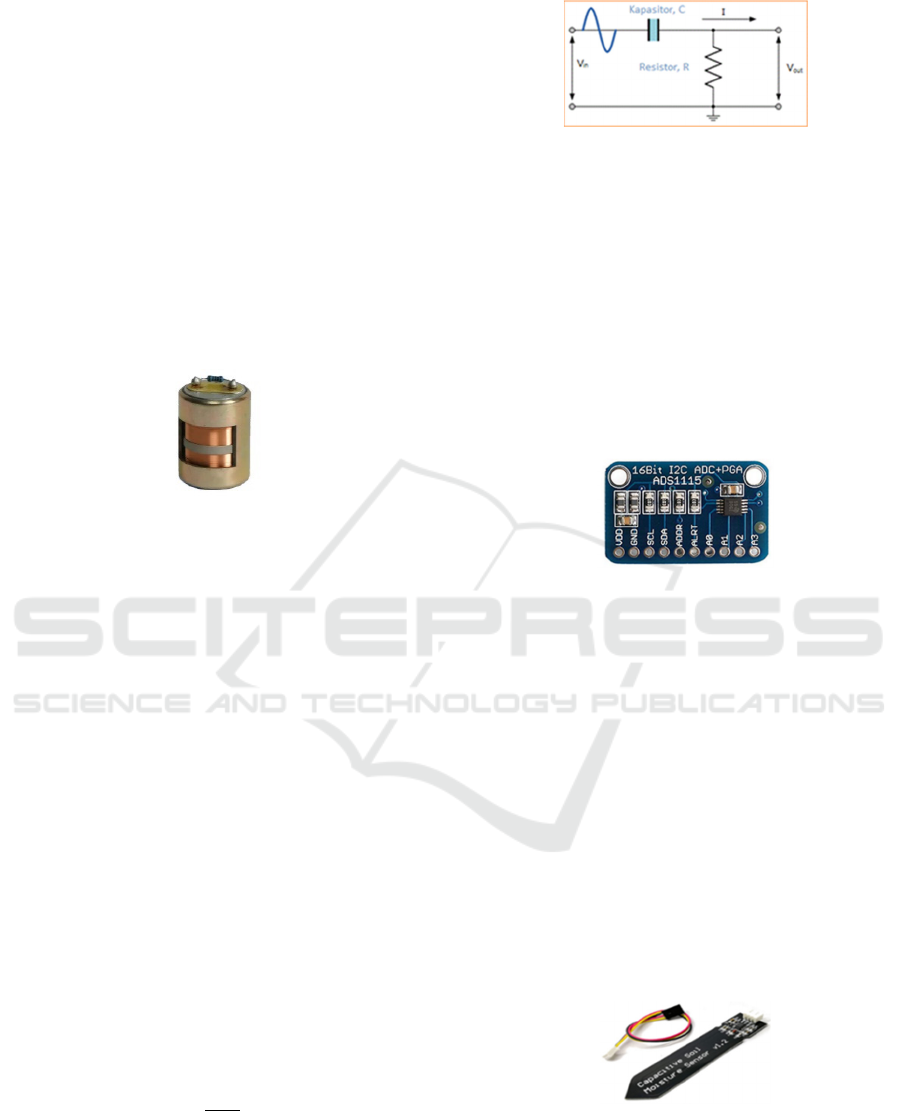
2.1.2 High Pass Filter
High Pass Filter (HPF) is a filter or frequency filter
that can pass high-frequency signals and inhibit or
block low-frequency signals or frequencies under
cut-off frequencies. To determine the value of the
cut-off frequency, it can be calculated using the
formula:
𝑓
(2)
where:
𝑓
= Cut off frequency in units of Hz
π = 3.14
𝑅 = Resistance in Ohms (Ω)
𝐶 = Capacitance in Farad (F)
Figure 2.2. High Pass Filter Circuit
2.1.3 ADS1115 Module
ADS1115 module is a type of ADC with a 16-bit
resolution with a high level of conversion accuracy
compared to the 10-bit ADC. In this ADC, four
channels can convert values for four sensors
simultaneously with bipolar or single differentials.
The received data will be transferred or sent via I2C
serial communication. The series consists of SDA and
SCL. The next Figure 2.3 shows the ADS1115
module.
Figure 2.3. ADS1115 Module
2.1.4 Soil Moisture Sensor
A soil moisture sensor is a sensor that can detect
moisture in the soil. This sensor consists of two parts,
namely the probe and the comparator. In the
comparator part, there is an IC TLC555I that serves
as a voltage comparator. At the same time, the probe
has a function to pass current through the ground and
read the resistance proportional to the value of the
humidity level. Measurement of soil moisture can be
done by the relations of mass of water MA, the mass
of wet soil MTB, the mass of dry soil MTK and soil
moisture KT (Stevanus and Setiadi, 2013):
𝑀𝐴 𝑀𝑇𝐵 𝑀𝑇𝐾 (3)
𝐾𝑇 𝑀𝐴/𝑀𝑇𝐵 100% (4)
Figure 2.4. Soil Moisture Sensor
Many usages of soil moisture sensors can be
found in real applications such as to monitor sports
turf humidity, especially for a golf game, to reveal
ICoSTE 2020 - the International Conference on Science, Technology, and Environment (ICoSTE)
118
ancient irrigation practices in waterless environment,
etc.
People monitor soil moisture for many beneficial
for environmental researchers and practitioners like
farmers, golf course superintendents, archaeologists,
and regulators (Kumar, et al., 2016).
2.1.5 Zigbee
RF transceiver modules are set in Digi XBee S2C to
provide wireless connectivity using the Zigbee
protocol. The configuration consists of XCTU for the
connection of coordinator and router using AT
commands and MAC addresses. The coverage of the
connection is 60 m indoor and 1200 m outdoor.
Figure 2.5. Zigbee
2.1.6 Arduino Uno
We use Atmega328 Arduino microcontrollers with an
open-source physical computing platform. It contains
20 I/O pins, 14 digital and six analogue pins, a 16
MHz crystal oscillator, a Universal Serial Bus (USB)
connection, a power jack, an ICSP header and a reset
button as shown in Figure 2.6. To embed programs in
Arduino boards, USB-to-serial adapter chips such as
the FTDI FT232 can be employed.
Figure 2.6. Arduino Uno
2.1.7 Node MCU ESP 8266
NodeMCU ESP8266 is an embedded microcontroller
system equipped with Wi-Fi intact. Therefore, it does
not need to use additional Wi-Fi devices. The system
architecture is on the chip (SoC) and has a function
for communicating GPIO by connecting and
transmitting data through the Internet. Figure 2.7
shows the I / O pins of NodeMCU (Shkurti, 2017).
Figure 2.7. NodeMCU ESP 8266
The standard Lua Programming firmware script
was often used to simplify programming, and it
usually needs the existing library in the Arduino IDE
software. This software is open and can be
downloaded and run well in the operating system
(Prayogo and Suryo, 2016).
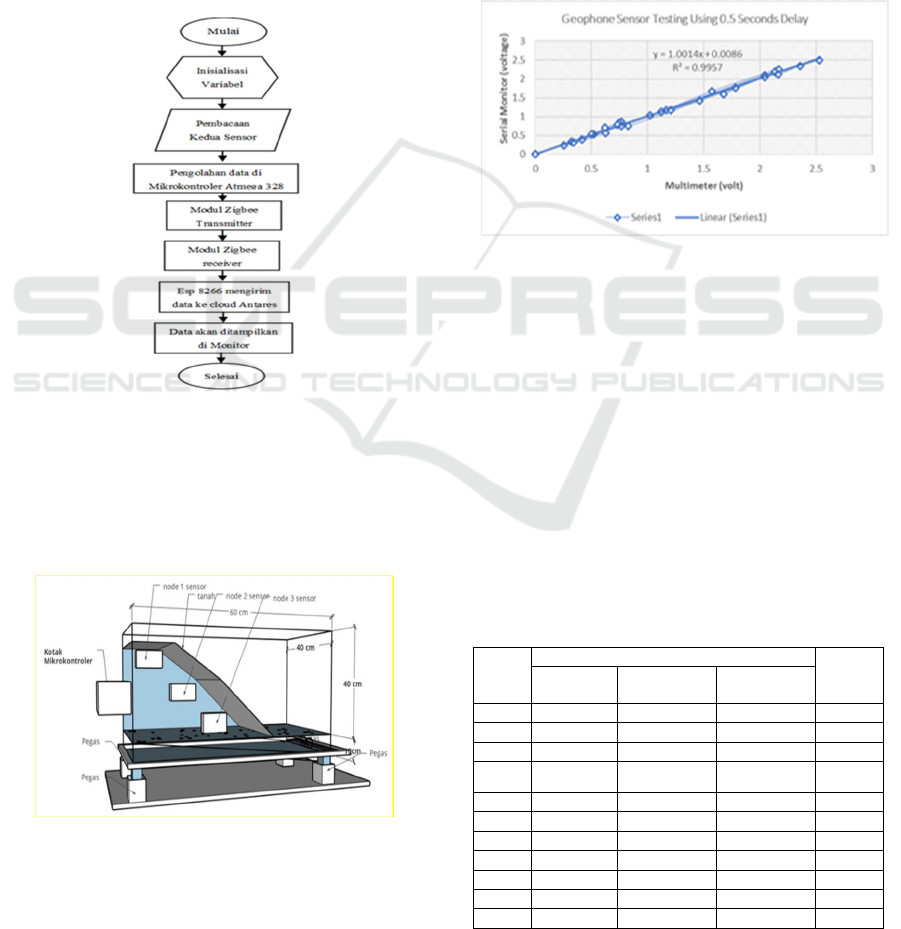
2.2 System Design
2.2.1 Hardware Design
A block diagram of a deformation monitoring system
of ground motion using a geophone sensor and a soil
moisture sensor is shown in Figure 3.1.
Figure 3.1. Block Diagram
To monitor the ground motion deformation using
a geophone sensor and a soil moisture sensor is to
conduct a two-season trial, namely the dry and rainy
seasons. During the dry season, the signal level
generated from the soil moisture sensor does not
experience any significant changes because the
humidity in the soil tends to be more stable.
Meanwhile, soil conditions tend to be wet during the
rainy season to increase the humidity sensor output
measurement. Unlike the soil moisture sensor, the
level generated by the ground vibration sensor tends
not to be affected by seasonal changes. The geophone
sensor will display a significant change only when
getting vibration.
2.2.2 Software Design
Figure 3.2 shows a flowchart that illustrates the
algorithm of a soil deformation monitoring system
using a geophone sensor and a soil moisture sensor.
Soil Deformation Monitoring System using Soil Vibration and Moisture Sensors
119
The first step that must be done is to initialize the
geophone sensor input and the soil moisture sensor.
Inputs generated by geophone sensors and soil
moisture sensors are analogue signals which the ADC
port will then process on the microcontroller to
convert the analogue voltage to digital voltage. After
that, the Atmega 328 microcontroller will read the
input provided by the sensor. The output signal from
the Atmega 328 Microcontroller will be forwarded to
the transmitter part of the Zigbee module to be sent to
the receiver part of the Zigbee module. The signal
data that the receiver has received will be forwarded
to the Antares using nodeMCU ESP8266 to be
displayed in graphical form.
Figure 3.2. Software Design Flow Chart
2.2.3 Mechanical Design
In Figure 3.4, we can see that mechanical design aims
to provide a general picture of the equipment to be
tested.
Figure 3.3. Mechanical Design
The material used to make the simulation box is
transparent acrylic. The size of the simulation box is
60 cm long, 40 cm wide and 40 cm high. The box was
filled with land that is set close to the actual situation.
Soil moisture sensor is installed in separated 3 sensor
modules while geophone sensors are installed in two
places, namely sensor module 1 and sensor module 3.
Each sensor module is installed with a distance of 5
cm.
2.3 Test and Analysis Results
2.3.1 Testing the Geophone Sensor
Figure 4.1. Linear Regression Chart Using a 0.5 Seconds
Delay
Based on geophone sensor testing in Figure 4.1, 30
data were taken in the testing mechanism at 0.5-
second intervals. The minimum output voltage is 0
volts for less vibration. In contrast, in the under-
vibration state, the maximum voltage of the
multimeter is 2,528 volts, and it equals 2.5 volts on
the serial monitor display. Based on Figure 4.1, the
formula of linear regression can be obtained using an
interval of 0.5:
y=1,0014x+00,086
2.3.2 Moisture Sensor Testing
Table 4.1. Soil Moisture Sensor Testing
Trial
to
Soil Moisture Value (%) Refe
rence
Value
Sensor 1 Sensor 2 Sensor 3
1 100 99.71 99.69 100
2 100 99.42 99.38 100
3 100 99.71 99.38 100
4 100 99.71 99.07 100
5 100 100 99.38 100
6 100 99.71 99.38 100
7 100 100 99.38 100
8 100 100 99.38 100
9 100 99.71 99.38 100
10 100 100 99.07 100
Avg 100 99.797 99.349 100
ICoSTE 2020 - the International Conference on Science, Technology, and Environment (ICoSTE)
120
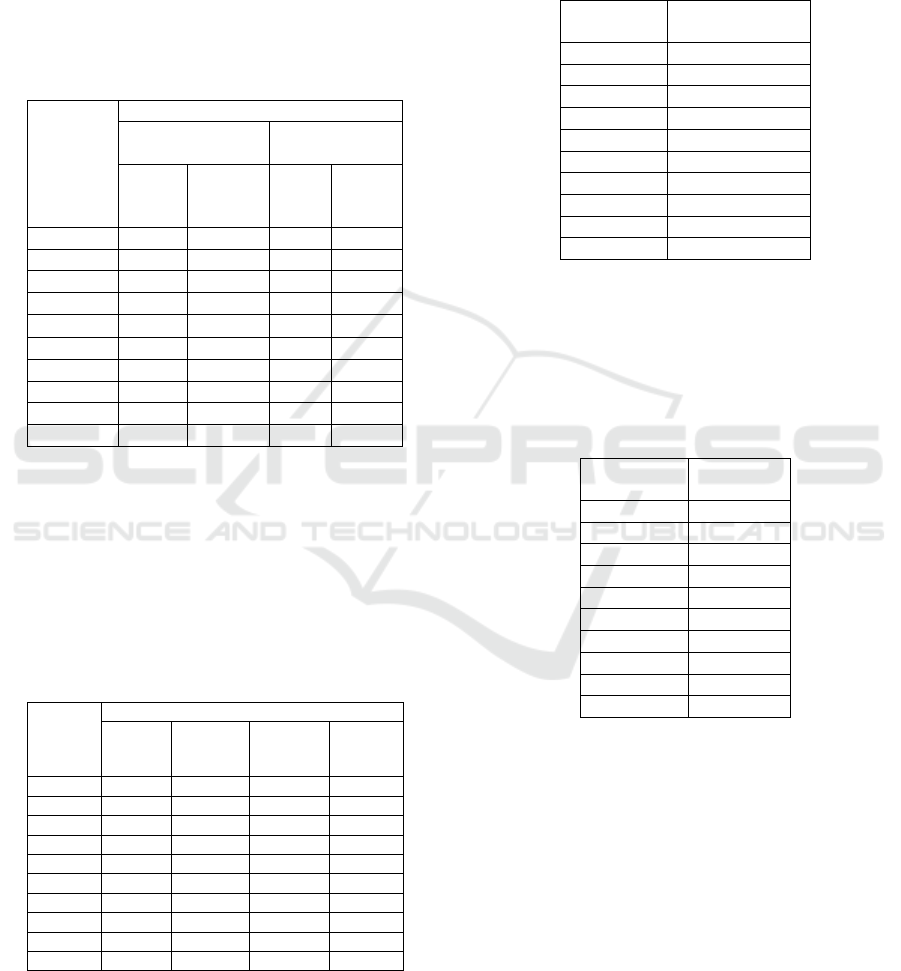
From the experiment results in Table 4.1, the
mean of sensor measurements is 100% (sensor 1),
99.80% (sensor 2) and 99.35% (sensor 3).
2.3.3 Zigbee Testing
- Delay Testing
The following is the experiment result of delay testing
of Zigbee in tabular form.
Table 4.2. Zigbee Test Results
Data
delivery
interval
(seconds)
Average Delay (seconds)
Horizontal Testin
g
Vertical
Testin
g
Indoor
3.5 m
Outdoor
10 m
H
eight o
f
3,5
m
Height
of 7 m
1 1,258 3,175 3,985 2,868
2 1,120 1,677 2,839 3,281
3 0,993 1,861 2,014 3,682
4 1,102 1,423 1,577 2,721
5 1,531 1,816 1,918 2,290
10 0,992 1,692 0,517 0,693
15 1,029 1,944 0,514 0,947
20 0,992 2,252 0,503 0,761
25 1 2,268 0,544 1,008
30 0,994 1,754 0,508 1,029
From the data testing results, it can be concluded
that the value at intervals of 1,2,3,4 and 5 seconds
delay is greater than the interval values of 10, 15, 20,
25 and 30 seconds. Moreover, at the 10-second
interval, the resulting data is better than other
intervals.
- Testing Data Loss
Table 4.3. Zigbee Data Loss Testing Results
Data
delivery
interval
(sec)
Average Data Loss (%)
Indoor
3.5 m
Outdoor
10 m
Height
of 3,5 m
Height
of 7 m
1 0 7,196 38,557 0
2 0 1,685 16,176 5,747
3 0 1,667 5,217 38,970
4 0 0 0 10,416
5 0 18,072 40,740 0
10 0 0 0 0
15 0 21,67 0 6,67
20 0 10 0 0
25 0 11,67 0 5
30 0 5 0 15
Based on tests conducted, it can conclude that the
4s interval is suitable because it has the slightest delay
compared to other intervals.
2.3.4 Testing Data Transmission to the
Cloud
- Delay Testing
Table 4.4 Testing Delay from NodeMCU ESP8266 to
Antares
Interval
(seconds)
Average delay
(ms)
1 598
2 329
3 513
4 317
5 407
6 405
7 473
8 475
9 458
10 465
Based on tests conducted, it can conclude that the
4s interval is suitable because it has the slightest delay
compared to other intervals.
- Data Loss Testing
Table 4.5. Testing Data loss from NodeMCU ESP8266 to
Antares
Interval
(
seconds
)
Data Loss
(
%
)
10
20
30
40
50
60
70
80
90
10 0
Based on Table 4.6, it can be seen that in
conducting data transmission trials, there was no data
loss found in data transmission.
- Overall Sensor Testing
This experiment uses two geophone sensors and three
soil moisture sensors. The node 1 geophone sensor is
installed at the top of the landslide, and the node 3
geophone sensor is installed at the bottom of the
landslide while the humidity sensor is placed in the
ground part of node 1, node 2 and node 3.
Testing scenario:
First, all data were taken randomly to determine the
value of humidity and vibration values during initial
Soil Deformation Monitoring System using Soil Vibration and Moisture Sensors
121
conditions. During 13 minutes, the box simulation is
vibrated twice. After 13 minutes, the researchers
experimented from dry to wet by spraying as much as
1 litre of water to replace rain. After 13 minutes, the
researchers vibrated five times randomly. After
that,
the researchers conducted
an experiment from wet
to dry, namely, installing two light bulbs to dry the
soil. The soil drying process lasts for an entire night.
After that, the researchers conducted another five
random vibrations. The following results are graphs
of the vibration sensor and soil humidity during dry,
dry to wet and wet to dry conditions.
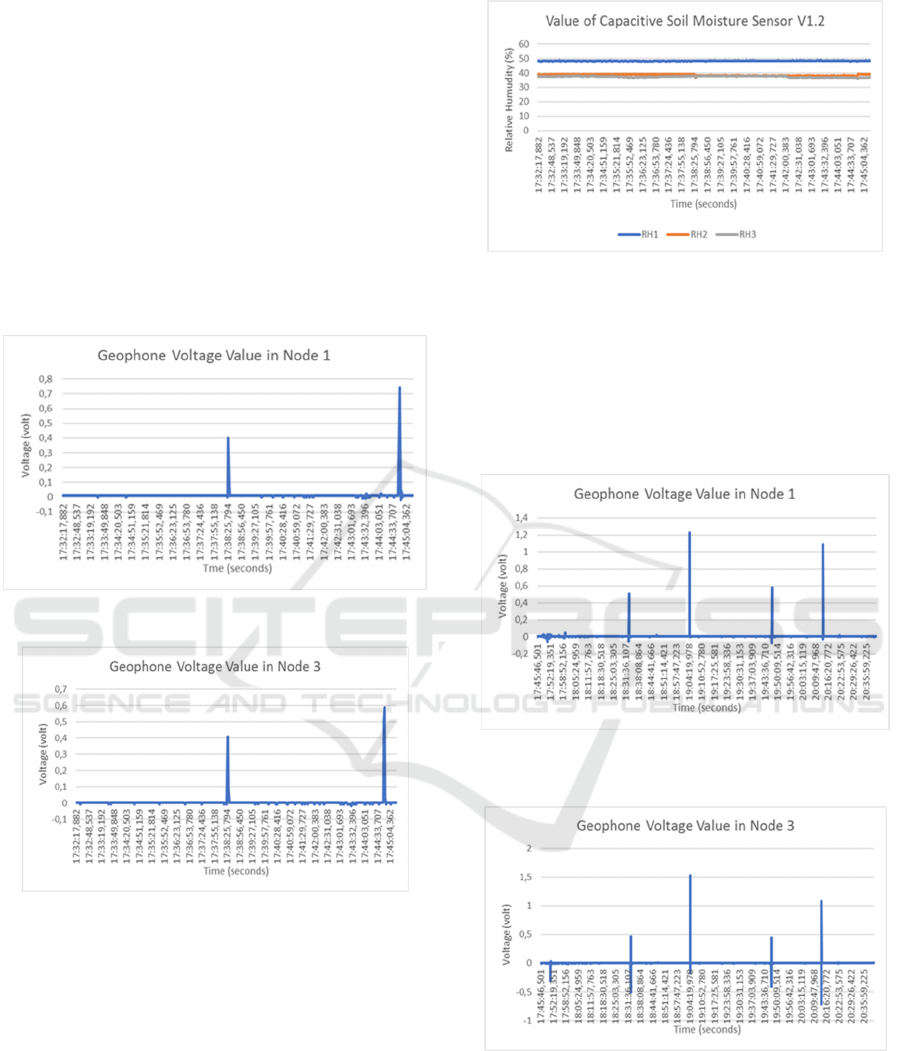
- Dry Conditions
Figure 5.1. Graph of Geophone Voltage Values in Node 1
During Dry Conditions
Figure 5.2. Graph of Geophone Voltage Values in Node 3
during dry conditions
In the two graphs above, the artificial vibrations are
made to 2 vibrations so that the two geophone sensors
detect these vibrations.
Figure 5.3. Capacitive Soil Moisture Sensor V1.2, during
dry conditions
Based on the graph above, when conditions are
dry, the geophone sensor detects two artificial
vibrations. It can conclude that the vibration created
does not affect the soil moisture level.
- Dry to Wet Conditions
Figure 5.4. Graph of Geophone Voltage Value in Node 1
during dry to wet
Figure 5.5. Geophone Voltage Value Charts in Node 3
during dry to wet
When conditions are dry to wet, the number of
artificial vibrations is carried out by five vibrations at
random, and the geophone sensor in node 1 detects a
total of 4 vibrations. In comparison, in node three, the
artificial vibrations detected amounted to 5
ICoSTE 2020 - the International Conference on Science, Technology, and Environment (ICoSTE)
122
vibrations. The geophone sensor at node three is
installed at the bottom of the landslide so that it is
faster and more sensitive when it receives vibrations.
Figure 5.6. Capacitive Soil Moisture Sensor V1.2 Graph
When Dry to Wet Conditions
Based on the capacitive soil moisture sensor v1.2
chart, the sensor value at nodes 1 and 2 has a good
increase. In contrast, sensor 3 has a rate increase due
to the location of sensor three at the bottom of the soil,
so that it takes a long time for water to seep into the
ground and detect by sensors. In the soil moisture
sensor graph, a dashed line indicates that the
geophone sensor is detecting the vibration at that
time. The test results from dry to wet conclude that
the change in soil moisture does not affect the ground
vibration, of the voltage generated by the ground
vibration sensor is relatively the same.
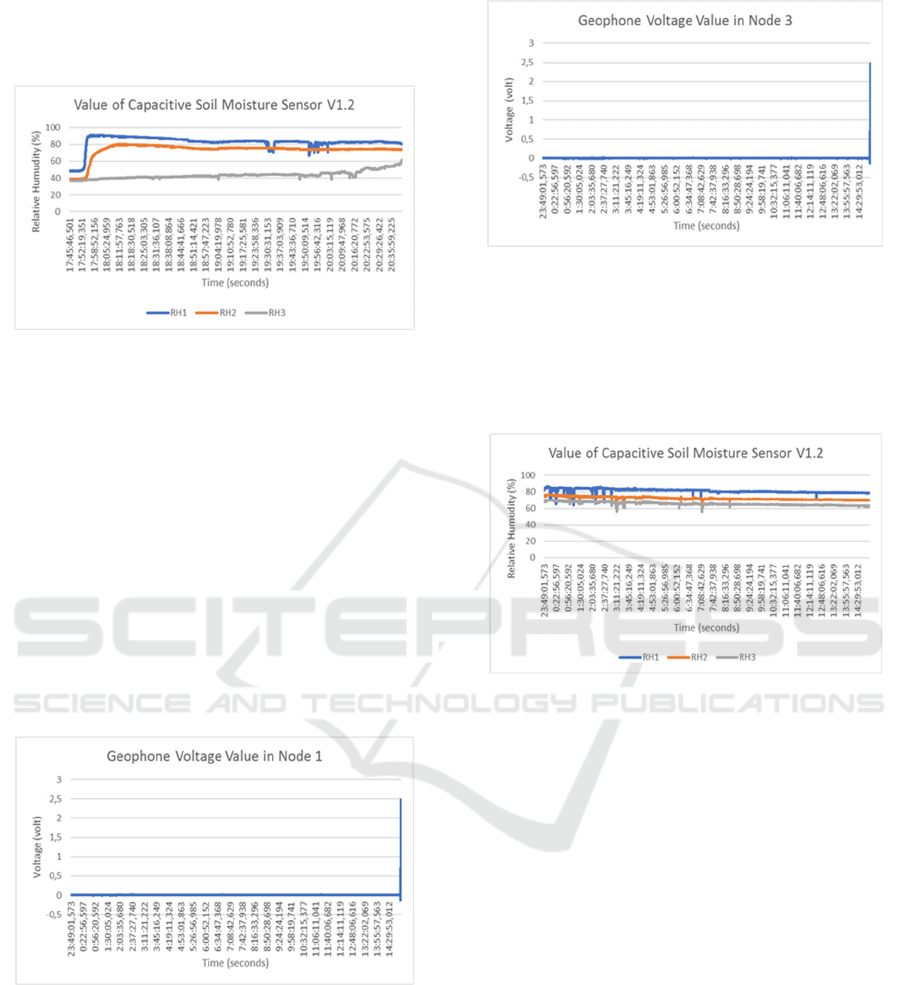
- Wet to Dry Condition
Figure 5.7. Geophone Voltage Value Charts in Node 1
during wet to dry
Figure 5.8. Geophone Voltage Value Chart in Node 3 when
during wet to dry
In Figure 4.8 and Figure 4.9 both geophones
experience the same increase in voltage. There was an
increase in voltage because, at that time, researchers
conducted artificial vibrations.
Figure 5.9. Capacitive Soil Moisture Sensor V1.2 Graph
during wet to dry
The graph above can conclude that the three
sensors can function well and experience a slight
decrease in per cent humidity. In the graph of
capacitive soil moisture sensor V1.2, there is a dotted
line indicating that the geophone sensor detects the
vibration at that time.
REFERENCES
A. Hartalita, A. Sugiana, A. Rusdinar, 2018, Sistem
Peringatan Tanah Longsor pada Jalur Kereta Api, e-
Proceeding of Engineering, Vol. 5, No., 3, pp. 4301-
4307.
BNPB, Data Bencana Tanah Longsor 2018, available at
http://bnpb.cloud/dibi/laporan4, 4 February 2019.
D. Widhiantoro, Purwarupa, 2015, Sistem Pendeteksi
Tanah Longsor Menggunakan Ultrasonik Dan
Infrared dengan Notifikasi SMS, Jurnal Kajian
Teknik Elektro, Vol. 1, No. 2.
Kumar, Matti Satish, Pradeep Kumar, Ritesh Chandra,
Sabarimalai Manikandan, 2016, Monitoring moisture
Soil Deformation Monitoring System using Soil Vibration and Moisture Sensors
123

of soil using low cost homemade Soil Moisture Sensor
and Arduino UNO, ICACCS 2016 IEEE
International.
Kunnath, Abishek Thekkyil, Ramesh, Menemsha
Vinodini, 2010, Integrating Geophone Network to
Real-Time Wireless Sensor Network System for
Landslide Detection, SENSORDEVICES, IEEE
International, pp.167-171.
L. Shkurti, 2017, Development of Ambient Environmental
Monitoring System Through Wireless Sensor
Network (WSN) Using NodeMCU and WSN
Monitoring, The 6
th
Mediterranean Conference On
Embedded Computing.
L. Zan, G. Latini, E. Piscina, G. Polloni, and P. Baldelli,
2002, Landslides Early Warning Monitoring System,
Geoscience and Remote Sensing Symposium,
IGARSS 2002, IEEE International, Vol 1, pp. 188-
190.
Prayogo, Sandy Suryo, 2016, The Use and Performance of
MQTT and CoAP as Internet of Things Application
Protocol using NodeMCU ESP8266, ICIC, IEEE
International.
Stevanus, Setiadi, K.. D., 2013, Alat Pengukur Kelembaban
Tanah Berbasis Mikrokontroler Pic 16f84, Jurnal
Teknik Elektro Universitas Kristen Maranatha, Vol.
3, No. 1.
Sudibyo, Novi Herawadi, 2015, Pendeteksi Tanah Longsor
Menggunakan Sensor Cahaya, Jurnal Teknologi
Informasi Magister, Vol. 1, No. 2.
ICoSTE 2020 - the International Conference on Science, Technology, and Environment (ICoSTE)
124
