
Application Design: Community Response to Disaster Information
System Features
Aninda W. Rudiastuti, Ellen Suryanegara and Yosef Prihanto
Research Division, Geospatial Information Agency, Raya Bogor street km. 46, Bogor, Indonesia
Keywords: Application design, community response, disaster information system
Abstract: A tool is needed to support a series of processes in disaster management, including an information system,
primarily spatial based, especially about spatial planning. Thus, it is necessary to review the profile of the
community as a community regarding their knowledge of disasters, their readiness in disaster mitigation
efforts, willingness to contribute to participatory mapping for disaster events, and the need for and requests
for disaster information application or system. Besides, the benefits of developing user-based applications
are expected to be utilized by various parties/levels of society/stakeholders and be helpful as a disaster
mitigation education infrastructure, media for increasing community participation in mapping, tools in
disaster mitigation-based spatial planning. The purpose of this research is to explore users' perceptions of
disasters and the need for features in an information system for disaster mitigation. The interactive design
emerged as a demand for app users. Also, people need an application that functioned as a powerful viewer
and contained up-to-date data. What is unique from the survey is that the public has various views regarding
the usefulness of the disaster information system.
1 INTRODUCTION
As the disaster has an extensive impact, it requires
society to concede disaster management. Nurjannah
in (Mahful, et.al., 2020) stated disaster management
as a dynamic process about the operational functions
(planning, organizing, actuating, controlling). It
includes prevention and mitigation for emergency
response and recovery. In developing countries,
disaster management is more prone to disaster risks
due to rapid urbanization, poorly planned urban
expansion, concentrated poverty, poor governance,
and environmental degradation (Brown, et.al.,
2018). A tool is needed to support a series of
processes in disaster management, including an
information system, primarily spatial based,
especially about spatial planning.
Currently, many web-based applications have
been created to disseminate information, especially
spatial-based. One area that is important in terms of
urgency to create a spatial-based information system
is a disaster. It is also in line with Indonesia's title as
a disaster self-service, so the disaster information
system is crucial. The use of GIS and the internet
has changed the process of utilizing geographic
information, accessing, sharing, and analyzing data,
where many advantages are gained by utilizing GIS
and the internet online (Tanaamah, Wardoyo, 2010).
As a forum for disseminating disaster
information and mitigation efforts, the Government
through Ministries / Agencies and NGOs, and even
academics have developed a web-based application
to increase the dissemination and understanding of
the community about disaster events and inspire
community participation in updating disaster or
hazard events. Community participation in mapping
is related to the Geo-participatory concept,
accommodating a series of practices that adopt
various tools, involve different participatory
processes, and produce different participation
outcomes. The crowdsourcing concept originated
from a collection of GIS practitioners, users, and
researchers who are more interested in the results of
gathering information (Verplanke, et.al., 2016).
Related to this, it is appropriate for an application or
disaster information system to be built with a user-
centred focus. Besides, the benefits of developing
user-based applications are expected to be utilized
by various parties/levels of society/stakeholders and
be helpful as a disaster mitigation education
infrastructure, media for increasing community
participation in mapping, tools in disaster
82
Rudiastuti, A., Suryanegara, E. and Prihanto, Y.
Application Design: Community Response to Disaster Information System Features.
DOI: 10.5220/0010794700003317
In Proceedings of the 2nd International Conference on Science, Technology, and Environment (ICoSTE 2020) - Green Technology and Science to Face a New Century, pages 82-89
ISBN: 978-989-758-545-6
Copyright
c
2022 by SCITEPRESS – Science and Technology Publications, Lda. All rights reserved

mitigation-based spatial planning. It is crucial to
afford a user-friendly interface to facilitate
geospatial information. In a web mapping
application, all principal elements (GIS databases,
web map servers, and web map browsers) should
delight the user needs and accomplish the objectives
of mapping services (Tsou, Curran, 2008).
The purpose of this research is to explore users'
perceptions of disasters and the need for features in
an information system for disaster mitigation
purposes. Using a questionnaire, we tried to examine
the features needed by a spatial information system
for disaster. Previous research has focused on the
technical side of informatics design and webGIS
development or applications (Cao, et.al., 2015). For
this reason, it is necessary to review the profile of
the community as a community regarding their
knowledge of disasters, their readiness in disaster
mitigation efforts, willingness to contribute to
participatory mapping for disaster events, and the
need for and requests for disaster information
application or system. It refers to the concept of
successful disaster risk reduction requiring a
collaborative approach from interdisciplinary. Thus
dissemination of information is communicated
effectively (Aye, et.al., 2016).
2 RESEARCH METHOD
2.1 Case Study Location and Period
In 2019, Semarang chose as the research location
due to its characteristics. As a developing coastal
city with a heterogeneous population (social and
ethnic variety), Semarang can provide an overview
of urban areas in Indonesia.
2.2 Data Collection and Analysis
A descriptive quantitative study is a way this
research goes. The data was collected using a
questionnaire. According to Arikunto (Mahful, et.al,
2020), "Questionnaire is a written statement that is
used to obtain information from the respondent in
the sense of a report about the person or things that
he knows." The primary data used in this research
include variable data used to measure people's
knowledge about disasters, willingness to be
involved, awareness of content, and feature choices
for disaster information systems/applications. El-
Masri and Tipple stated that citizens are increasingly
and particularly identified as key to progress in
disaster management, given their contributions to
risk information management and adaptation
measures (AlQahtany, Abubakar, 2020).
The convenience sampling method is used to
collect data. Convenience sampling (also known as
Haphazard Sampling or Accidental Sampling) a kind
of non-random sampling of the target population are
selected for the study on specific criteria
(geographical proximity, accessibility and
availability, or the willingness to volunteer)
(Farrokhi, Mahmoudi-Hamidabad, 2012). The total
number of respondents who were the target of the
questionnaire and interview was 120 respondents,
provided that the selected respondents had a
smartphone with internet access.
The distributed questionnaire was built based on
several research questions to fulfil the 1st stage 1 in
the Software Development Life Cycle, defining user
needs for a disaster application. Thus it will generate
input for application design that accommodates user
needs. The research questions used are:
• The level of internet/communication technology
utilization
• Knowledge of disaster
• Disaster Information System as a medium for
disseminating Disaster Geospatial Information/
Early Warning System
• Habits of community in accessing disaster
information
• Suggestions regarding the user interface of the
Information System that the community needs?
• Features needed by the community in a spatial-
based GIS application
• Examples of disaster webGIS known to the public?
• Public willingness to participate in dissemination
and validation of disaster information (support for
crowdsourcing)
To analyze the data obtained through the
questionnaire used descriptive analysis methods and
non-parametric statistical analysis that was chosen to
see whether there is a relationship between variables
and measured parameters. Also, non-parametric
statistical analysis was used to see how strong the
relationship and direction of the relationship
between variables and parameters were observed
using the crosstab analysis method or cross-
tabulation (Gelgel, 2020).
3 RESULTS AND DISCUSSION
3.1 Respondent Profile
Based on the age composition, most respondents
were from the 21-40 years age range (74.17% of
Application Design: Community Response to Disaster Information System Features
83

respondents). While respondents from 41-60 years
old were 10% and those aged less than 20 years was
15.83%. Based on this trend, most respondents are
considerably active in using technology because
nowadays, in that young and productive age range
(21-40 years old), the average respondent has been
exposed to a smartphone that has internet access.
Based on the education/academic background,
respondents with a higher education level are53.33%
from all samples. They were in college/university.
Meanwhile, 45.83%respondent having a primary
school/equivalent education level. Based on
occupation, the majority of respondents were
students (34.17%). Furthermore, 15% work as civil
servants, 28.33% are private employees, and the rest
are TNI/Polri, entrepreneurs, contract workers,
consultants, homemakers, lecturers/teachers, and
academic assistants.
The level of knowledge possessed by 120
respondents is generally in the moderate range (48%
of respondents) to high (46% of respondents).
Factors taken into account in assessing the level of
knowledge about disasters include (1) definition of
disasters and their types, (2) mechanisms for
disseminating disaster information through internet
networks, (3) applications for disseminating
disaster-related information, (4) existence of disaster
information systems as an effort to mitigate
disasters. Related to point (3), around 61.98% of
respondents know webGIS. It has become necessary
since knowledge in the community on the disaster
management index can be one source of information
in conducting a risk management disaster. In Aceh,
the results of a study of 210 students who received
education on geographic and earthquake risk
perception positively affect preparedness (Aksa,
et.al, 2020). Rosadi, with a research set in West
Karawang District, also concluded that student's
disaster preparedness behaviour could improve
through either disaster knowledge and
environmental culture (Rosadi, et.al, 2020). Even
though someone has been given education and
training, it is not sure that they will have a good
preparedness attitude if a disaster preparedness
factor does not function. The research results on the
relationship between the level of knowledge and the
attitude of landslide disaster preparedness in the
volunteers "Kelurahan Tangguh" in Kelurahan
Kotalama, Bandungrejosari and Polehan Kota
Malang states that there is a relationship between the
level of knowledge and attitudes of preparedness.
There is a positive relationship between knowledge
and the attitude toward landslide disaster
preparedness (Rini, et.al, 2010).
3.2 Digital Behaviour
The majority of respondents in this study tend to
include the digital literate crowd. It happens because
most respondents have a high level of education and
own a smartphone, so they have been exposed to a
lot of information obtained from the internet.
Therefore, in developing a good application, it is
necessary to observe the digital behaviour of
potential users. The exchange of various information
is often provided from various platforms on the
smartphone, including information related to
disasters. Currently, most respondents access
information about disaster events via mobile devices
such as smartphones or tablets (85.6%), while only
34.6% have access to disaster information via
computers/laptops (Figure 1). Based on this matter,
in the future, the application needs to be developed
in a mobile version that can be accessed using a
smartphone or tablet computer. It is crucial so that
users can be more efficiently and instantly access
disaster data.
Figure 1. Media to access data and information on the
disaster
Based on the survey results, most respondents
used smartphones to access social media and
messaging applications. For this reason, the data
sharing feature on social media is quite important to
be available on a disaster website/application. The
sharing feature to social media applications that are
used by the majority of the respondent, such as
Instagram, YouTube, Twitter & Facebook or
messaging applications (Line/Whatsapp) will make
the dissemination of disaster information more
effective and widespread quickly (Figure 2).
86%
32%
28%
08%
00%
100%
Accesstodata/informationondisaster
eventsthroughthemedia
Mobiledevices
ICoSTE 2020 - the International Conference on Science, Technology, and Environment (ICoSTE)
84

Figure 2. Social media applications used by the respondent
This matter is also consistent with research
conducted by Gelgel (2020) [13]which shows that:
(1) social media became the most resourceful media
to gain disaster information; (2) though some people
didn't verify the information (3) 30% respondent
share without verification. It explained that most
respondents have a high dependence on using social
media but still need improvement in gaining disaster
information.
Concerning disasters, 37% of respondents have
accessed Disaster Information Systems (Figure 3). It
shows that the respondents are gradually starting to
apprehend the importance of disaster information.
Some of the disaster information systems that
several respondents have accessed in Semarang are
websites from the BNPB Disaster Information
System (Inarisk, Unaware, Inasafe, DIBI, Disaster
Map), and BMKG Information System (Info
BMKG). Based on the survey results, respondents
accessed disaster information from the BMKG
website (22,7%) and BNPB website
(25%).Information related to the Disaster
Information System according to respondents came
from the internet/social media (63,3%), information
from family/friends/colleagues (13,3%), and
television/radio programs (10,0%). Based on this, it
can be observed that the internet/social media is the
most effective media for disseminating disaster
information in society.
Figure 3. Experience of the user in accessing Disaster
Website
3.3 Willingness to Participate
Natural disasters affect people expectations about
the prevalence and severity of future disasters
subjectively. It might affect individual investment
behaviours on their incomes. The consequences that
exposure to natural disasters has on risk attitudes,
perceptions, and behaviour. Assessment of the
public's willingness to be involved in disseminating
disaster information in this research is based on
several indicators, namely the willingness to receive
disaster-related information (mitigation, emergency
response, and post-disaster recovery activities),
willingness to disseminate disaster-related
information, willingness to verify information
related to disasters, willingness to do update
information related to disasters, as well as a
willingness to become a volunteer as a node for
disaster information networks.
The words "participatory action research"
highlight that the research subjects are full
participatory partners in the work of trying to solve a
problem. Action required to solve the problem needs
to arise from the collaboration. Lastly, research is
being (co)produced (Kelman, et.al, 2011).
Interesting findings by doing research in a coastal
metropolis of Saudi Arabia, where the cities have
been recently experiencing incidences of disasters,
such as floods, disease epidemics (AlQahtany,
Abubakar, 2020). The results indicate that although
almost two-thirds (64.7%) of the participants are
aware of disasters, and 81% are concerned about
disaster risks, less than half (47.3%) believe that
their settlements could be at risk. While 37% opine
that natural factors and human activities cause
disasters, about half (54%) indicate that they can
personally reduce disaster risks. However, the
analysis indicated a significant positive relationship
33,3%
33,3%
77,5%
77,5%
52,5%
10,8%
0,0% 20,0% 40,0% 60,0% 80,0% 100,0%
Facebook
Instagram
Youtube
63%
37%
Haveaccessed
DisasterWebsite
Never Yes
63,3%
10,0%
1,7%
13,3%
2,5%
Internet/Socialmedia
Television/radio…
Printedmedia…
Informationfrom…
Training
SourcesofInformationabout
DisasterWebsite
0% 20% 40% 60% 80% 100%
Application Design: Community Response to Disaster Information System Features
85
between place of residence, perception of disaster
risks, and concern about disaster risks.
Socioeconomic and demographic factors such as
age, education, income, and location (Al-Nammari,
Alzaghal, 2015), types of disasters, and prior
exposure to previous disasters like floods,
earthquakes, and landslides (Ho, et.al, 2008).
Based on the survey results, 59% of respondents
stated willingness to participate even though only
37% of the surveyed population had participated in
disseminating data and information on disaster
events. Most (83%) have the objective of sharing
data and information on disasters for an early
warning system. And 43% of respondents also chose
the importance of awards given to contributors to
disseminating data and information on disaster
events.
Based on the data from the questionnaire results,
a study was carried out on community knowledge
about disasters, the willingness of the community to
be involved, and awareness of content for
application development. The results of
questionnaire data processing obtained a study of
whether there is a relationship between several
independent variables (parameters) and the three
main (dependent) variables observed. The study
results and analysis of the relationship between the
variables of public knowledge about disasters and
the observed independent variables are presented in
Table 1. The study results and analysis of the
relationship between the variable people's
willingness to be involved and the observed
independent variables are presented in Table 2. The
study results and analysis of the relationship
between the awareness variables of the content with
the observed independent variables are presented in
Table 3.
Table 1. Relationship between Community Knowledge
Bound Variables and Independent Variables
Varia
bles
df PCS Tab Sig
A-Sig
2s
Rela
tion
Educa
tion
8
18,8
84
15,5
1
0,05 0,015
Job
8
13,9
62
15,5
1
0,05 0,083
Use
smartp
hone
4
15,9
74
9,49 0,05 0,003
Frequ
ently
access
ed lin
k
10
15,4
22
18,3
1
0,05 0,117
Use
spatial
-based
apps
4
8,33
3
9,49 0,05 0,08
Based on the data and processing results
presented in Table 1, it is known that the
independent variables of education, use of power
banks, and use of Android-based cellphones have a
relationship with the dependent variable, namely
public knowledge about disasters. These results raise
enough questions, especially regarding the
relationship between knowledge and two
independent variables, namely, power banks and
Android-based cellphones. This fact needs to be
explored further by analysing the direction and
strength of the relationship that will be presented
after this section.
Table 2. Relationship between Bound Variables
Community Willingness to Be Involved with Independent
Variables
Variable df PCS Tab Sig
A-Sig
2s
Rela
tion
Education
8
16,4
64
15,5
1
0,0
5
0,036
Job
8
18,5
68
15,5
1
0,0
5
0,017
Use
smartphon
e
4
11,1
84
9,49
0,0
5
0,025
Frequently
accessed
lin
k
10
18,8
54
18,3
1
0,0
5
0,042
Use
spatial-
b
ased apps
4 17,5 9,49
0,0
5
0,002
Table 3. Relationship between Bound Variables Content
Consciousness and Independent Variables
Variable
d
f
PC
S
Tab Sig
A-Sig
2s
Rela
tion
Education
8
9,17
7
15,5
1
0,0
5
0.328
Job
8
53,6
3
15,5
1
0,0
5
0
Use
smartphone
4
4,18
8
9,49
0,0
5
0,381
Frequently
accessed lin
k
1
0
6,54
3
18,3
1
0,0
5
0,768
Use spatial-
b
ased apps
4 6,63 9,49
0,0
5
0,157
Based on the data and processing results
presented in Table 2, it is known that the variable of
the willingness of the people to be involved has a
relationship or relationship with the independent
variables including regional position, education,
occupation, RT / RW management, use of Android-
based cellphones, the content most frequently
accessed and frequently used. Map content
applications. Based on these results, an
understanding is obtained that factors within or
outside the individual can influence the willingness
ICoSTE 2020 - the International Conference on Science, Technology, and Environment (ICoSTE)
86
to be involved. Further information on the pattern
and strength of the relationship between variables
will be presented in subsequent processing results.
Based on the data and processing results
presented in Table 3, it is known that the content
awareness variable is related to job variables and the
capacity of the power bank used. These results raise
new questions regarding the form of the relationship
that occurs. To better understand this phenomenon,
it is better to analyse this fact further by paying
attention to the results of the analysis of the strength
test and the direction of the relationship between
variables.
Table 4. Level of Strength and Direction Relationship
between Independent Variables and Bound Variables
Parameter Function
Know
ledge of
disaster
Willingn
ess to
invo
lve
Con
tent
Aware
ness
Education
Job
Correlation
Coefficient
,351
**
,199
*
-0,099
Sig. (2-tailed) 0,000 0,030 0,281
Parameter Function
Know
ledge of
disaster
Willingn
ess to
invo
lve
Con
tent
Aware
ness
Use
smartphone
Frequently
accessed
lin
k
Correlation
Coefficient
-0,077
-,204
*
-0,177
Sig. (2-tailed) 0,404 0,025 0,053
Use spatial-
based apps
Education
Correlation
Coefficient
-,293
**
-,298
**
-0,074
Sig. (2-tailed) 0,001 0,001 0,421
Job
Use
smartphone
Correlation
Coefficient
-,225
*
-0,170 -0,114
Sig. (2-tailed) 0,013 0,063 0,216
Frequently
accessed
link
Correlation
Coefficient
0,128
,192
*
0,144
Sig. (2-tailed) 0,165 0,035 0,116
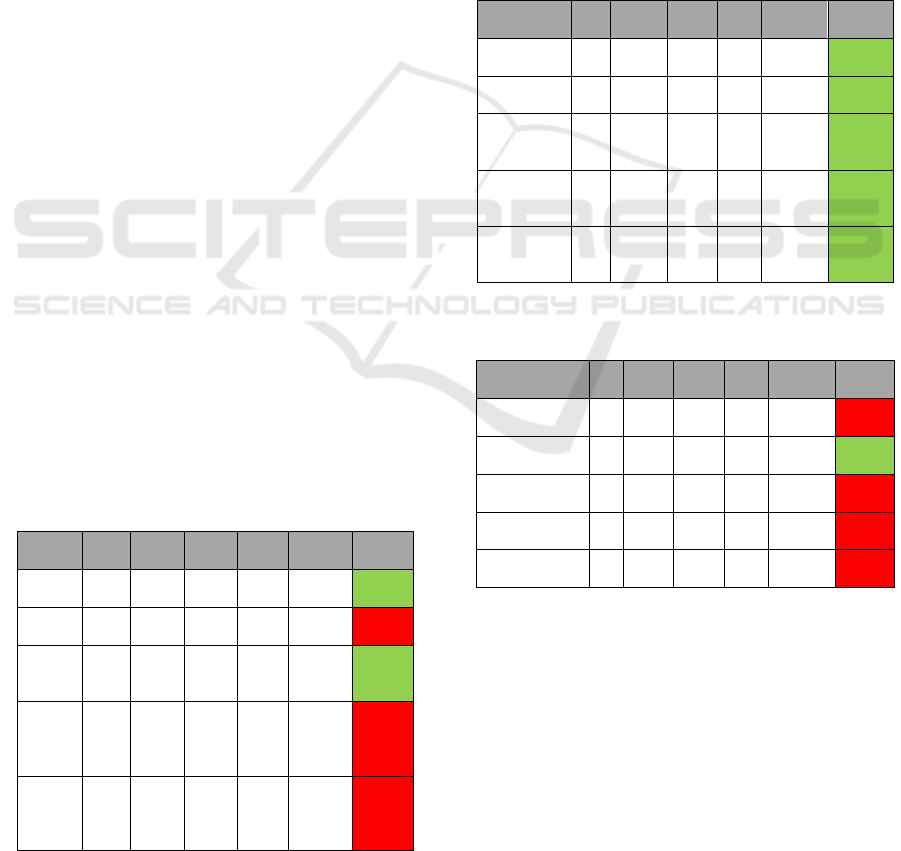
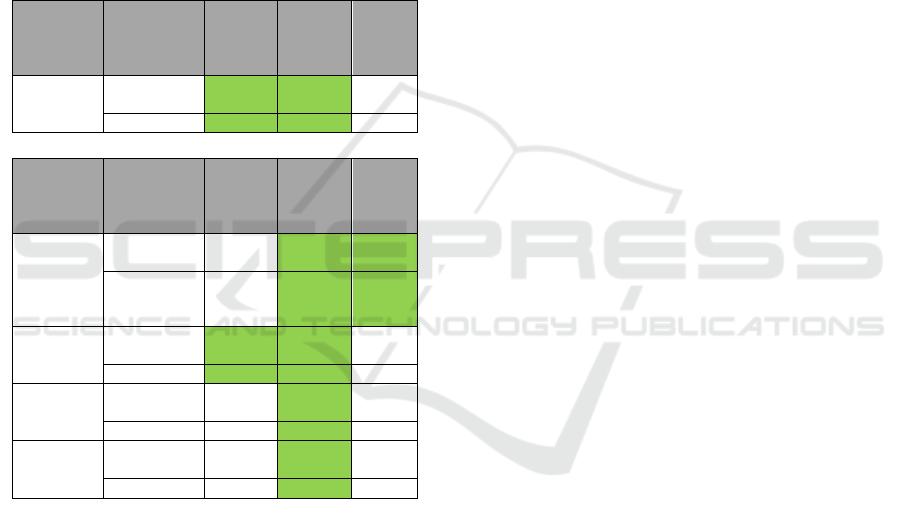
A table of analysis results is obtained based on
the non-parametric statistical analysis carried out to
see the strength of the relationship and the direction
of the relationship between all independent variables
and the dependent variable. Information that
presents data about the strength of the relationship
and the direction of the relationship is presented in
Table 21.
Based on the previous relationship test results,
the data observation can be focused on the part that
is coloured green in Table 4. The focus of these
observations is following the previous test results
that the data is known. There is a relationship
between the dependent variable and the observed
independent variables. User responses to disaster
information systems are obtained based on the
respondent's level of knowledge regarding disaster
websites/applications, values and perspectives
regarding the dissemination of disaster
data/information, willingness to participate in
disseminating disaster information to measure the
level of knowledge, perspectives, and agreement
used a Likert scale with 5 choices of answer scales.
3.4 Visualization of User Needs
towards Disaster Application
Development
User needs for Disaster Application Development
are obtained from assessing the quality of
content/information that is important to be
developed in the Disaster Application and the
requirement for developing the application. Based
on respondents' assessment of the quality of
content/information that is important to be
developed in a disaster website, it is recognized that
providing reliable and up-to-date data and
information (69%) and the accuracy of data and
information (74%). Furthermore, 92% of
respondents agreed that concerning developing
disaster application prototypes, an application that is
easy to use & learn (user friendly) and accessible
from various platforms (web or mobile) is urgently
needed. According to respondents, the most crucial
disaster type information to be accessible in a
disaster information system application is
information related to earthquakes (79%), tsunamis
(66%), volcanic eruptions (45%), and floods (39%).
Regarding the option of the essential features to be
performed in a disaster application, three features
get the highest score according to respondents: the
spatial data display feature/map viewer (89%); data
sharing feature (65%), and data searching features
(66%).
3.5 Integrated Disaster Information
System Design
To fulfill the picture obtained from the survey
results, an illustration has been compiled for an
integrated system for the Disaster Information
System as contained in Figure 4. Conceptually, the
application is designed to connect or take advantage
of services from portals or other applications,
especially those under the management of an
institution. It aims to achieve the effectiveness of
developing the application design, namely
minimizing the redundancy of the functions of
previously available applications. The integrated
Application Design: Community Response to Disaster Information System Features
87
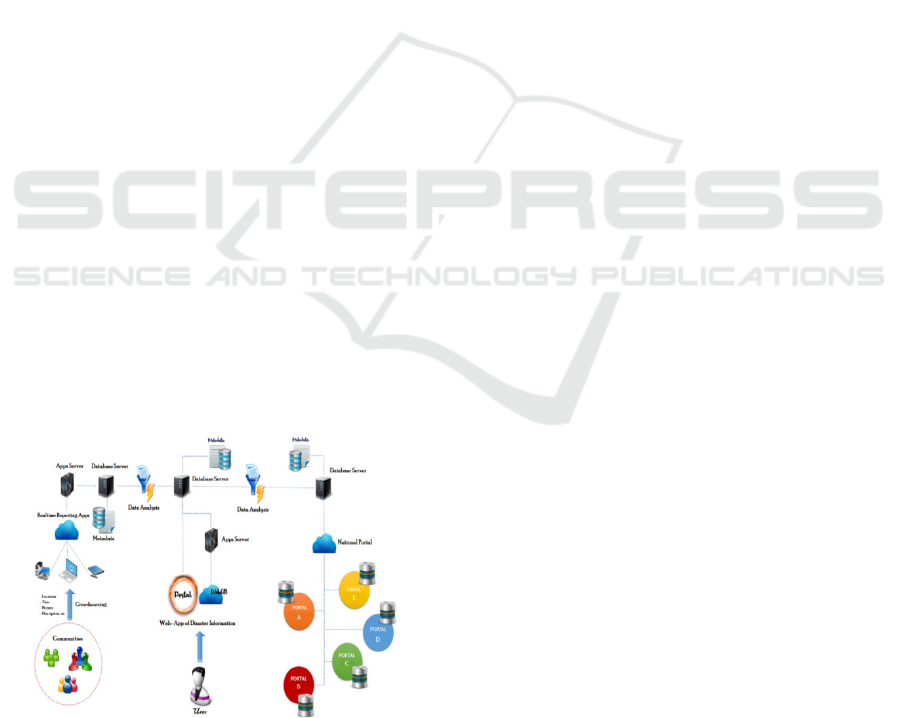
design involves various portals of disaster types that
are managed by both the government and the private
sector. Thus, in one application, the citizen can
receive / process and even update spatial data and
attributes for various disasters.
Meanwhile, based on the results of respondents,
according to the type of disaster that is most often
selected as a priority, the portals connected to the
information system contain at least information
related to Earthquakes, Tsunamis, Floods, and
Volcanic eruptions. In the crowdsourcing feature,
this application involves all community elements to
share information about reporting of natural
disasters. Users apply the crowdsourcing concept by
reporting natural disasters that are currently
happening. The report contains details such as the
incident's name, description, disaster category,
location, and evidence. The application is equipped
with the 'Disaster Reporting' feature to support the
participatory mapping of disaster themes. However,
this year, the reporting mechanism is still limited to
certain users who have the authority and
responsibility for verification, including for officers
to avoid hoax. However, users from the general
public who has verified can participate in reporting.
The application's disaster data reporting includes
location data (coordinates), events (time), event
documentation, and event definitions. Collaborative
efforts involving various stakeholders including the
government, the private sector, citizens, and civil
societies, can enhance disaster preparedness and
response from information provision to protect
vulnerable groups. Benson note that Donors,
international non-governmental organizations and
non-governmental organizations have become an
essential component in the evolving disaster risk
reduction context (Ruszcyk, et.al, 2020).
Figure 4. Integrated Design of Applicationfor Disaster
Information System
4 CONCLUSION
Increasing disaster literacy by developing a Disaster
Information System following user responses is
expected to grow the sense of responsibility,
preparedness, and independence of the community
when a disaster occurs and reduce disaster risk and
minimize casualties. In developing a disaster
website/application design, it is essential to consider
the digital behaviour of the potential user, their
willingness to participate in crowdsourcing, user
perceptions about the quality of content/information
to be developed, the needs for system development,
and types of disasters to be shown based on
respondent perspectives.
ACKNOWLEDGEMENTS
This research was conducted by the grant from the
Ministry of Research and Technology/National
Agency for Research and Innovation through
National Innovation System Research Incentive
(INSINAS) – FLAGSHIP program.
REFERENCES
AlQahtany and I. R. Abubakar, Public Perception and
Attitudes to Disaster Risks in a Coastal Metropolis of
Saudi Arabia, International Journal of Disaster Risk
Reduction, Vol. 44, p. 101422, 2020.
A. Ruszczyk et al., 2020, Empowering Women through
Participatory Action Research in Community-Based
Disaster Risk Reduction Efforts, International
Journal of Disaster Risk Reduction, Vol. 51,
November 2019.
A. Saputra, F. Ramdani, and S. Suprapto, 2018,
Pembangunan Arsitektur WebGIS Untuk Pemetaan
Daerah Yang Terdampak Erupsi Gunung Merapi
(Studi Kasus : Kabupaten Sleman), JPTIIK, Vol. 2,
No. 9, pp. 3233–3243.
Brown, A. J. Daigneault, E. Tjernström, and W. Zou,
2018, Natural Disasters, Social Protection, and Risk
Perceptions, World Development, Vol. 104, pp. 310–
325.
C. Aye, T. Sprague, V. J. Cortes, K. Prenger-Berninghoff,
M. Jaboyedoff, and M. H. Derron, 2016, A
Collaborative (web-GIS) Framework Based on
Empirical Data Collected from Three Case Studies in
Europe for Risk Management of Hydro-
Meteorological Hazards, International Journal of
Disaster Risk Reduction, Vol. 15, pp. 10–23.
Cao, B. Boruff, and I. Mcneill, Mapping It Out : A User-
Centered Design Framework for Webgis,
ICoSTE 2020 - the International Conference on Science, Technology, and Environment (ICoSTE)
88

Proceedings, The Bushfire and Natural Hazards CRC
& AFAC Conference, pp. 1–3, 2015.
F. Al-Nammari and M. Alzaghali, 2015, Towards Local
Disaster Risk Reduction in Developing Countries:
Challenges from Jordan, International Journal of
Disaster Risk Reduction, Vol. 12, pp. 34–41.
F. I. Aksa, S. Utaya, S. Bachri, and B. Handoyo,
Investigating the Role of Geography Education in
Enhancing Earthquake Preparedness : Evidence from
Aceh, Indonesia, International Journal of
GEOMATE, Vol. 19, No. 76, pp. 9–16, 2020.
Farrokhi and A. Mahmoudi-Hamidabad, Rethinking
Convenience Sampling: Defining Quality Criteria,
Theory Practice in Language Studies, Vol. 2, No. 4,
pp. 784–792, 2012.
H. Tsou and J. M. Curran, 2008, User-Centered Design
Approaches for Web Mapping Applications: A Case
Study with USGS Hydrological Data in the United
States, Lecture Notes in Geoinformation and
Cartography, pp. 301–321.
I. Kelman, J. Lewis, J. C. Gaillard, and J. Mercer, 2011,
Participatory Action Research for Dealing with
Disasters on Islands, Island Studies Journal, Vol. 6,
No. 1, pp. 59–86.
I. S. Rini, N. D. Kristianingrum, and R. Widyastikasari,
2019, Relationship Between Level of Disaster
Knowledge and Attitude of Landslide Disaster
Preparedness in Volunteers "Kelurahan Tangguh” in
Malang City, Jurnal Ilmu Keperawatan, Vol. 7, No.
2, pp. 133–144.
Indrianawati, D. M. Hakim, and A. Deliar, 2013,
Penyusunan Basis Data untuk Identifikasi Daerah
Rawan Banjir Dikaitkan dengan Infrastruktur Data
Spasial, Jurnal Rekayasa, Vol. 17, No. 1, pp. 22–31.
Kinzie, W. Cohn, M. Julian, and W. Knaus, 2001, A User-
Centered Model for Web Site Design , Journal of the
American Medical Informatics Association, Vol. 9,
No. 4, pp. 320–330.
M. Ras Amanda Gelgel, Media Sosial Dan Literasi
Kebencanaan Di Bali, Interaksi : Jurnal Ilmu
Komunikasi, Vol. 9, No. 1, pp. 19–30, 2020.
Mahful, A. Rosidah, A. Algifari, 2020, Public Relation
Knowledge about Disaster Management in the
Emergency Response Phase as an Effort for Disaster
Risk Reduction, IOP Conference Series: Earth and
Environmental Science, Vol. 562, No. 1.
M. C. Ho, D. Shaw, S. Lin, Y. C. Chiu, How Do Disaster
Characteristics Influence Risk Perception?, Risk
Analysis, Vol. 28, No. 3, pp. 635–643, 2008
P. Rosadi, I. Kadar, and Y. Istiadi, 2020, Relationship
Between Disaster Knowledge and Environmental
Culture with Disaster Preparedness Behaviour,
INJAST, Vol. 1, No. 1.
R. Tanaamah and R. Wardoyo, 2010, Perancangan dan
Implementasi Webgis Pariwisata Kabupaten Sumba
Timur, Jurnal Informatika, Vol. 9, No. 2.
Verplanke, M. K. McCall, C. Uberhuaga, G. Rambaldi,
and M. Haklay, 2016, A Shared Perspective for PGIS
and VGI, Cartographic Journal, Vol. 53, No. 4, pp.
308–317.
Application Design: Community Response to Disaster Information System Features
89
