The Influence of Building Facade Design on Thermal Comfort in
Classroom Case Study: Nasima Elementary School Semarang
Pratiwi Purnama Suradhuhita
and Erni Setyowati
Graduate Program of Architecture Engineering Faculty of Engineering, Diponegoro University, Semarang, Indonesia
Keywords: Thermal, Comfort, Façade, Building orientation
Abstract: Thermal comfort is an essential element in the learning process. Nasima Elementary School Semarang was
built in a densely populated area. To meet space requirements, development prioritizes land efficiency. It
results in a difference in thermal comfort in the classroom. Data of air, humidity, temperature, and radiation
is collected and analyzed to determine the effect of building orientation and facade design on thermal comfort
in the classroom compared to Mom-Weisebron comfort parameters. The study found that many classrooms
on the 2nd and 3rd floors do not fit into the Mom-Weisebron standard. The average effective room
temperature on the 2nd Floor is higher than on the 3rd Floor. It is due to differences in elevation, differences
in the design of the building facades and environmental conditions. The movement of air in the room needs
to be increased. A fan can be applied so that the effective temperature of the room is included in the criteria
for optimal comfort according to Mom-Wiesebron standards. If the application of a fan has not been able to
lower the effective temperature so that it is categorized as optimal comfort according to Mom-Weiseborn
standards, then AC needs to be used.
1 INTRODUCTION
In the design process, there are four comfort factors
in buildings that must be considered: room comfort,
visual comfort, audibility comfort, and thermal
comfort. Visual comfort in buildings is needed so that
humans can do their activities properly. Local
climatic conditions influence the level of productivity
and human health. If the climatic conditions are in
accordance with human physical needs, productivity
can reach its maximum point (Victor, 1963).
One of the factors that influence Thermal comfort
is the building façade (Mangunwijaya, 1997). The
building facade is a part of the building that is often
exposed to solar radiation. The direction of building
orientation has a significant influence on the
effectiveness of the function of the building facade.
One of the building facade tasks is to regulate the
conditions around the outside of the classroom, which
aims to ensure comfortable conditions in the room.
The thermal comfort limit for low conditions
ranges from a lower limit of 19°C TE to 26°C TE. At
26° C TE, many humans start to sweat. The most
suitable comfort limit for Indonesians used in this
study is the Mom-Wiesebron comfort limit as
follows: (Soegijanto, 1998).
Table 1. Mom-Wiesebron Comfort Zone Criteria
Criteria Effective Temperature (TE)
Cool Comfortable 20,5°C TE - 22,8°C TE
Optimal
Comfortable
22,8°C TE s.d. 25,8°C TE
Warm
Comfortable
25,8°C TE s.d. 27,1°C TE
2 RESEARCH METHODS
The object of writing is the classroom in Nasima
Elementary School Semarang. Classrooms are
facilitated with air conditioning for comfort in the
teaching and learning process. In their everyday use,
the windows tend to be closed by curtains, for thermal
comfort, by preventing the entry of solar radiation
heat into the room, so the classroom uses Air
Conditioner for temperature control all day long.
58
Purnama Suradhuhita, P. and Setyowati, E.
The Influence of Building Facade Design on Thermal Comfort in Classroom Case Study: Nasima Elementary School Semarang.
DOI: 10.5220/0010793200003317
In Proceedings of the 2nd International Conference on Science, Technology, and Environment (ICoSTE 2020) - Green Technology and Science to Face a New Century, pages 58-67
ISBN: 978-989-758-545-6
Copyright
c
2022 by SCITEPRESS – Science and Technology Publications, Lda. All rights reserved
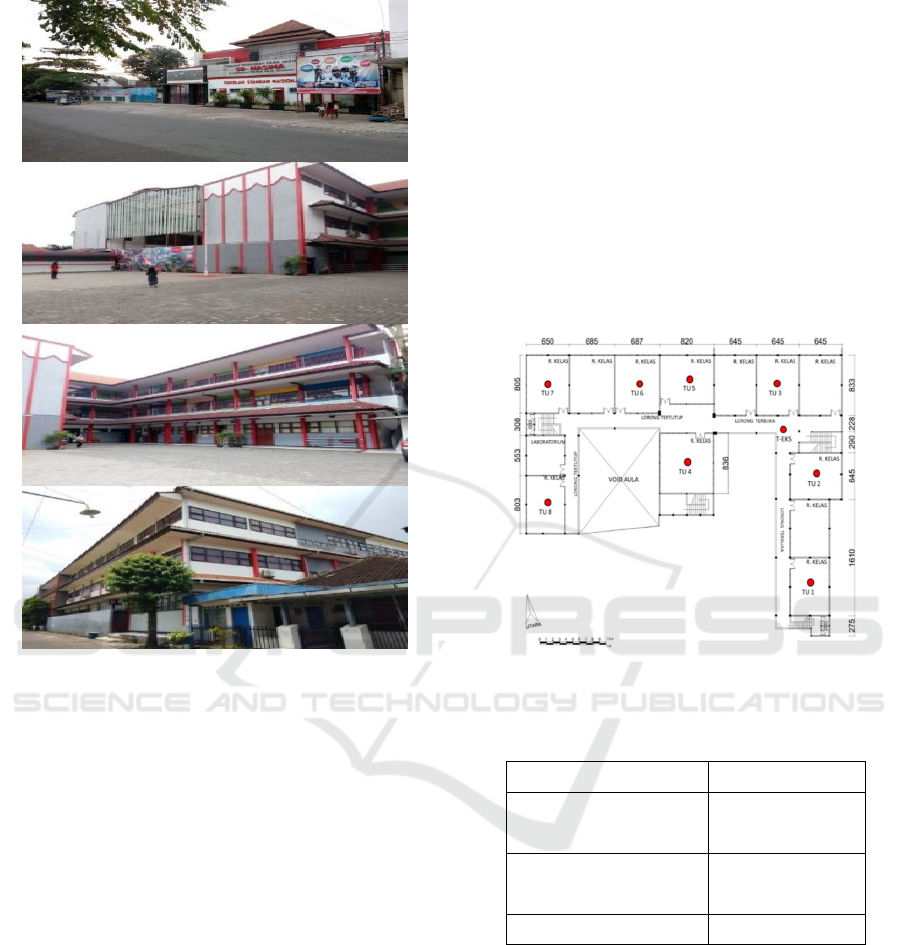
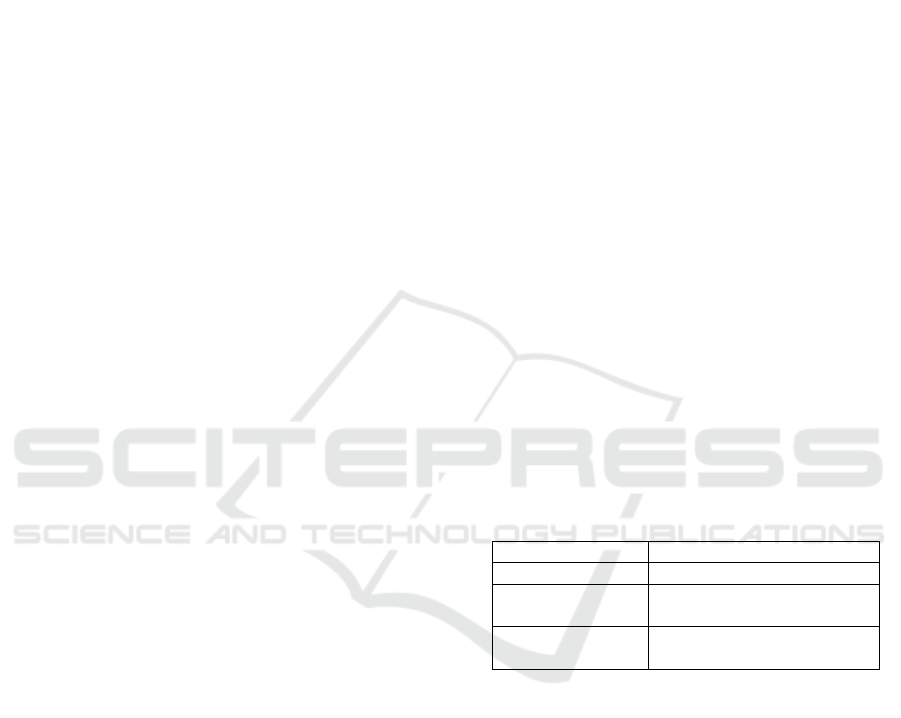
Figure 1. Existing Condition of Nasima Elementary School
The collection of field measurement data for
selected classrooms on the 2nd and 3rd Floor was
carried out on Saturday, May 20, 2017, where the
classrooms were empty and the weather conditions
were sunny. Measurements are carried out every 1
hour from 07.00-16.00 WIB. This time is chosen with
the consideration that at that time, the classroom is
used for teaching and learning activities.
The measurement of thermal comfort is carried
out at 18 measuring points, namely eight measuring
points in the selected classroom on the 2nd Floor and
one measuring point outside the 2nd-floor classroom
and eight measuring points in the selected classroom
on the 3rd Floor and one measuring point outside the
classroom on the 3rd Floor.
The analysis begins with processing field
measurement data, namely: Dry Air Temperature
(DBT), Air Humidity (RH), and Air Movement.
Furthermore, using the Psychometric Diagram to
determine the Wet Temperature (WBT) with the
determining indices, namely Dry Air Temperature
(DBT) and Air Humidity (RH).
Analysis of the effective temperature in the
Classroom of Nasima Elementary School Semarang
is carried out in two ways, the first model analysis by
processing the measurement results in the field in the
form of dry temperature, humidity, and air movement
in the room and the second model of practical
temperature analysis is carried out by processing the
measurement results in the field in the form of dry
temperature. Humidity with air movement are
assuming to be at the lowest point at a speed of
0.1m/sec. The adequate temperature data obtained are
then used to determine thermal comfort in school
buildings using the thermal comfort index according
to the Mom-Wiesebron criteria (Soegijanto, 1998).
Figure 2. Location of Thermal Measurement Points 2
nd
Floor and 3
rd
Floor Classroom Building
Table 2. Measuring instruments used in the current research
Instruments Branded
Hot Wire Anemometer
Krisbow 0.1-25
m/s
4 in 1 Environment
Meter
Lutron Lm-8000
Laser Distance Meter Bosch DLE-40
3 RESULTS AND DISCUSSION
The classroom in Nasima Elementary School
Semarang are facilitated with two air conditioning
and one ceiling fan. In table 3 is the following
explanation of the existing data in the Nasima
Elementary School Classroom.
The Influence of Building Facade Design on Thermal Comfort in Classroom Case Study: Nasima Elementary School Semarang
59
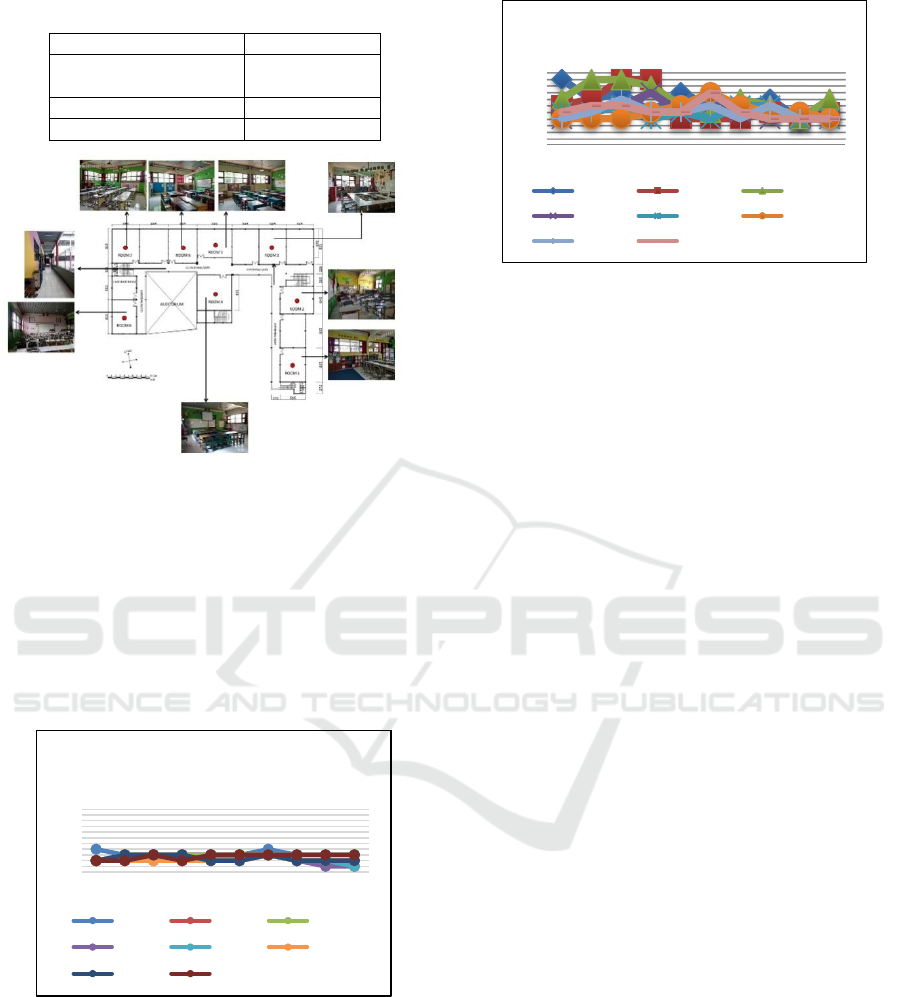
Table 3. Classroom Nasima Elementary School Semarang
Parameter Data
Square Measurement
Room Area
45-68 m2
Ceiling Height 3.6 m
Room Ca
p
acit
y
25
p
eo
p
le
Figure 3. Floor Plan of Nasima Elementary School with the
existing Classroom
3.1 Air Movement
Air movement data is obtained at the measuring point
of the 2nd and 3rd Floors with the conditions of the
empty classroom and open windows. The measuring
point for air movement is taken in the middle of
selected classrooms on the 2nd and 3rd floors from
07.00 to 16.00 WIB.
(a)
(b)
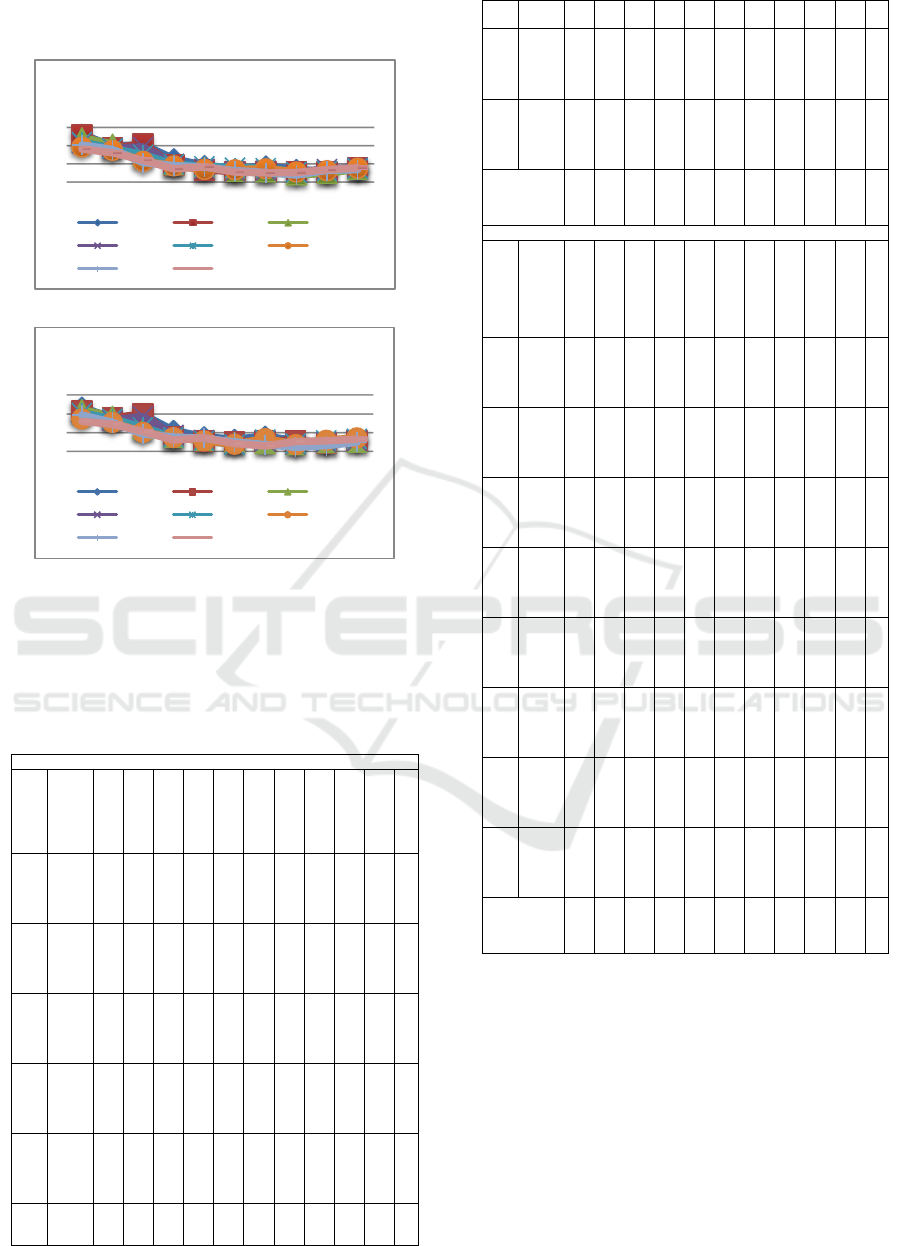
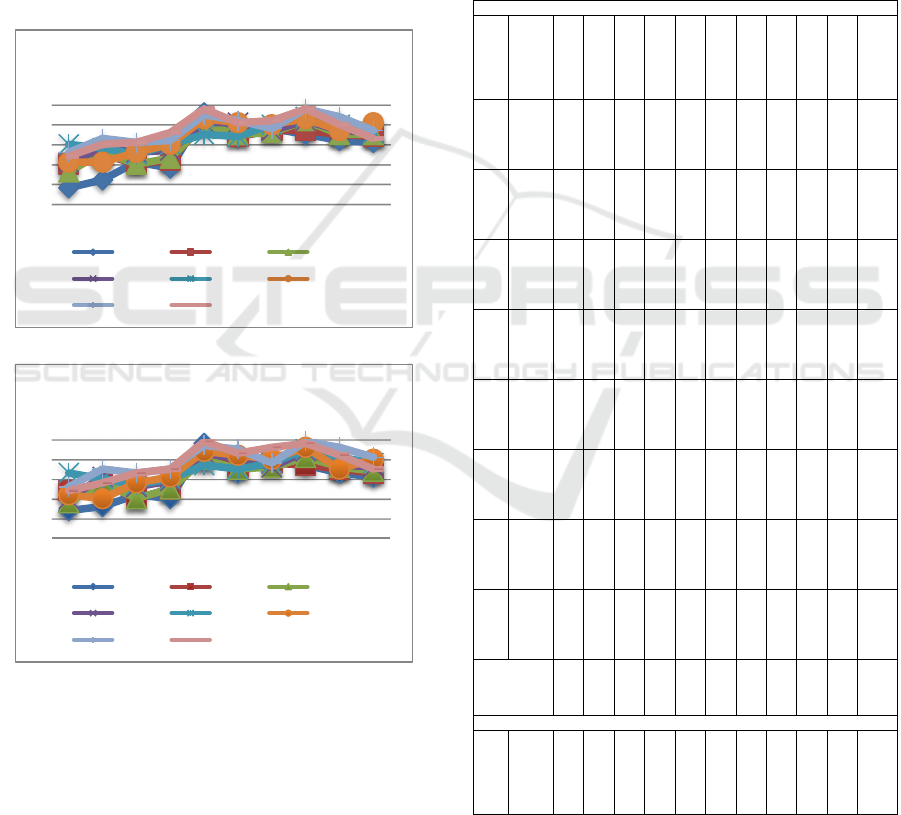
Figure 4. Field Measurement Graphic in Nasima
Elementary School Classroom. (a) Measurement of Air
Movement on 2
nd
Floor (b) Measurement Of Air Movement
on 3
rd
Floor
To maintain a comfortable conditions, the
airspeed should be in the range of 0.15 m / s to 0.25
m / s. [8] It can conclude from Table 4 that the air
movement of both the 2nd and 3rd floors has reached
the criteria for air movement in the room, with the air
movement on the 2nd Floor lower between 0.01-0.07
m/sec compared to the 3rd Floor.
The wind speed outside the classroom on the 3rd
Floor is faster than on the 2nd Floor. The movement
of the wind on the 3rd Floor gets less factor from the
surrounding objects, such as buildings and trees. This
condition results in air movement in the classroom on
the 3rd Floor. It is higher than the 2nd Floor even
though the classroom has window openings of the
same size and shape because the airflow velocity is
influenced by the height of the building and the
materials around the building (David, 1975). The
greater the ratio of the outlet area to the inlet, the
higher the wind speed in the room so that the room is
cooler (Becket & Godfrey, 1974). To increase the
volume of wind entering the room, the opening
should occur cross-ventilation (Francis, 1997).
3.2 Air Humidity
Air humidity measurements are carried out by
opening all window openings in selected classrooms
from 07.00 to 16.00 WIB with sunny weather
conditions throughout the day. In the measurement at
07.00 WIB, the exterior air humidity on the Second
Floor is 69.3% with a dry temperature of 29.5°C, and
on the third Floor, it is 69.2% with a dry temperature
of 29.6°C. Dry temperature is inversely proportional
to air humidity. The air in the morning is higher than
the humidity in the afternoon because the moisture
content in the morning is higher than in the afternoon.
This condition occurs because of the low heat of solar
0,14
0,15
0,16
0,17
0,18
0,19
0,2
0,21
0,22
0,23
0,24
0,25
07.00 08.00 09.00 10.00 11.00 12.00 13.00 14.00 15.00 16.00
MEASUREMENT OF AIR MOVEMENT ON
2ND FLOOR
TU1 (LT.2) TU2 (LT.2) TU3 (LT.2)
TU4 (LT.2) TU5 (LT.2) TU6 (LT.2)
TU7 (LT.2) TU8 (LT.2)
0,14
0,15
0,16
0,17
0,18
0,19
0,2
0,21
0,22
0,23
0,24
0,25
07.00 08.00 09.00 10.00 11.00 12.00 13.00 14.00 15.00 16.00
MEASUREMENT OF AIR MOVEMENT ON
3RD FLOOR
TU1 (LT.3) TU2 (LT.3) TU3 (LT.3)
TU4 (LT.3) TU5 (LT.3) TU6 (LT.3)
TU7 (LT.3) TU8 (LT.3)
ICoSTE 2020 - the International Conference on Science, Technology, and Environment (ICoSTE)
60
radiation and dry temperatures in the morning
(Georg, 1994).
(a)
(b)
Figure 5. Field Measurement Graphic in Nasima
Elementary School Classroom.
(a) Measurement of Air Humidity on 2
nd
Floor
(b) Measurement of Air Humidity on 3
rd
Floor
Table 5. Measurement of Air Humidity on 2nd Floor and
3
rd
Floor
MEASUREMENT OF AIR HUMIDITY (RH) ON 2ND FLOOR
R
O
O
M
S
ME
ASU
RIN
G
POI
NT
0
7
.
0
0
0
8
.
0
0
0
9
.
0
0
1
0
.
0
0
1
1
.
0
0
1
2
.
0
0
1
3
.
0
0
1
4
.
0
0
1
5
.
0
0
1
6
.
0
0
A
v
g
R
O
O
M
1
TU
1
7
1
,
1
6
4
,
6
6
5
,
3
5
7
,
5
5
3
,
7
5
2
5
3
,
5
5
1
,
6
5
0
,
3
5
2
5
7
,
1
6
R
O
O
M
2
TU
2
7
0
,
9
6
3
,
5
6
5
,
8
5
4
5
1
,
4
5
0
,
3
5
0
,
5
5
0
,
6
5
0
,
1
5
2
,
3
5
5
,
9
4
R
O
O
M
3
TU
3
6
9
,
3
6
5
,
7
5
9
5
4
,
3
5
2
,
8
5
0
,
5
5
0
,
2
4
8
,
5
4
9
,
4
5
1
,
8
5
5
,
1
5
R
O
O
M
4
TU
4
6
6
,
2
6
3
,
5
6
4
,
1
5
4
,
8
5
2
5
0
,
6
5
1
5
0
,
2
5
1
,
8
5
2
,
7
5
5
,
6
9
R
O
O
M
5
TU
5
6
6
,
9
6
3
,
2
5
9
,
8
5
4
,
5
5
3
,
4
5
2
,
6
5
2
,
4
5
0
,
1
5
0
,
7
5
2
,
2
5
5
,
5
8
R
O
O
TU
6
6
4
6
2
5
6
5
3
5
1
5
1
5
2
5
0
5
0
5
2
5
4
,
M
6
,
1
,
2
,
1
,
6
,
6
,
4
,
2
,
9
,
3
4
4
R
O
O
M
7
TU
7
6
5
,
2
6
2
,
6
5
5
,
4
5
3
,
7
5
2
,
9
5
0
,
9
4
9
,
9
4
8
,
5
5
1
5
1
,
5
5
4
,
1
6
R
O
O
M
8
TU
8
6
2
,
9
6
0
,
8
5
6
,
7
5
1
,
9
5
3
,
1
5
0
,
1
4
9
,
7
4
9
,
9
5
1
,
4
5
2
,
5
5
3
,
9
AVERAGE
6
7
,
1
6
3
,
3
6
0
,
3
5
4
,
3
5
2
,
6
5
1
,
1
5
1
,
2
5
0
5
0
,
7
5
2
,
2
MEASUREMENT OF AIR HUMIDITY (RH) ON 3RD FLOOR
R
O
O
M
S
ME
ASU
RIN
G
POI
NT
0
7
.
0
0
0
8
.
0
0
0
9
.
0
0
1
0
.
0
0
1
1
.
0
0
1
2
.
0
0
1
3
.
0
0
1
4
.
0
0
1
5
.
0
0
1
6
.
0
0
A
V
E
R
A
G
E
R
O
O
M
1
TU
1
6
8
,
5
6
2
,
6
6
4
,
4
5
5
,
8
5
2
,
4
5
1
5
2
,
7
5
0
,
2
4
9
,
3
5
0
,
2
5
5
,
7
1
R
O
O
M
2
TU
2
6
6
,
5
6
2
,
6
6
4
,
8
5
2
,
3
5
0
,
2
4
9
,
6
5
0
,
1
5
0
,
4
4
8
,
8
5
0
,
5
5
4
,
5
8
R
O
O
M
3
TU
3
6
7
,
1
6
3
,
5
5
6
,
7
5
2
,
1
5
0
,
5
4
9
,
3
4
8
,
7
4
8
,
1
4
9
,
2
4
9
,
5
5
3
,
4
7
R
O
O
M
4
TU
4
6
5
,
4
6
1
,
4
6
3
,
5
5
3
,
5
5
0
,
7
4
8
,
4
5
0
,
1
4
8
,
3
4
9
,
5
5
0
,
1
5
4
,
0
9
R
O
O
M
5
TU
5
6
5
,
3
6
2
,
2
5
7
,
5
5
2
,
2
5
0
,
2
4
8
,
2
5
0
,
9
4
8
,
7
5
0
,
5
5
1
,
3
5
3
,
7
R
O
O
M
6
TU
6
6
2
,
1
6
0
,
2
5
4
,
8
5
2
5
0
,
2
4
8
,
3
5
1
,
4
4
8
,
2
5
0
,
5
5
1
,
8
5
2
,
9
5
R
O
O
M
7
TU
7
6
4
,
2
6
0
,
2
5
3
,
9
5
2
,
3
5
1
,
5
4
9
,
6
4
8
,
1
4
6
,
7
4
7
,
6
4
9
,
4
5
2
,
3
5
R
O
O
M
8
TU
8
6
0
,
8
5
9
,
2
5
5
,
3
5
0
,
6
5
1
,
8
4
8
,
7
4
7
,
4
4
9
,
8
5
0
,
2
5
1
,
1
5
2
,
4
9
AVERAGE
6
5
6
1
,
5
5
8
,
9
5
2
,
6
5
0
,
9
4
9
,
1
4
9
,
9
4
8
,
8
4
9
,
5
5
0
,
5
The recommended relative humidity for tropical
areas for dense user spaces ranges from 55% - 60%
(Badan Standarisasi Nasional, 2001). From table 5, it
can be seen that the humidity on the 2
nd
Floor is
between 48.5 to 71.1%, and the humidity on the 3
rd
Floor is between 46.7 to 68.5%. The 2nd and 3rd
floors humidity tends to be above the maximum limit
of indoor air humidity from 07.00 and 08.00 WIB and
is below the minimum limit from 10.00 to 16.00 WIB
and only on the range at 09.00 WIB. This condition
occurs due to the absence of vegetation in the area
around the building so that solar heat radiation can
45
55
65
75
07.00 08.00 09.00 10.00 11.00 12.00 13.00 14.00 15.00 16.00
MEASUREMENT OF AIR HUMIDITY (RH) ON
2ND FLOOR
TU1 (LT.2) TU2 (LT.2) TU3 (LT.2)
TU4 (LT.2) TU5 (LT.2) TU6 (LT.2)
TU7 (LT.2) TU8 (LT.2)
45
55
65
75
07.00 08.00 09.00 10.00 11.00 12.00 13.00 14.00 15.00 16.00
MEASUREMENT OF AIR HUMIDITY (RH) ON
3RD FLOOR
TU1 (LT.3) TU2 (LT.3) TU3 (LT.3)
TU4 (LT.3) TU5 (LT.3) TU6 (LT.3)
TU7 (LT.3) TU8 (LT.3)
The Influence of Building Facade Design on Thermal Comfort in Classroom Case Study: Nasima Elementary School Semarang
61
enter the building directly. With the influence of
vegetation when the air moves under the tree canopy,
the temperature begins to decrease because the sun's
heat radiation is filtered by the leaves (Terry, 1987).
3.3 Dry Temperature
In determining thermal comfort, one of the
influencing factors is dry temperature. In measuring
dry temperature in selected classrooms, there is a
difference in dry temperature on the 2nd Floor and
3rd Floor. It is caused by several factors, namely the
angle of incidence of sunlight, altitude, wind
direction, ocean currents, clouds, and duration of sun
exposure (Georg, 1994).
(a)
(b)
Figure 6. Field Measurement Graphic in Nasima
Elementary School Classroom.
(a) The dry temperature on 2
nd
Floor
(b) (b) Dry Temperature on 3
rd
Floor
The TU7 classroom has the highest average
effective temperature on the 2nd and 3rd floors. This
room is on the west side of the school building, with
canopy window openings in north and west
orientations facing the outside of the school building.
In May, the sun is on the north side of the equator so
that the heat of daylight solar radiation can enter the
room through the tile canopy window in the north
orientation. In addition, in the afternoon, the sunset to
the west side caused solar radiation to enter the
classroom via a canopy window in a western
orientation (Georg, 1994). Heat enters the building
through a conduction process (through walls, roofs,
glass windows), and solar radiation transmitted
through windows/glass causes dry temperatures in the
room to be high (Basaria, 2005).
Table 6. Measurement of Dry Temperature on 2
nd
Floor and
3
rd
Floor
MEASUREMENT OF DRY TEMPERATURE ON 2ND FLOOR
R
O
O
M
S
ME
AS
URI
NG
POI
NT
0
7
.
0
0
0
8
.
0
0
0
9
.
0
0
1
0
.
0
0
1
1
.
0
0
1
2
.
0
0
1
3
.
0
0
1
4
.
0
0
1
5
.
0
0
1
6
.
0
0
Av
g
R
O
O
M
1
TU
1
2
9
,
8
3
0
,
2
3
1
,
1
3
0
,
8
3
3
,
6
3
2
,
5
3
2
,
8
3
2
,
5
3
2
,
2
3
2
,
1
31,
76
R
O
O
M
2
TU
2
3
1
3
1
,
5
3
1
3
1
,
2
3
3
,
1
3
2
,
4
3
2
,
7
3
2
,
7
3
2
,
5
3
2
,
4
32,
05
R
O
O
M
3
TU
3
3
0
,
6
3
1
,
6
3
1
3
1
,
3
3
3
3
2
,
5
3
2
,
6
3
3
,
2
3
2
,
5
3
2
,
5
32,
08
R
O
O
M
4
TU
4
3
1
,
1
3
1
,
8
3
1
,
6
3
1
,
7
3
3
,
1
3
3
,
1
3
2
,
7
3
3
,
2
3
2
,
7
3
2
,
6
32,
36
R
O
O
M
5
TU
5
3
2
3
1
,
8
3
1
,
5
3
2
3
2
,
5
3
2
,
4
3
3
3
3
,
4
3
3
3
2
,
6
32,
42
R
O
O
M
6
TU
6
3
1
,
1
3
1
,
1
3
1
,
6
3
2
3
3
,
3
3
3
,
1
3
3
3
3
,
3
3
2
,
7
3
3
,
1
32,
43
R
O
O
M
7
TU
7
3
1
,
6
3
2
,
3
3
2
,
1
3
2
,
2
3
3
,
5
3
3
,
2
3
2
,
8
3
3
,
8
3
3
,
4
3
2
,
7
32,
76
R
O
O
M
8
TU
8
3
1
,
4
3
2
3
2
,
1
3
2
,
6
3
3
,
8
3
3
,
1
3
3
,
2
3
3
,
8
3
3
3
2
,
3
32,
73
AVERAGE
3
1
,
1
3
1
,
5
3
1
,
5
3
1
,
7
3
3
,
2
3
2
,
8
3
2
,
9
3
3
,
2
3
2
,
8
3
2
,
5
MEASUREMENT OF DRY TEMPERATURE ION 3RD FLOOR
R
O
O
M
S
ME
AS
URI
NG
POI
NT
0
7
.
0
0
0
8
.
0
0
0
9
.
0
0
1
0
.
0
0
1
1
.
0
0
1
2
.
0
0
1
3
.
0
0
1
4
.
0
0
1
5
.
0
0
1
6
.
0
0
AV
ER
AG
E
29
30
31
32
33
34
07.00 08.00 09.00 10.00 11.00 12.00 13.00 14.00 15.00 16.00
TEMPERATUR UDARA KERING TITIK UKUR 1-8
LANTAI 2
TU1 (LT.2) TU2 (LT.2) TU3 (LT.2)
TU4 (LT.2) TU5 (LT.2) TU6 (LT.2)
TU7 (LT.2) TU8 (LT.2)
29
30
31
32
33
34
07.00 08.00 09.00 10.00 11.00 12.00 13.00 14.00 15.00 16.00
TEMPERATUR UDARA KERING TITIK UKUR 1-8
LANTAI 3
TU1 (LT.3) TU2 (LT.3) TU3 (LT.3)
TU4 (LT.3) TU5 (LT.3) TU6 (LT.3)
TU7 (LT.3) TU8 (LT.3)
ICoSTE 2020 - the International Conference on Science, Technology, and Environment (ICoSTE)
62
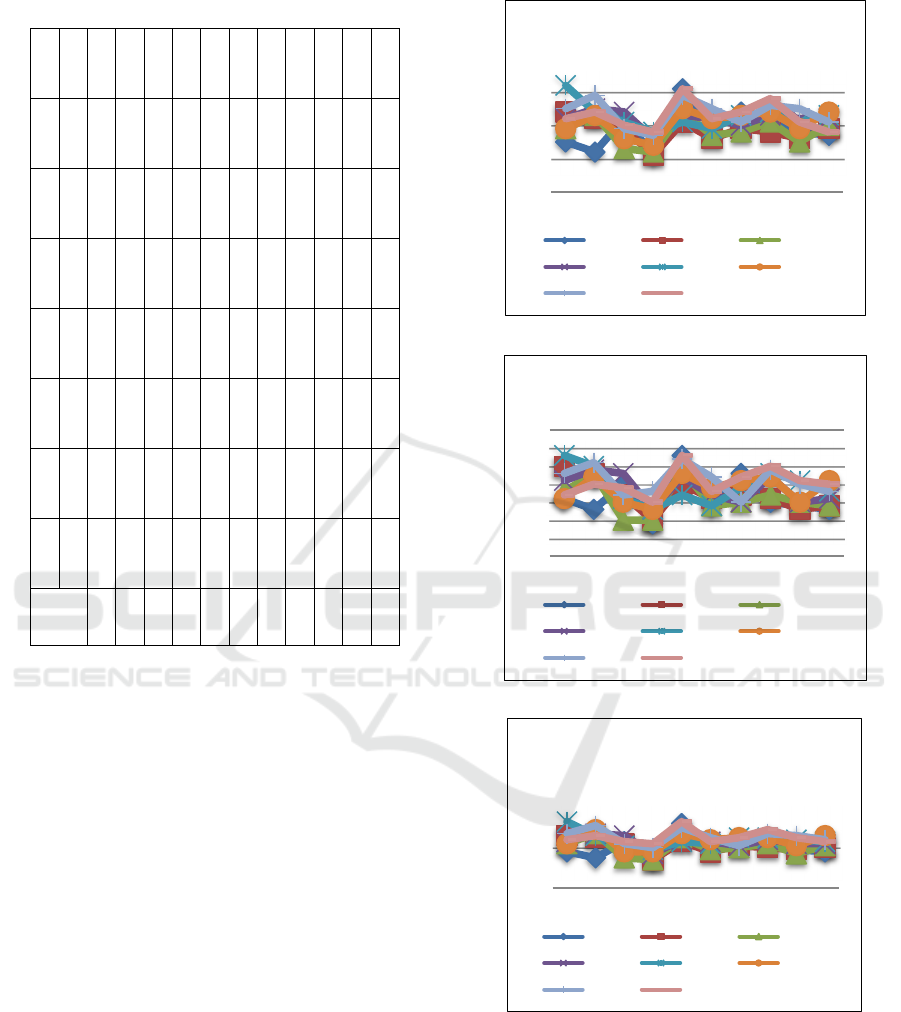
Table 6. Measurement of Dry Temperature on 2
nd
Floor and
3
rd
Floor (cont.).
R
O
O
M
1
T
U
1
3
0
,
4
3
0
,
6
3
1
,
2
3
1
3
3
,
8
3
2
,
3
3
3
3
2
,
7
3
2
,
3
3
2
,
1
3
1
,
9
4
R
O
O
M
2
T
U
2
3
1
,
4
3
1
,
8
3
1
3
1
,
5
3
3
3
2
,
6
3
2
,
8
3
2
,
7
3
2
,
5
3
2
,
3
3
2
,
1
6
R
O
O
M
3
T
U
3
3
0
,
8
3
1
,
8
3
1
3
1
,
5
3
3
3
2
,
5
3
2
,
6
3
3
,
1
3
2
,
6
3
2
,
4
3
2
,
1
3
R
O
O
M
4
T
U
4
3
1
3
2
,
1
3
1
,
6
3
1
,
9
3
3
,
3
3
3
3
2
,
6
3
3
,
4
3
2
,
7
3
2
,
6
3
2
,
4
2
R
O
O
M
5
T
U
5
3
2
,
3
3
2
3
1
,
7
3
2
3
2
,
7
3
2
,
5
3
2
,
8
3
3
,
5
3
3
,
1
3
2
,
8
3
2
,
5
4
R
O
O
M
6
T
U
6
3
1
,
2
3
1
3
1
,
8
3
2
,
1
3
3
,
4
3
3
,
2
3
3
3
3
,
6
3
2
,
5
3
3
3
2
,
4
8
R
O
O
M
7
T
U
7
3
1
,
6
3
2
,
5
3
2
,
3
3
2
,
5
3
3
,
7
3
3
,
5
3
2
,
8
3
3
,
9
3
3
,
6
3
3
,
1
3
2
,
9
5
R
O
O
M
8
T
U
8
3
1
,
4
3
1
,
8
3
2
,
3
3
2
,
5
3
3
,
9
3
3
,
3
3
3
,
6
3
3
,
8
3
3
,
2
3
2
,
5
3
2
,
8
3
AVER
AGE
3
1
,
3
3
1
,
7
3
1
,
6
3
1
,
9
3
3
,
4
3
2
,
9
3
2
,
9
3
3
,
3
3
2
,
8
3
2
,
6
The dry temperature of both the 2nd Floor and 3rd
Floor is low in the morning then high in the afternoon,
as described in table 6. The difference in dry
temperature on the 3rd Floor is higher between 0.1-
0.6°C than on the 2nd Floor. The 3rd-floor measuring
point is higher than the 2nd Floor; even though the
classroom has a similar facade design and openings,
it is due to the elevation of the classroom on the 3rd
Floor, which is higher than the 2nd-floor classroom
so that the classroom is exposed to solar radiation
longer.
3.4 Effective Temperature Analysis
Processing data carried out an analysis of the effective
temperature of the first model in selected classrooms
from the measurement results in the field, namely in
the form of dry temperature, humidity and air
movement data on measurements on May 20, 2017.
And the analysis of the effective temperature of the
second model was carried out by processing the
measurement data in the field in the form of
temperature dry and humidity. At the same time, the
air movement is assume to be at a speed of 0.1m /s.
(a)
(b)
(c)
25
26
27
28
07.00 08.00 09.00 10.00 11.00 12.00 13.00 14.00 15.00 16.00
TEMPERATUR EFEKTIF TITIK UKUR 1-8
LANTAI 2
TU1 (LT.2) TU2 (LT.2) TU3 (LT.2)
TU4 (LT.2) TU5 (LT.2) TU6 (LT.2)
TU7 (LT.2) TU8 (LT.2)
25
25,5
26
26,5
27
27,5
28
28,5
07.00 08.00 09.00 10.00 11.00 12.00 13.00 14.00 15.00 16.00
TEMPERATUR EFEKTIF TITIK UKUR 1-8
LANTAI 3
TU1 (LT.3) TU2 (LT.3) TU3 (LT.3)
TU4 (LT.3) TU5 (LT.3) TU6 (LT.3)
TU7 (LT.3) TU8 (LT.3)
25
27
07.00 08.00 09.00 10.00 11.00 12.00 13.00 14.00 15.00 16.00
SECOND MODEL EFFECTIVE
TEMPERATURE ANALYSIS ON 2ND
FLOOR
TU1 (LT.2) TU2 (LT.2) TU3 (LT.2)
TU4 (LT.2) TU5 (LT.2) TU6 (LT.2)
TU7 (LT.2) TU8 (LT.2)
The Influence of Building Facade Design on Thermal Comfort in Classroom Case Study: Nasima Elementary School Semarang
63
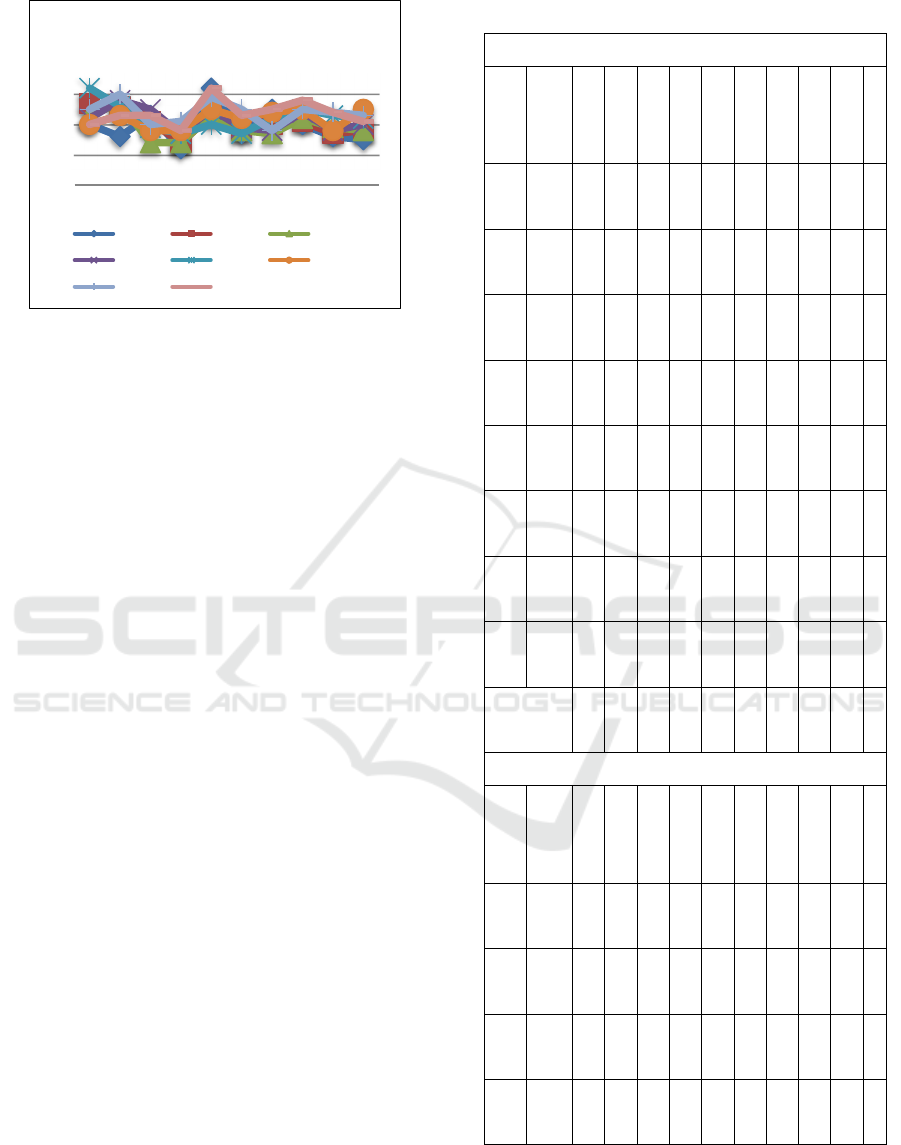
(d)
Figure 7. Field Measurement Graphic in Nasima
Elementary School Classroom.
(a) First Model Effective Temperature on 2
nd
Floor
(b) First Model Effective Temperature on 3
rd
Floor
(c) Second Model Effective Temperature on 2
nd
Floor
(d) Second Model Effective Temperature on 3
rd
Floor
The research results show that the effective
temperature on the 3rd Floor tends to be lower than
the 2nd Floor, especially at the measuring points
TU1, TU2, and TU3. This condition is influenced by
the orientation of the building with the openings
protected from direct sunlight so that the classroom is
protected from the heat of solar radiation (James,
1994).
3.5 Thermal Comfort Analysis of the
First Model Mom-Wiesebron
According to the Mom-Wiesebron thermal comfort
standard, the effective temperature is in the criteria of
cool comfort between 20.5-22.8 ºC TE, optimal
comfort between 22.8-25.8 ºC TE, and warm
comfortably between 25.8-27.1 ºC TE. In
comparison, temperatures below 20.5 ºC TE are
categorized as cold and above 27.1 ºC TE are
categorized as hot (Soegijanto, 1998). The first model
of thermal comfort analysis is carried out using field
data in the form of the same dry temperature and
humidity and air movement results of field
measurements. The thermal comfort analysis using
the Mom-Wieseborn standard in the first model
obtained the results of the comfort level as in Table 7.
Table 7. First Model Thermal Comfort Level
THERMAL COMFORT LEVEL ON 1ST MODEL ON 2ND
FLOOR
RO
O
MS
ME
AS
URI
NG
POI
NT
0
7.
0
0
0
8.
0
0
0
9.
0
0
1
0.
0
0
1
1.
0
0
1
2.
0
0
1
3.
0
0
1
4.
0
0
1
5.
0
0
1
6
.
0
0
RO
O
M
1
TU
1
2
6,
5
2
6,
2
2
7,
2
2
6,
1
2
8,
1
2
6,
9
2
7,
4
2
7,
1
2
6,
8
2
6
,
7
RO
O
M
2
TU
2
2
7,
4
2
7,
2
2
6,
9
2
6,
1
2
7,
1
2
6,
6
2
6,
9
2
6,
8
2
6,
6
2
6
,
9
RO
O
M
3
TU
3
2
6,
9
2
7,
3
2
6,
3
2
6,
2
2
7,
4
2
6,
7
2
6,
8
2
7,
1
2
6,
5
2
7
RO
O
M
4
TU
4
2
7,
2
2
7,
5
2
7,
4
2
6,
6
2
7,
3
2
7,
2
2
7
2
7,
3
2
7,
2
2
7
,
2
RO
O
M
5
TU
5
2
8,
2
2
7,
4
2
7,
1
2
6,
8
2
7,
1
2
6,
9
2
7,
3
2
7,
4
2
7,
1
2
7
,
3
RO
O
M
6
TU
6
2
6,
9
2
7,
7
2
6,
6
2
6,
4
2
7,
5
2
7,
2
2
7,
3
2
7,
4
2
6,
9
2
7
,
4
RO
O
M
7
TU
7
2
7,
5
2
7,
9
2
6,
9
2
6,
7
2
7,
9
2
7,
5
2
7,
1
2
7,
6
2
7,
5
2
7
,
1
RO
O
M
8
TU
8
2
7,
2
2
7,
4
2
7
2
6,
9
2
8,
1
2
7,
2
2
7,
4
2
7,
8
2
7,
1
2
6
,
8
AVERAG
E
2
7,
2
2
7,
3
2
6,
9
2
6,
5
2
7,
6
2
7
2
7,
2
2
7,
3
2
7
2
7
,
1
THERMAL COMFORT LEVEL ON 1ST MODEL ON 3RD
FLOOR
RO
O
MS
ME
AS
URI
NG
POI
NT
0
7.
0
0
0
8.
0
0
0
9.
0
0
1
0.
0
0
1
1.
0
0
1
2.
0
0
1
3.
0
0
1
4.
0
0
1
5.
0
0
1
6
.
0
0
RO
O
M
1
TU
1
2
6,
6
2
6,
3
2
7
2
5,
9
2
7,
8
2
6,
4
2
7,
3
2
6,
5
2
6,
4
2
6
,
3
RO
O
M
2
TU
2
2
7,
5
2
7,
3
2
6,
7
2
6
2
7
2
6,
6
2
6,
7
2
6,
6
2
6,
3
2
6
,
4
RO
O
M
3
TU
3
2
6,
8
2
7,
4
2
6
2
6
2
7,
3
2
6,
4
2
6,
5
2
6,
7
2
6,
5
2
6
,
4
RO
O
M
4
TU
4
2
7,
1
2
7,
4
2
7,
3
2
6,
3
2
7,
2
2
6,
7
2
6,
5
2
7,
2
2
6,
5
2
6
,
6
25
26
27
28
07.00 08.00 09.00 10.00 11.00 12.00 13.00 14.00 15.00 16.00
SECOND MODEL EFFECTIVE TEMPERATURE
ANALYSIS ON 2ND FLOOR
TU1 (LT.3) TU2 (LT.3) TU3 (LT.3)
TU4 (LT.3) TU5 (LT.3) TU6 (LT.3)
TU7 (LT.3) TU8 (LT.3)
ICoSTE 2020 - the International Conference on Science, Technology, and Environment (ICoSTE)
64
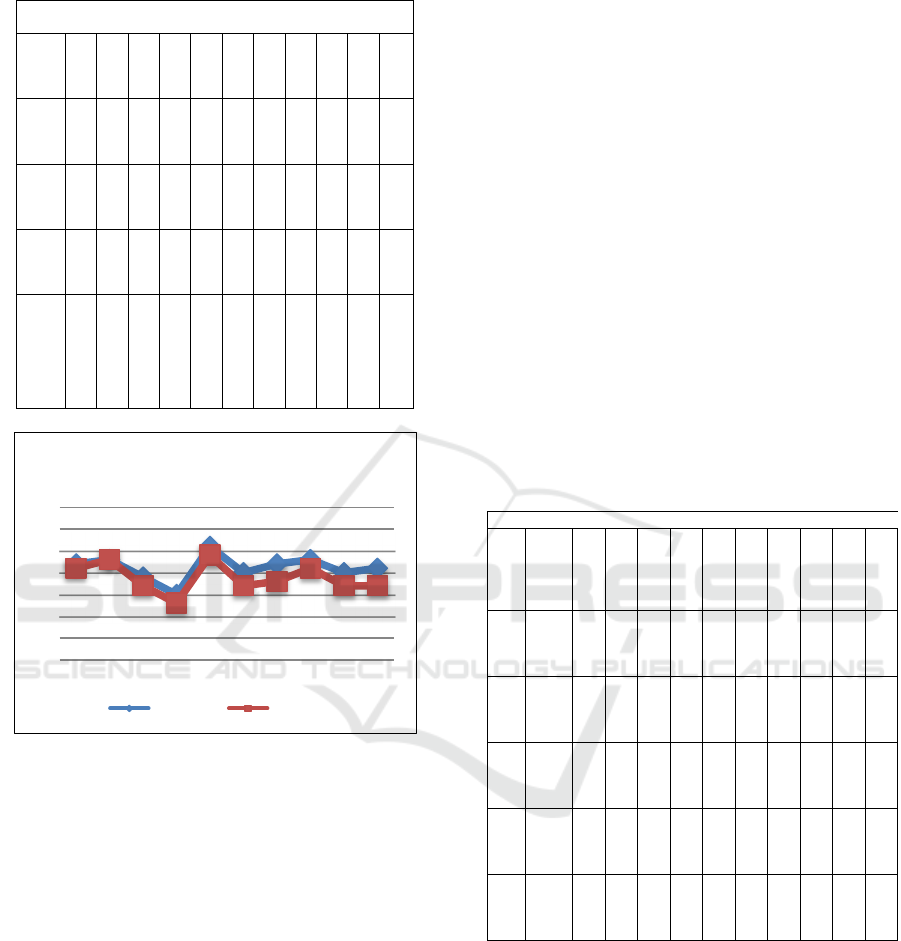
Table 7. First Model Thermal Comfort Level (cont.).
(continued Table 7) THERMAL COMFORT LEVEL ON 1ST
MODEL ON 3RD FLOOR
RO
OM
5
T
U
5
2
7
,
8
2
7
,
5
2
6
,
6
2
6
,
3
2
6
,
7
2
6
,
4
2
6
,
9
2
7
,
3
2
7
,
1
2
6,
8
RO
OM
6
T
U
6
2
6
,
6
2
7
,
6
2
6
,
5
2
6
,
3
2
7
,
3
2
6
,
9
2
7
,
1
2
7
,
2
2
6
,
5
2
7,
1
RO
OM
7
T
U
7
2
7
,
3
2
7
,
6
2
6
,
7
2
6
,
8
2
7
,
7
2
7
,
2
2
6
,
5
2
7
,
4
2
7
2
6,
8
RO
OM
8
T
U
8
2
6
,
7
2
7
2
6
,
9
2
6
,
5
2
7
,
8
2
6
,
8
2
7
,
2
2
7
,
5
2
7
,
1
2
7
AV
ER
AG
E
2
7
,
1
2
7
,
3
2
6
,
7
2
6
,
3
2
7
,
4
2
6
,
7
2
6
,
8
2
7
,
1
2
6
,
7
2
6
,
7
A
V
E
R
A
G
E
Figure 8. Graph of Average Per Hour of First Model
Thermal Comfort
Air movement is influenced by the shape and
orientation of the openings of each classroom, the
elevation of the classroom and the wind speed outside
the room. The classroom location on the 3rd Floor is
higher than the 2nd Floor allows the wind to enter the
classroom to get fewer obstacle factors, such as
buildings and surrounding trees, (David, 1975)
resulting in higher air movement in the 3rd-floor
classroom, between 0.01-0.07. m /s, compared to the
air movement of the 2nd-floor measuring point even
though the 3rd-floor classroom has the same size and
design of the opening as the 2nd-floor classroom.
This condition results in the effective temperature at
the 3rd-floor measuring point, which tends to be
lower than the effective temperature of the 2nd Floor.
The results of the analysis of the average effective
temperature per hour on the 3rd Floor, which is in the
warm comfort category, are valued at between 26.3
s.d. 27.1 ° C TE, which is 07.00 to 10.00 WIB and
12.00 to 16.00 WIB. Meanwhile, 11.00 WIB is in the
hot category with a temperature of 27.4 ° C TE. The
lowest average effective temperature per hour on the
2nd Floor is 0.2 ° C TE higher than the 3rd Floor, and
the highest average effective temperature per hour on
the 2nd Floor is 0.02 ° C TE higher than the 3rd Floor.
3.6 Thermal Comfort Analysis of the
Second Model Mom-Wiesebron
Model Second of Thermal comfort analysis according
to the Mom-Weiseborn standard has obtained the
level of comfort according to Table 8. The lowest
effective temperature of the 2nd Floor at the TU2
measuring point at 10:00 WIB of 26.2°C TE is
included in the warm, comfortable category. The
highest effective temperature for the second Floor is
at the TU5 measuring point at 07.00 WIB at 28.4°C,
which is categorized as hot.
Table 8: Second Model Thermal Comfort Level
THERMAL COMFORT LEVEL ON 2ND MODEL ON 2ND FLOOR
RO
O
M
S
MEA
SURI
NG
POI
NT
0
7.
0
0
0
8.
0
0
0
9.
0
0
1
0.
0
0
1
1.
0
0
1
2.
0
0
1
3.
0
0
1
4.
0
0
1
5.
0
0
1
6.
0
0
RO
O
M
1
TU 1
2
6,
8
2
6,
5
2
7,
3
2
6,
4
2
8,
2
2
7,
1
2
7,
5
2
7,
3
2
6,
9
2
6,
8
RO
O
M
2
TU 2
2
7,
6
2
7,
5
2
7,
2
2
6,
4
2
7,
3
2
6,
8
2
7,
1
2
7
2
6,
9
2
7
RO
O
M
3
TU 3
2
7,
2
2
7,
7
2
6,
5
2
6,
4
2
7,
5
2
6,
9
2
7
2
7,
2
2
6,
7
2
7,
1
RO
O
M
4
TU 4
2
7,
3
2
7,
7
2
7,
6
2
6,
7
2
7,
4
2
7,
3
2
7,
1
2
7,
4
2
7,
2
2
7,
2
RO
O
M
5
TU 5
2
8,
3
2
7,
6
2
7,
1
2
6,
9
2
7,
3
2
7,
2
2
7,
5
2
7,
5
2
7,
4
2
7,
3
25
25,5
26
26,5
27
27,5
28
28,5
07.00 08.00 09.00 10.00 11.00 12.00 13.00 14.00 15.00 16.00
AVERAGE PER HOUR
THERMAL COMFORT LEVEL ON 1ST MODEL
2DN FLOOR 3RD FLOOR
The Influence of Building Facade Design on Thermal Comfort in Classroom Case Study: Nasima Elementary School Semarang
65
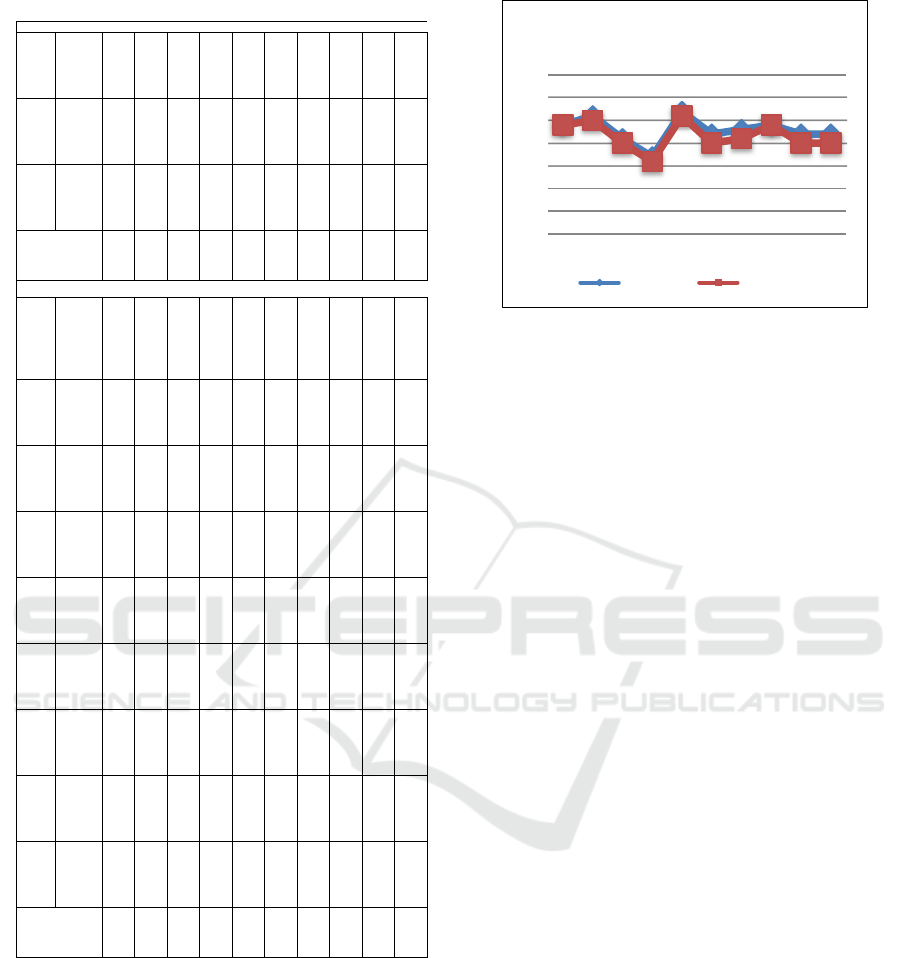
Table 8: Second Model Thermal Comfort Level (cont.).
RO
O
M
6
TU 6
2
7,
2
2
7,
9
2
6,
8
2
6,
8
2
7,
7
2
7,
4
2
7,
5
2
7,
5
2
7,
1
2
7,
6
RO
O
M
7
TU 7
2
7,
7
2
8,
1
2
7,
2
2
7
2
8
2
7,
5
2
7,
1
2
7,
7
2
7,
6
2
7,
4
RO
O
M
8
TU 8
2
7,
4
2
7,
6
2
7,
3
2
7,
2
2
8,
3
2
7,
3
2
7,
5
2
7,
9
2
7,
5
2
7,
3
AVERAGE
2
7,
4
2
7,
6
2
7,
1
2
6,
7
2
7,
7
2
7,
2
2
7,
3
2
7,
4
2
7,
2
2
7,
2
THERMAL COMFORT LEVEL ON 2ND MODEL ON 3RD FLOOR
RO
O
M
S
MEA
SURI
NG
POI
NT
0
7.
0
0
0
8.
0
0
0
9.
0
0
1
0.
0
0
1
1.
0
0
1
2.
0
0
1
3.
0
0
1
4.
0
0
1
5.
0
0
1
6.
0
0
RO
O
M
1
TU 1
2
7
2
6,
6
2
7,
3
2
6,
2
2
8,
2
2
6,
7
2
7,
5
2
7
2
6,
6
2
6,
5
RO
O
M
2
TU 2
2
7,
7
2
7,
6
2
7,
1
2
6,
4
2
7,
3
2
6,
8
2
7
2
7,
1
2
6,
7
2
6,
8
RO
O
M
3
TU 3
2
7,
3
2
7,
7
2
6,
4
2
6,
4
2
7,
3
2
6,
8
2
6,
7
2
7,
2
2
6,
9
2
6,
8
RO
O
M
4
TU 4
2
7,
2
2
7,
8
2
7,
5
2
6,
7
2
7,
5
2
6,
9
2
6,
8
2
7,
4
2
6,
8
2
7
RO
O
M
5
TU 5
2
8,
2
2
7,
6
2
6,
9
2
6,
7
2
7
2
6,
7
2
7,
2
2
7,
5
2
7,
3
2
7,
2
RO
O
M
6
TU 6
2
7
2
7,
3
2
6,
8
2
6,
8
2
7,
5
2
7,
2
2
7,
4
2
7,
5
2
6,
8
2
7,
5
RO
O
M
7
TU 7
2
7,
5
2
8
2
7
2
7,
1
2
7,
9
2
7,
5
2
6,
8
2
7,
5
2
7,
4
2
7,
3
RO
O
M
8
TU 8
2
7
2
7,
3
2
7,
3
2
6,
8
2
8,
2
2
7,
3
2
7,
5
2
7,
8
2
7,
4
2
7,
1
AVERAGE
2
7,
4
2
7,
5
2
7,
0
2
6,
6
2
7,
6
2
7,
0
2
7,
1
2
7,
4
2
7,
0
2
7,
0
Figure 9. Graph of Average Per Hour of Second Model
Thermal Comfort
The effective temperature in the first model
analysis tends to be lower than the second model due
to air movement, which affects the high and low
effective temperature, (Georg, 1994) in the first
model analysis fluctuates according to field data
while in the second model analysis, the air movement
is the same, namely 0.1 m / sec. The lowest average
effective temperature per hour on the 2nd Floor has
the same value as the 3rd Floor, and the highest
average effective temperature per hour on the 2nd
Floor is 0.1 ° C TE higher than the 3rd Floor.
The results of the thermal comfort analysis of the
first and second models show that both models have
an effective temperature in the warm comfort
category and the heat category in the Mom-
Weiseborn thermal comfort standard (Soegijanto,
1998). The analysis of the effective temperature of the
measuring point of the second model is in the
category of heat more than the analysis of the first
model. This condition is due to the constant air
movement in the second model at 0.1 m/s, below the
first model, which has a movement of 0.15-0.24m /s.
4 CONCLUSIONS
The movement of air in the classroom on the 2nd and
3rd Floors is included in the criteria for comfortable
air movement. The air movement in the classroom on
the 3rd Floor is higher than on the 2nd Floor. The
water vapour content in the air in the morning is
higher than in the afternoon, causing the humidity of
the 2nd Floor and 3rd Floor to be high in the morning,
then it tends to fall into the afternoon. The water
vapour content is high in the morning because the
heat of solar radiation received at that time is still low.
The dry temperature for both the second and third
25
25,5
26
26,5
27
27,5
28
28,5
07.00 08.00 09.00 10.00 11.00 12.00 13.00 14.00 15.00 16.00
AVERAGE PER HOUR
THERMAL COMFORT LEVEL ON 2ND MODEL
2DN FLOOR 3RD FLOOR
ICoSTE 2020 - the International Conference on Science, Technology, and Environment (ICoSTE)
66

floors is low in the morning and then rises until the
afternoon. The dry temperature of the 2nd-floor
classrooms tends to be lower than the 3rd-floor
classrooms. This condition is due to the higher
elevation of the 3rd Floor classrooms to receive
longer solar radiation heat. Heat enters the room
through the conduction process, namely through
walls and roofs and through the process of solar
radiation transmitted through windows.
The effective temperature on the 3rd Floor is
lower than the 2nd Floor because of the location of
the 3rd-floor classrooms, which is higher than the 2nd
Floor. This condition allows the movement of wind
entering the classroom to get a minor obstacle factor,
such as other buildings and surrounding trees. The
movement of air that enters the classroom 3rd-floor
classroom is higher than the 2nd Floor.
The results of the thermal comfort analysis of the
first and second models show that both models have
an effective temperature in the warm comfort
category and the hot category in the Mom-Weiseborn
thermal comfort standard. Analysis of the effective
temperature of the measuring point of the second
model is in the hot category more than the analysis of
the first model. This condition is due to the constant
air movement in the second model at 0.1 m /s, below
the first model, which has a movement of 0.15-
0.24m/s. In the analysis of the first and second
models, air movement in the room needs to be
increased to optimize natural ventilation in the room.
A fan can be applied so that the effective temperature
of the room is included in the criteria for optimal
comfort according to Mom-Wiesebron standards.
ACKNOWLEDGEMENTS
The author would like to thank Nasima Elementary
School, Semarang City, Central Java, for allowing me
to carry out this research at his institution. We also
thank the Department of Architecture, Faculty of
Engineering, Diponegoro University for providing
facilities in the data processing.
REFERENCES
Badan Standarisasi Nasional. SNI 03-6572-2001. 2001.
Tata Cara Perancangan Sistem Ventilasi dan
Pengkondisian Udara pada Bangunan Gedung.
Jakarta: Badan Standardisasi Nasional.
Basaria, T. 2005. Menciptakan Kenyamanan Thermal
dalam Bangunan. Jurnal Sistem Teknik Industri.
Becket, HE., Godfrey, JA. 1974. Windows: Performance,
Design, and Installation. New York: Van Nostrand
Reinhold Co.
Boutet, Terry S. 1987. Controlling Air Movement - Manual
for Architects and Builders. New York: McGraw Hill
Book Company.
Ching, Francis D.K. 1997. Arsitektur Bentuk, Ruang, dan
Susunannya. Jakarta : Erlangga.
Egan, M. David. 1975. Concept in Thermal Comfort. New
Jersey: Prentice Hall Inc., Englewood Cliffs.
Lippsmeier, Georg. 1994. Tropenbau Building in the
Tropics, Bangunan Tropis (terj.). Jakarta: Erlangga.
Mangunwijaya. 1997. Fisika Bangunan, Jakarta: Erlangga.
Olgyay, Victor. 1963. Design With Climate - Bioclimatic
Approach to Architectural Regionalism. New York:
Van Nostrand Reinhold.
Snyder, James C. 1994. Pengantar Arsitektur. Jakarta:
Erlangga.
Soegijanto. 1998. Bangunan di Indonesia dengan Iklim
Tropis Lembab Ditinjau dari Aspek Fisika Bangunan,
Jakarta: Dikti, Departemen Pendidikan dan
Kebudayaan.
The Influence of Building Facade Design on Thermal Comfort in Classroom Case Study: Nasima Elementary School Semarang
67
