
The Validation Modelling of Air Movement to Measure Thermal
Comfort in Building Model
Augi Sekatia
1
, Erni Setyowati
1
and Gagoek Hardiman
2
1
Doctoral Program of Architecture and Urbanism, Universitas Diponegoro,Semarang, Indonesia
2
Department of Architecture, Faculty of Engineering, Universitas Diponegoro, Semarang, Indonesia
Keywords: Thermal comfort, Hot wire Anemometer, Instruments, Validation.
Abstract: Discussing about passive cooling buildings cannot be separated from discussing thermal comfort, especially
in tropical climates. Natural Ventilation is one of an answer to the energy conservation issues. NV can also
help to achieve thermal comfort in a building. This study examines how air velocity affects indoor thermal
comfort in a building model with dimensions 2.5 m x 2.5 m that uses natural ventilation. The research was
conducted by taking 100 indoor air velocity (m/s) data and temperature (°C) from the two hot-wire
anemometer (KRISBOW KW0600653 and LUTRON AM-4234SD) instruments with an interval of 5
minutes for each data. The data statistically analyzed by using linear regression modelling of SPSS 24 version
software. The 100 data obtained, for indoor air velocity readings, the two brands have correlation of 75%,
while for temperature readings is 92.6%. The building didn’t achieve the thermal comfort because of
ventilations location. The purpose of this research is to prove that without natural ventilation especially the
air velocity, thermal comfort can’t be achieved by using LUTRON AM-4234SD hot-wire anemometer and
want to validate the reading values to KRISBOW KW0600653 or vice versa more easily with the equations
found in this paper.
1 INTRODUCTION
Nowadays, buildings with an energy-saving concept
is a primary consideration. This concept follows the
Green Architecture and Sustainable Design concepts.
Zhang et al (Zhang & Lin., 2020) stated that
architecture and its construction play a big role in
environmental damage and increased carbon dioxide
emissions. Therefore, the architecture field should
attempt to achieve thermal comfort in buildings by
calculating energy usage and the Green concept. To
improve understanding of thermal comfort in rooms,
one should calculate the thermal comfort standard and
consider the ventilation model of thermal comfort and
thermal adaptation from psychology, physiology, and
behavior of users (Xia, et al., 2020). The new
challenge for designers and architectural researchers
is to create flexible built environments according to
the Energy Efficiency concept (Lau, et al.,
2020).Natural ventilation is a method to achieve
thermal comfort in a room without using much
energy. It is proven in previous studies that air
velocity in a room can reduce the standard effective
temperature so that thermal comfort in the room can
be achieved (Sekati, et al., 2018)(Sekatia, et al.,
2019).
The air velocity measurement in a room should be
conducted using a measuring instrument of hot wire
anemometer. Hot wire anemometer is an essential
instrument for measuring laminar, transition, and
turbulent flows because of its accurate signal
interpretation and simplicity of use. This
measurement technique is an indirect method with an
output of tension signals. Therefore, calibration is a
critical way to measure speed effectively and
accurately (Ozahi, et al., 2010). Hot wire anemometer
also has an advantage of small probe sizes and
frequency responses that enable speed fluctuation in
a detectable high frequency (Benjamin & Roberts,
2001). Hence, for air velocity measurement in a room
with substantially small airflow, a hot wire
anemometer is required compared to traditional
anemometers that can only be used outside of the
room.
Hot wire anemometer’s brands are massive in the
market. The most used brands are KRISBOW
KW0600653 and LUTRON AM-4234SD. Both
brands have the same resolution. Therefore, this study
Sekatia, A., Setyowati, E. and Hardiman, G.
The Validation Modelling of Air Movement to Measure Thermal Comfort in Building Model.
DOI: 10.5220/0010790900003317
In Proceedings of the 2nd International Conference on Science, Technology, and Environment (ICoSTE 2020) - Green Technology and Science to Face a New Century, pages 25-30
ISBN: 978-989-758-545-6
Copyright
c
2022 by SCITEPRESS – Science and Technology Publications, Lda. All rights reserved
25
aimed to validate both instruments, in which one
instrument, i.e., KRISBOW KW0600653 had been
calibrated and acquired a calibration certificate from
the KAN (National Accreditation Committee). The
validation was carried out in a model building with a
size of 2.5m x 2.5m in Semarang City. The study
results are two equation models to validate both
instruments and measure thermal conditions in the
model building.
2 RESEARCH METHOD
2.1 Climate Condition
Semarang City is geographically located at 109° 35‘
– 110° 50‘ East Longitude and 6° 50’ – 7° 10’ South
Latitude with an area of 373.70 km2. According to
the geographic site, it is affected by monsoons'
tropical climate with two kinds of weather, i.e., dry
weather from April – September and rainy weather
from October – March with an average annual
humidity of 77% (Pemerintah Kota Semarang, 2015).
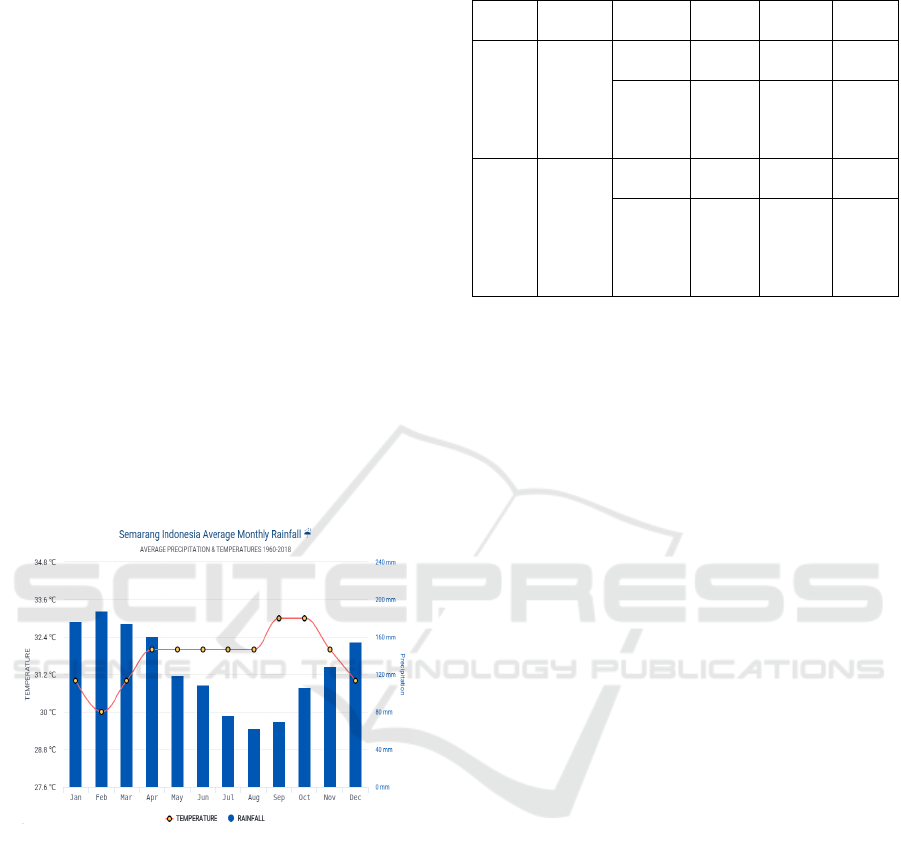
Figure 1: Semarang Average Precipitation and Temperature
1960 – 2018 (Hikersbay, 2020)
Figure 1 shows that the average temperature of
Semarang City ranged from 30°C to 33.2°C. It was
caused by the geographic condition of Semarang
City, in which most of the areas are lowlands and
beaches. Rainfall in Semarang City was rather high,
ranging from 80 mm to 180 mm. The annual rainfall
rate of Semarang City was 1528 mm. January,
February, and March were months with the highest
rainfall.
Table 1: Specifications of measurement instruments
Instrum
en
t
Manu
facture
r
Para
mete
r
Reso
lution
Range
Accu
racy
Hot
wire
Anemo
meter
(KW06
00653)
KRISBO
W,
China
Air
velocity
0.01 m/s
0.1 -
25.0 m/s
± 5% ±
0.1m/s
Air
temperat
ure
0.1°C 0 – 50°C ± 1.0°C
Hot
wire
Anemo
meter
(AM-
4234S
D)
LUTRO
N, China
Air
velocity
0.01 m/s
0.2 -
35.0 m/s
± 5% ±
0.1m/s
Air
temperat
ure
0.1°C 0 – 50°C ± 0.8°C
The resolutions of the KRISBOW hot wire
anemometer (KW0600653) in measuring air velocity
and temperature are 0.01 m/s and 0.1°C. It is the same
with the LUTRON hot wire anemometer (AM-
4234SD) (see Table 1).With the same resolution, both
instruments' validation is necessary to be discovered
to ease researchers in reading the measurement result.
Data were analyzed statistically using the linear
regression software of SPSS version 24 to find the
validation equation model between the KRISBOW
hot wire anemometer (KW0600653) and LUTRON
hot wire anemometer (AM-4234SD). The model
building's thermal condition was analyzed using
Szokolay’s standard (Szokolay, 2001) and the
standard SNI 03-6572-2001 (SNI, 2010).
2.2 Data Collection and Measurements
In obtaining a reading validation of measurement
results, 100 data were obtained on a model building
with a size of 2.5m x 2.5m with two different
variables, i.e., air velocity and temperature. Each data
was taken with a 5-minute interval. Data were taken
using two hot wire anemometer instruments with
different brands, i.e., KRISBOW KW0600653 and
LUTRON AM-4234SD (see Figure 2 and 3) at the
same time and same height of 1.1m from the floor
(Brager & De Dear, 1998). The ventilation height on
the model building was constructed on 1.6m from the
floor.
ICoSTE 2020 - the International Conference on Science, Technology, and Environment (ICoSTE)
26
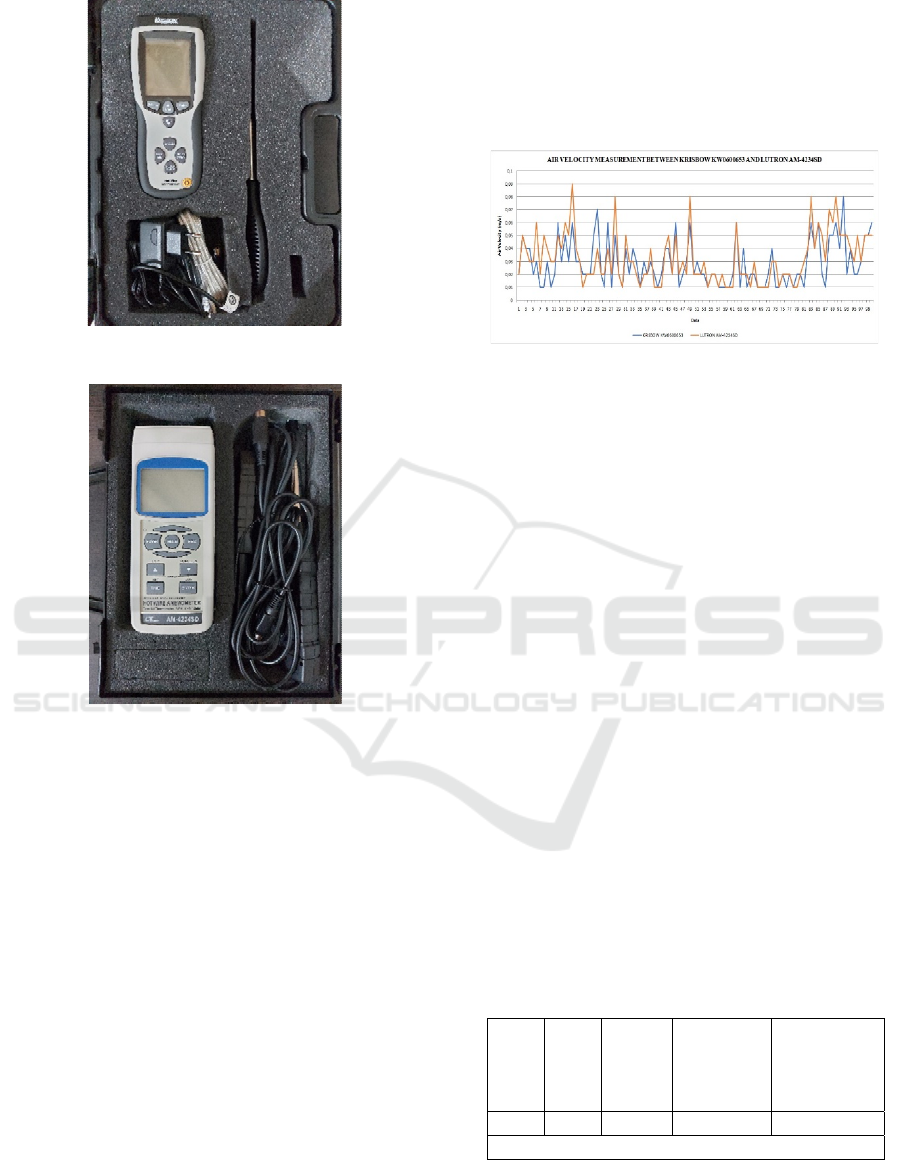
Figure 2: KRISBOW KW0600653
Figure 3: LUTRON AM-4234SD
The KRISBOW KW0600653 hot wire anemometer
had been calibrated and acquired a calibration
certificate no. S. 19 012 115 SNI ISO/IEC-17025-
2008 from the KAN (National Accreditation
Committee). KAN is a national institution in the
research instrument accreditation and calibration
field.
3 RESULTS
3.1 Air Velocity (M/S)
The form should be completed and signed by one
author on behalf of all the other authors. Air velocity
highly affects the standard effective temperature
(SET) reduction (Sekatia, et al., 2018). Szokolay
(Szokolay, 2001) stated that the air velocity comfort
zone in tropical climate ranged between 0.2 m/s – 0.8
m/s. From the measurement conducted on the model
building, obtained the average air velocity from both
hot wire anemometers ranging between 0.028 m/s to
0.032 m/s. Therefore, the model building's air
velocity didn’t meet the comfort zone standard in
tropical climate because it was under 0.2 m/s. It was
possible because there was ventilation on top of the
building shaded by the model building’s eaves.
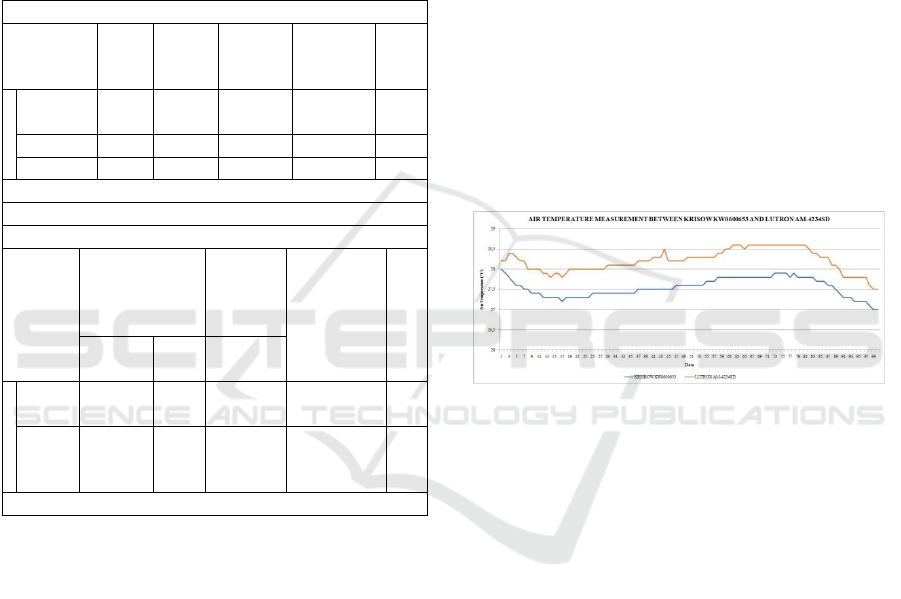
Figure 4: Air Velocity measurement between KRISBOW
KW0600653 and LUTRON AM-4234SD
From Figure 4, it is discovered that both instruments
only had a slight difference in air velocity reading.
LUTRON AM-4234SD tended to read more
sensitively and higher than KRISBOW KW0600653.
Nevertheless, KRISBOW KW0600653 often read the
air velocity higher than LUTRON AM-4234. Hence,
from the data obtained, a statistic test using linear
regression was carried out to validate both
instruments into an equation so that the
LUTRONAM-4234SD’s reading result could be
represented into the KRISBOW KW0600653’s
reading result where this instrument had been
calibrated.
3.2 Validation and Regression Model of
Air Velocity between KRISBOW
KW 0600653 and LUTRON
AM-4234SD
The first regression model shows the air velocity
reading correlation of both hot wire anemometers,
i.e., KRISBOW KW0600653 and LUTRON AM-
4234SD.
Table 2: Model Summary Regression 1
Model R R
Sq
uar
e
Adjusted
R
Square
Std. Error o
f
the
Estimat
e
1 .750a .562 .558 .01165
a. Predictors: (Constant), LUTRON VEL
In Table 2, R is the correlation coefficient. It can be
interpreted that the correlation coefficient of air
velocity on KRISBOW and LUTRON hot air
The Validation Modelling of Air Movement to Measure Thermal Comfort in Building Model
27
anemometers was 0.750, meaning that the
relationship between air velocity reading of
KRISBOW and LUTRON hot wire anemometers was
75%. R square is called the Determination
Coefficient. From Table 1, it is discovered that the R
square value was 0.562, meaning that 56.2% of the
variations occurred on KRISBOW KW 0600653’s air
velocity reading was caused by LUTRON AM-
4234SD’s air velocity reading, while the rest was
unexplainable.
Table 3: Regression Model 1
a.
Model Sum o
f
Square
s
df Mean
Square
F Sig.
1
Regressio
n
.017 1 .017 125.837 .000b
Residual .013 98 .000
Total .030 99
a. Dependent Variable: KRISBOW VEL
b
. Predictors: (Constant), LUTRON VEL
b
.
Model Unstandardized
Coefficients
Standar
dized
Coeffi
cients
t Sig.
B Std.
Erro
r
Beta
1
(Const
ant)
.007 .002 2.996 .003
LUTR
ON
VEL
.682 .061 .750 11.218 .000
a. Dependent Variable: KRISBOW VEL
In Table 3.a., it is discovered that the probability or
Sig value was 0.00, where Sig value <0.05 means that
the regression model is accepted. Table 3.b. shows a
constant of 0.007 with air velocity reading coefficient
of hot wire anemometer LUTRON of 0.682. From
this regression result, obtained an equation to validate
the air velocity reading of KRISBOW KW0600653
against LUTRON AM-4234SD as follows:
𝐾𝑅𝐼𝑆𝐵𝑂𝑊 𝑉𝐸𝐿 0.007 0.682 𝐿𝑈𝑇𝑅𝑂𝑁 𝑉𝐸𝐿 (1)
Where KRISBOW Vel is the air velocity reading in
hot wire anemometer KRISBOW KW 0600653 (m/s),
and LUTRON Vel is the air velocity reading inhot
wire anemometer LUTRON AM-4234SD (m/s). The
equation above eased air velocity reading in hot wire
anemometer LUTRON Am-4234SD to obtain a
validated value in KRISBOW KW 0600653, which
had been calibrated.
3.3 Air Temperature (°C)
The temperature shown in hot wire anemometers
should not be used to measure thermal comfort in a
room. Thermal comfort can be determined using the
standard effective temperature. SET is an imaginary
environment temperature in 50% RH, <0.1 m / s (20
fpm) in the average air velocity, where the total heat
loss from imaginary occupant skin with an activity
rate of 1.0 met and clothing rate of 0.6 clo, equals with
the actual environment wearing the actual clothes and
conducting the actual activity [14]. However, in
Indonesia, SNI 03-6572-2001 regulates the air
temperature declared as comfortable in a room,
ranging between 25.8°C to 27.1°C[12]. From the
measurement conducted on the model building,
obtained an average air temperature ranging between
27.54°C to 28.2°C. It was influenced by the small
amount of air velocity entering the model building;
thus, the air temperature did not meet the comfort
zone according to SNI 03-6572-2001.
Figure 4. Air temperature measurement between
KRISBOW KW0600653 and LUTRON AM-4234SD
It can be seen in Figure 4 that the air temperature
reading in the model building only had a slight
difference, ranging from 0.1°C to 0.7°C. Again,
LUTRON AM-4234SD had a higher reading
tendency than KRISBOW KW0600653. It proves the
possibility of LUTRON AM-4234SD having higher
sensitivity. The authors conducted a linear regression
statistic test to validate and formulate an equation for
both instruments from obtained data.
3.4 Validation and Regression Model of
Air Temperature between
KRISBOW KW 0600653 and
LUTRON AM-4234SD
The second regression model shows the air
temperature reading correlation of both hot wire
anemometers, i.e., KRISBOW KW0600653 and
LUTRON AM-4234SD
ICoSTE 2020 - the International Conference on Science, Technology, and Environment (ICoSTE)
28

Table 4. Model Summary Regression 2
Model Summary Regression 2
Model R R Square
Adjusted
R
Square
Std. Erro
r
of the
Estimate
1 .926a .858 .856 .08727
a. Predictors: (Constant), LUTRON TEMP
In Table 4, it can be interpreted that the correlation
coefficient of air temperature on KRISBOW and
LUTRON hot air anemometers was 0.926, meaning
that the relationship between air temperature reading
of KRISBOW and LUTRON hot wire anemometers
was 92.6%. From Table 4, it is discovered that the R
square (determination coefficient) value was 0.858,
meaning that 85.8% of the variations occurred on
KRISBOW KW 0600653’s air temperature reading
was caused by LUTRON AM-4234SD’s air
temperature reading.
Table 5. Regression Model 2
a.
Model Sum
of
Squar
es
df Mean
Square
F Sig.
1
Regressi
on
4.502 1 4.502 591.128.000b
Residua
l
.746 98 .008
Total 5.248 99
a. Dependent Variable: KRISBOW TEMP
b
. Predictors: (Constant), LUTHRON TEMP
b
.
Model Unstandardized
Coefficients
Standardi
zed
Coefficie
nts
t Sig.
B Std.
Erro
r
Beta
1
(Consta
nt)
6.123 .881 6.
9
4
9
.000
LUTHR
ON
TEMP
.759 .031 .926 2
4.
3
1
3
.000
a. Dependent Variable: KRISBOW TEMP
In Table 5.a., it is discovered that the Sig value
was 0.00, where Sig value <0.05 means that the
regression model is accepted. Table 5.b. shows the
constant of 6.123 with air temperature reading
coefficient of hot wire anemometer LUTRONAM-
4234SD of 0.759. From this regression result,
obtained an equation to validate the air temperature
reading of KRISBOW KW0600653 against
LUTRON AM-4234SD as follows:
𝐾𝑅𝐼𝑆𝐵𝑂𝑊𝑇𝐸𝑀𝑃 6.123
0.759 𝐿𝑈𝑇𝑅𝑂𝑁𝑇𝐸𝑀𝑃 (2)
Where KRISBOW Temp is the air temperature
reading in hot wire anemometer KRISBOW KW
0600653 (°C), and LUTRON Temp is the air
temperature reading in hot wire anemometer
LUTRON AM-4234SD (°C). With the equation
above, air temperature validation in hot wire
anemometer LUTRON Am-4234SD against
KRISBOW KW 0600653 would be easier.
4 CONCLUSIONS
The measurement and analysis data above, it can be
concluded that the model building’s thermal
condition was not in the comfort zone of tropical
climate; hence, not achieving thermal comfort in the
building. It was caused by the open natural ventilation
height. This fault caused small airflow, which could
not reduce the air temperature in the model building.
Air velocity and temperature reading validations on
hot wire anemometer LUTRON AM-4234SD against
KRISBOW KW0600653 from two regression models
resulted in two equations, i.e.,
(1) 𝐾𝑅𝐼𝑆𝐵𝑂𝑊𝑉𝐸𝐿 0.007
0.682 𝐿𝑈𝑇𝑅𝑂𝑁𝑉𝐸𝐿,
(2) 𝐾𝑅𝐼𝑆𝐵𝑂𝑊𝑇𝐸𝑀𝑃 6.123
.759 𝐿𝑈𝑇𝑅𝑂𝑁𝑇𝐸𝑀𝑃 .
Both equations eased the measurement using hot wire
anemometer LUTRON AM-4234SD and validate the
reading result intohot wire anemometer KRISBOW
KW0600653 calibrated by the KAN. This research
can help researchers to make validation of the same
instrument without have to calibrate all the
instruments again to the calibration committee. The
researchers can follow this research method to
validate their instruments as well.
The Validation Modelling of Air Movement to Measure Thermal Comfort in Building Model
29

ACKNOWLEDGEMENTS
The authors express gratitude to the Indonesian
Ministry of Education and Culture for the Doctoral
Research grant number 225-23/UN7.6.1/PP/2020
(DIKTI). The authors also thank all staff of the
Architecture Department of Universitas Diponegoro
who helped this study implementation.
REFERENCES
A. Sekatia, E. Setyowati, G. Hardiman, 2018, Thermal
Condition of Passive Cooling System in Bogor
Cathedral Church, IOP Conference Series Earth
Environment Science, Vol. 213.
A. Sekatia, B. I. R. Harsritanto, E. Setyowati, G. Hardiman,
2018, Thermal Condition in Semarang Cathedral’s
Passive Cooling System, AIP Conference Proceedings,
Vol. 1977, No. 1.
A. Sekatia, E. Setyowati, G. Hardiman, B. Harsritanto,
2019, The Effect of Low Ventilation to Thermal
Condition in Cathedral Church, Proceedings of the 18
th
International Conference on Sustainable Environment
and Architecture, pp. 1–10.
ANSI/ASHRAE, 2017, ANSI/ASHRAE Standard 55-2017 :
Thermal Environmental Conditions for Human
Occupancy, ASHRAE Inc.
E. Özahi, M. Ö. Çarpinlioǧlu, M. Y. Gündoǧdu, 2010,
Simple Methods for Low Speed Calibration of Hot-
Wire Anemometers, Flow Measurement and
Instrumentation, Vol. 21, No. 2, pp. 166–170.
G. S. Brager, R. J. De Dear, 1998, Thermal Adaptation in
the Built Environment: A Literature Review,” Energy
Buildings, Vol. 27, No. 1, pp. 83–96.
S. F. Benjamin, C. A. Roberts, 2001, Measuring Flow
Velocity at Elevated Temperature with a Hot Wire
Anemometer Calibrated in Cold Flow, International
Journal of Heat and Mass Transfer, Vol. 45, No. 4, pp.
703–706.
S. S. Y. Lau, J. Zhang, Y. Tao, 2019, A Comparative Study
of Thermal Comfort in Learning Spaces using Three
Different Ventilation Strategies on a Tropical
University Campus, Building and Environment, Vol.
148, pp. 579–599.
S. V Szokolay, 1986, Climate Analysis Based on the
Psychrometric Chart, International Journal Ambient
Energy, Vol. 7, No. 4, pp. 171–182.
S. Zhang, Z. Lin, 2020, Predicted Mean Vote with Skin
Temperature from Standard Effective Temperature
Model, Building and Environment, Vol. 183.
Y. Xia, W. Lin, W. Gao, T. Liu, Q. Li, A. Li, 2020,
Experimental and Numerical Studies on Indoor
Thermal Comfort in Fluid Flow: A Case Study on
Primary School Classrooms, Case Studies in Thermal
Engineering, Vol. 19.
ICoSTE 2020 - the International Conference on Science, Technology, and Environment (ICoSTE)
30
