
Techno-economic Feasibility Analysis of Replacement of Existing
Power and Steam Generators at Arun LNG
Bondan Adi Nugroho, Dijan Supramono, and Widodo Wahyu Purwanto
Department of Chemical Engineering, Engineering Faculty, University of Indonesia, Indonesia
Keywords: Power Plant, Steam Generator, Tariff, Fuel Gas, Availability.
Abstract: Demands for electricity and steam at the Arun LNG Refinery Gas Processing Facility are 158,400,000
kWh/year and 180 tons/hour of steam produced by 3 (three) units of Gas Turbine Generators (GTGs) and 3
(three) units of Heat Recovery Steam Generators (HRSGs) at the generating unit at Arun Gas Processing
Plant. The problem with electricity and steam generations at present is the high gaseous fuel requirement,
namely 13.14 MMSCFD to process 30 MMSCFD of gas sold. The scarce availability of spare parts and
several time operation interruptions (blackout) are also problems in the existing plant. The purpose of this
research is to build a new generation unit at the separated from the existing GTGs and HRSGs with more
efficient electricity generation and steam generation units and high level of availability. Replacement is
carried out based on analysis of various generation alternatives, namely new GTG units & HRSG and boiler
unit, new Gas Engine Generator (GEG) units & HRSG and a boiler unit, and connection to PLN (State
Electricity Company) electricity network + a boiler unit. The results show that the installation of new GTG
units & HRSG and a new boiler would require the gas fuel of 12.88 MMSCFD, which is 0.26 MMSCFD less
than that of existing generations, and offer the least electricity generation tariff of $ 0.221/kWh and steam
generation tariff of $ 0.0019/ton using cash flow economic method. The installation can support the operation
and gas production activities at the ArunGas Processing Plant until the end of contract for the next 19 years.
1 INTRODUCTION
In carrying out its activities, the Arun Gas Processing
Plantconsumes 158,400,000 kWh of electricity/year
and 180 tons of steam / hour. The Arun power plant
managed by PertaArun Gas (PAG) has 8 GTG units,
with a capacity of 22 MW each installed in 1972. Six
of the GTGs have been equipped with HRSG to
produce steam. Currently operating, to meet plant
requirements or utility demand, three GTG units are
operated for gas processing and regasification needs.
In operating the three GTG + HRSGs, 9.64
MMSCFD is needed for GTG and 3.5 MMSCFD for
HRSG as supplementary firing. In fulfilling the
electricity and steam generation, 13.14 MMSCFD of
gas consumed as fuel to meet the demand for
electricity and steam at Arun Gas Processing Plant is
very large compared to gas sales of 30 MMSCFD.
The low availability of power and steam is also a
problem in itself, indicated by several times of black
out.
In the present research, the need for gas
processing operations at the Arun Gas Processing
Plant is expected for the next 19 years (block contract
ends), the replacement of the current GTG and HRSG
with replacement units to meet electricity and steam
needs efficiently and with a high level (Ganapathy,
1996) of availability so that Gas and Condensate
production in Block B Field and NSO Field can take
place.
2 THEORETICAL FRAMEWORK
2.1 GTG Conditions Benchmarking
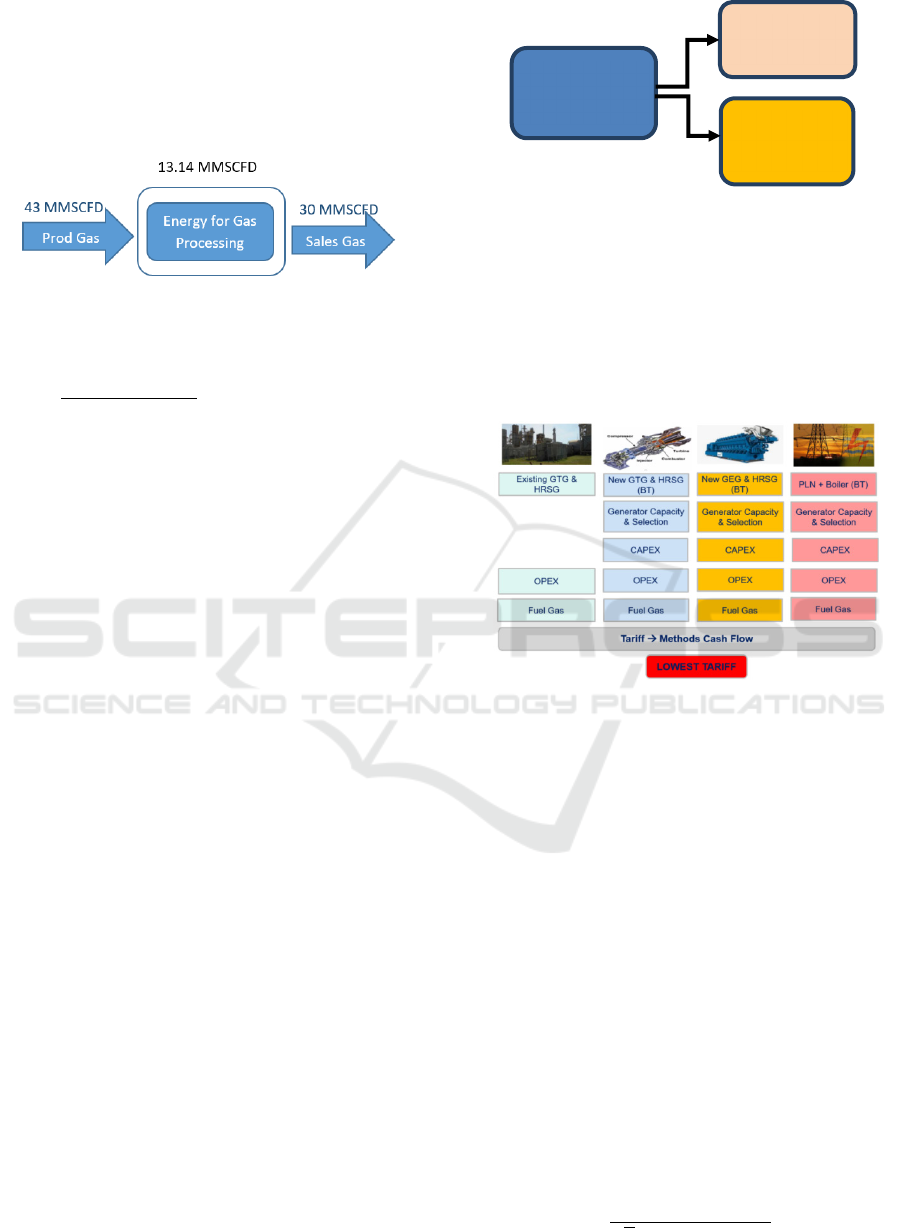
Figure 1 shows a diagram of the utility fuel gas
requirements used for gas processing at the Arun Gas
Processing Plant.In comparison, the JOB Tomori
Sulawesi field requires 6 MW of electricity to
produce 340 MMSCFD, while processing gas at Arun
Gas Processing Plantrequires 2.5 MW of electricity to
process 20 MMSCFD of gas. However, an absolute
comparison cannot be used because the gas
processing facility at the plant is very large in size,
12
Nugroho, B., Supramono, D. and Purwanto, W.
Techno-economic Feasibility Analysis of Replacement of Existing Power and Steam Generators at Arun LNG.
DOI: 10.5220/0010786500003317
In Proceedings of the 2nd International Conference on Science, Technology, and Environment (ICoSTE 2020) - Green Technology and Science to Face a New Century, pages 12-16
ISBN: 978-989-758-545-6
Copyright
c
2022 by SCITEPRESS – Science and Technology Publications, Lda. All rights reserved
which was designed for 450 MMSFD of gas/train but
only processes 30 MMSCFD of sold gas at present.
Therefore, in order to reduce the amount of electricity
and steam generated, it is necessary to replace the
oversized equipment into equipment that suits the
current gas production needs
.
Figure 1. Energy requirement for gas processing
The ratio of energy requirement to gas sold is
13.14 𝑀𝑀𝑆𝐶𝐹𝐷
30 𝑀𝑀𝑆𝐶𝐹𝐷
100% 43.8 %
2.2 Heat Rate Comparison
With a fuel gas gross heat value (GHV) specification
of 1074,774 BTU/SCF to produce power demand of
20,600 kWh requiring gas fuel of 9.46 MMSCFD,
then the heat rate of the Gas Turbine Generator is
18.503 BTU/kWh. This is much larger than the GTG
GE Frame-3 specification GHV which is 3,113
kcal/kWh or 12,345.12 BTU/kWh. In other words,
the existing GTG is not efficient.This paper will
discuss tariffs of power and steam generations in
which for the need of very large steam, Combine Heat
and Power (CHP) option is feasible to apply. This
paper includes an alternative use of electricity from
PLN which will be combined with a boiler to find out
whether this alternative is cheaper than the
conventional CHP.
2.3 Separation from Existing GTG
Arun Power Plant generates 30.6 MW with a Fuel
Consumption of 14.5 MMSCFD. The power
generated is intended for gas processing and
regasification with load distribution shown in Figure
2.Therefore, replacing the existing GTG for gas
processing also means separating the generation
system to be built from the Arun Power Plant units
and also separating the load distribution network such
as substation and distribution cables. However,
because steam is required and can be created in a
HRSG, a new unit must be equipped with steam
generation unit either as a new HRSG unit or a boiler
to produce 180 tons/hour of steam.
Figure 2. Load Distribution at Arun LNG Plant
The alternative generation utilities chosen were a
new GTG and HRSG unit + Boiler, a new Gas Engine
Generator (GEG) and HRSG + Boiler, and PLN
electricity + Boiler. Figure 3 shows calculation
aspects for technoeconomic calculation. From the
economics point of view and availability analysis, the
best option is chosen among those alternatives.
Figure 3. Generator Replacement Methods.
3 RESEARCH METHODS
Figure 3 represents flow for selecting alternative
generator with the smallest tariff to be chosen to
replace the existing power plant. Steps of calculations
are as follows.
3.1 Find New Generator Capacity
From the data on the total load of Arun LNG Plant
equipment can be found:
1. Continuous Load (kWh)= 20,600 kWh
2. Total Peak Load (kWh)
Peak Load (kW) =
x.Continuous(kW)+y.Intermittent(kW)+z.Sta
ndby (kW)
(1)
3. Biggest motor starting
𝐼
𝑘𝑊
1000
√
3 𝑉𝜂𝑐𝑜𝑠𝜑
(2)
Power Plant
Unit-90 30.6
MW+ 180 TPH
Steam
Regasification
10 MW
Gas Processing
20.6 MW + 180
TPH Steam
Techno-economic Feasibility Analysis of Replacement of Existing Power and Steam Generators at Arun LNG
13

𝐼
600% 𝐼
(3)
where:
𝐼
=Motor starting current (A)
𝐼
=Motorrated current on full load(A)
η =Motorrated efficiency on full load(%)
cos φ=Motorrated power factor on fullload(%)
V=Ratedvoltage(V)
𝑘𝑊
=RatedkW (kW)
3.2 Select Generators
Table 1 shows a comparison of the efficiency,
capacity, availability and performance of each
Combine Heat & Power (CHP) technology
currently. With the availability of new generators set
at 99%, from the data in Table 1, the availability of
a GTG unit is 72% - 99%. By taking the average
availability value of 85.5%, it takes more than one
GTG unit to produce 99% availability. The similar
case for GEG. With 86 - 98 % availability, it needs
more than one GEG unit to achieve 99%.
3.3 Calculate CAPEX and OPEX
CAPEX can be calculated using Table 1 or by market
survey. OPEX can also use Table 1 or use general
Operation and Maintenance (O&M) cost for power
generation such as time to Major Inspection.
PLN tariff can be calculated using this formula
𝑎𝑏
𝑐 𝑒
𝑎𝑏
𝑓
(4)
Where
a is the price of non-subsidized electricity
b is the premium customer prices
c is the peak load
d is the peak load price
e is the duration of the peak load
f is the total hours outside peak load
Table 1. Comparison of CHP Technology Parameters, Cost,
and Performance
Source: Catalog of CHP Technologies, EPA, 2017
3.4 Calculate Fuel
From Specification of Generator with current Gross
Heat Value, fuel gas consumption for Power
Generation of Arun LNG Plant can be found. Exhaust
gas from power generation can be used to produce
steam at HRSG with HYSYS simulation (Paoli,
2009). Boiler needs to satisfy steam requirement
at 180 tons/h with 10.5 kg/cm
2
pressure (Oland,
2004).
3.5 Calculate Tariff
Tariff calculation needs basis data to obtain weighted
average cost of capital (wacc). From wacc value,
investment rate of return (irr) on free cash flow can be
determined
4 RESULTS AND DISCUSSION
4.1 Generator Capacity
From Peak Load and Motor Starting calculation,
generator capacity can be summarized in Table 2 and
for Arun LNG Plant load is 20,939.81kW.
Table 2. Dedicated Load Generator Capacity
No.
Description kW
1 Peak Load 20,939.81
2 Load during motor starting 17,926.23
Technology ReciprocatingEngine GasTurbine
ElectricEfficiency(HHV) 27‐41% 5‐40%
TotalEfficiencyCHP(HHV) 77‐80% near80%
EffectivePowerEfficiency 75‐80% 75‐77%
SpecificCapacity 0.005‐10
0.5‐uptohundred
MW
InstallationCHPPrice($/kWe) 1,500‐2,900 670‐1,100
Non‐fuelO&Mprice($/kWhe) 0.009‐0.025 0.006to0.01
Availibility 96‐98% 72‐99%
Timetooverhaul 30,000‐60,000 >50,000
FuelPressure(psig) 1‐75 n/a
FuelGas
NaturalGas,biogas,
LPG,sourgas,waste
industrialgas,
manufacturedgas
all
OutputThermal
RoomHeater,Hot
water,chiller,LP
steam
processsteam,
enviromentheater,
hotwater,water
cooler
ICoSTE 2020 - the International Conference on Science, Technology, and Environment (ICoSTE)
14
4.2 Fuel Consumption
4.2.1 Two Units of New GTG + HRSG
With 2 units of GTG running simultaneously, each
unit of GTG carries 50% of the load. In this scheme,
the ArunGas Processing Plant burden, both dedicated
and sharing, will be taken by the new GTG units with
capacity of 20,600 kW each.In the market, a generator
capacity that is close to 20,600 kW is a GTG brand
LM2500 DLE with a capacity of 21.8 MW chosen
(GE Power, 2019). Fuel Gas Consumption can be
calculated by HYSYS Simulation.From the
simulation obtained, one unit of LM2500 DLE with
ambient air flow input of 123 tons/h can produce a
generation load (net power) of 10,300 kW with fuel
gas consumption of 2.51 MMSCFD. The exhaust gas
of this generation is hot with a temperature of 539
o
C
which will be used to produce steam in a HRSG. The
steam capacity generated in the HRSG is 24.34 tons/h
per unit. Net efficiency GTG from simulation is 40.29
% which is higher from the specification because it
neglects other losses like mechanical losses.Due to
the demand for steam at the Arun Gas Processing
Plant as much as 180 tons/h, an additional boiler unit
is required to meet the demand for steam.
With 2 units of GEG running simultaneously,
each unit of GTG will carry 50% of the load. In this
scheme, Arun LNG Plant burden, both dedicated and
sharing, will be taken by the new GEG units with a
capacity of 10,300 kW each.In the market, a generator
capacity close to 10,300 kW is a GTG brand
Jenbacher J920 flextra with a capacity of 10.4 MW
chosen. Fuel Gas Consumption can be calculated with
HYSYS Simulation by using 2 unit J920 Flextra with
ambient air flow input of 10.39 tons/h, the units can
produce a generation load (net power) of 5,000 kW
with fuel gas consumption of 1.19 MMSCFD. The
exhaust gas is hot (609
o
C) which will be used to
produce steam in a HRSG. The steam capacity that
can be generated in HRSG is 3.001 tons/h per unit.
Due to the demand for steam at Arun Plant gas
processing facility of 180 tons/h, an additional boiler
unit is required.
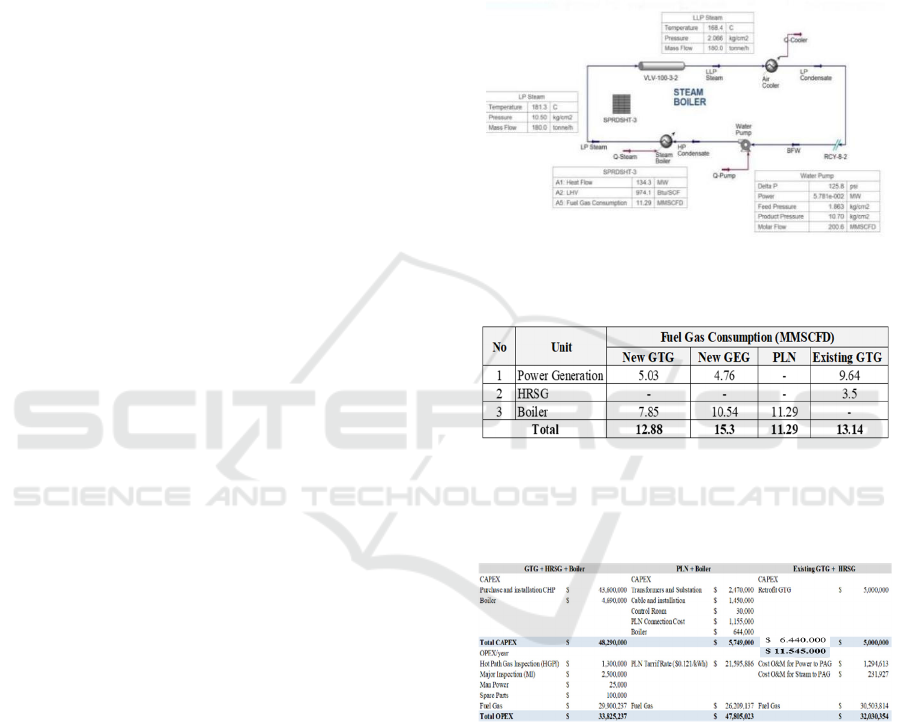
4.2.2 PLN + Boiler
Using PLN power, grid installation capacity for peak
load is 20,939.81 kWh. With premium costumer, the
power comes from 150 kV transmission line from two
sub-stations in order to maintain high availability, all
steam will be produced by boilers. The schematic
diagram of boiler system in this alternative is shown
in Figure 4. Fuel Required is 11.29 MMSCFD. From
calculations and simulations, fuel gas consumption in
each alternative to produce 20,600 kW power and 180
tons/h of steam is as shown in Table 3.For economic
evaluation based on fuel gas consumption, GEG
alternative using GEG + HRSG+ Boiler uses 15.3
MMSCFD, which is higher than existing generation
of 13.14 MMSCFD in addition to CAPEX for new
unit. So, GEG alternative will be taken out from
alternative option.
Figure 4. HYSYS Simulation of Boiler
Table 3. Fuel Gas Comparison for Alternative Replacement
4.3 CAPEX and OPEX Calculation
Table 4. CAPEX and OPEX Comparison for Alternative
Replacement
Table 4 shows details of Capex and Opex as
alternatives. Hot gas path inspection of new GTG will
be carried out every 25,000 hours or 2.89 years and
major inspections will be carried out every 50,000
hours or 5.7 years. For daily operation of the GTG +
HRSG and Boilers, only manpower is needed to
perform visual inspections at a budget of $
25,000/year and spare parts is allocated $
100,000/year.
Techno-economic Feasibility Analysis of Replacement of Existing Power and Steam Generators at Arun LNG
15
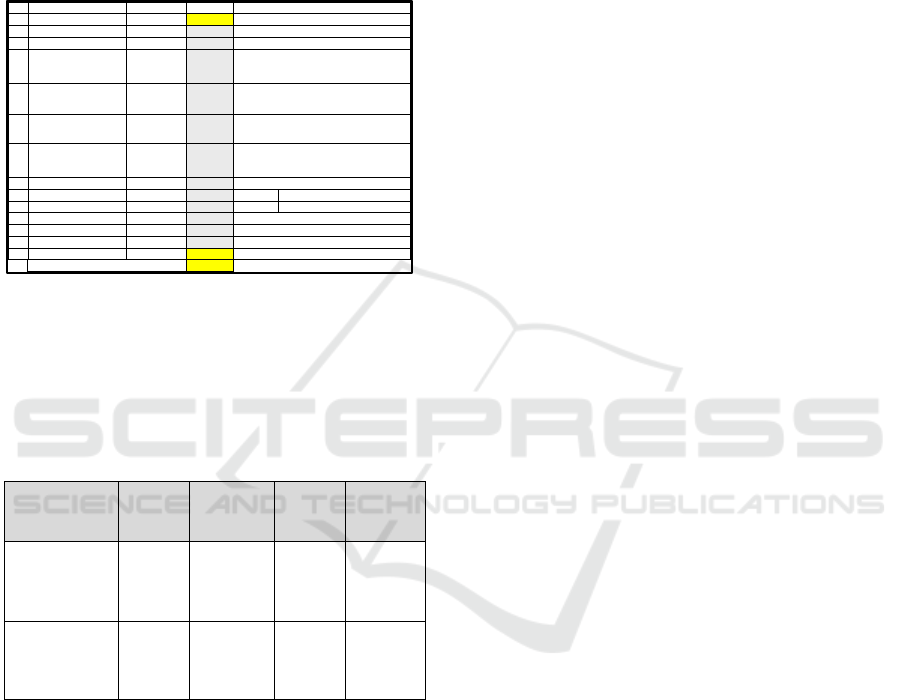
4.4 Tariff Calculation
Table 5 shows an example of IRR calculation from
New GTG + HRSG + Boiler with Debt share of 70%
and Equity share of 30% having WACC 8.78%. IRR
is 11%.
Table 5. IRR Calculation GTG
With free cash flow method, tariffs for Power and
Steam can be obtained using data of CAPEX and
OPEX (Lazard, 2017). With 19 years of operation and
the expected running of 360 days to produce power
and steam, then the tariffs for each alternative is as
shown in Table 6.
Table 6. Tariff Comparison for Alternative Replacement
Comparison GTG &
HRSG +
Boiler
GEG &
HRSG +
Boiler
PLN +
Boiler
Existing
GTG +
HRSG
Power Tariff
(USD/kWh)
0.221 0.282 0.310 0.205
Steam Tariff
(USD/ ton)
0.0019 0.0025 0.0027 0.0018
5 CONCLUSION
Alternative GTG units & HRSG + a boiler offer
electricity tariff of $ 0.221/kWh and a steam cost of
$ 0.0019/ton. The largest contributor to the tariff is
the purchase of units and their installation costing $
48,290,000, with a fuel gas consumption of 12.88
MMSFD.
Alternative GEG units & HRSG + a boiler offer an
electricity tariff of $ 0.282/kWh and a steam cost of $
0.0025/ton. The largest contributor to the tariff is the
use of fuel to produce steam in the boiler which
reaches 15.3 MMSCFD, greater than the current fuel
consumption. Moreover, operating cost of GEG is
high due to frequent maintenance schedules.
Alternative connection to PLN + a boiler offer an
electricity tariff of $ 0.31/kWh and a steam cost of $
0.0027/ton. The largest contributor to the tariff is the
PLN's tariff costing $ 21,595,886/year. Steam fuel
cost for boiler is $ 26,209,137/year. Alternative GTG
& HRSG + a boiler offer the least tariffs of both
electricity and steam generated compared to other
alternative units. Replacement of the existing GTG
unit and HRSG could be more economical when
applying steam descent activities at a gas processing
facility. This is because most of the generation
alternatives require a higher consumption of gas fuel
to produce steam compared to that for electricity
generation
.
REFERENCES
CHP Combine Heat and Power Partnership, 2017,
Catalogue of CHP Technologies, EPA.
Clarke Energy, 2019, Combined Heat and Power (CHP) –
Cogeneration,
Ganapathy, V. 1996. Heat-Recovery Steam Generators:
Understand the Basics. ABCO Industries.
GE Power. 2019. lm2500 50hz Fact Sheet Product
Specifications, American Accounting Association,
Committee on Concepts and Standards for External
Financial Reports, Statement on Accounting Theory and
Theory Acceptance. Sarasota.
Godswill, U. Megwai, R. 2016. A Techno‐Economic
Analysis of Biomass Power Systems Using Aspen Plus,
International Journal of Power and Renewable Energy
Systems (IJPRES), Vol. 3, Issue 2, pp. 25-36.
Lazard, 2017, Lazard’s Levelizedcost of Energy Analysis,
Version 11.0.
Oland, C. B., 2004, Guide to Combined Heat and Power
Systems for Boiler Owners and Operators, Oak Ridge
National Laboratory.
Paoli, N., 2009, Simulation Models for Analysis and
Optimization of Gas Turbine, MS Thesis in Chemical
Engineering, Universita di Pisa.
PHE NSB & PHE NSO, 2020, Daily Operation Routine
(DOR).
PHE NSB & PHE NSO, 2017 & 2018, Laporan Evaluasi
Pemeliharaan.
PHE NSB & PHE NSO. 2020. Lab Analysis Report.
No. Description Numbers
a TotalNilaiBasisAset,US$Dollar
RAB 49.370.123
b AssetDepreciation,(Year)
ELA 19
cinflationRate
Inf 1,31%
d RiskFreeRate,(%) Rf 2,13%
e
BasePremiumforMatureEquity
Market,(%)
BPMEM 5,70%
f
InternalCountryRiskPremium
(Indonesia)
ICRP 3,24%
g Beta β 1,079
hCostofEquity,(%)
Coe
11,78%
i DebtFunding,US$Dollar DB 34.559.086 70%
j EquityFunding,US$Dollar EQ 14.811.037 30%
k InterestOfDebt,(%) Indebt 10,00%
l IncomeTax,(%) IT 25,00%
m CostofDebt,(%) Cod 7,50%
n WACC,(%) WACC 8,78%
IRRonFreeCashFlowshouldbeequaltoIRR 11,00287800%
5YearAverageUSInflation
5YearAverage(1January2012‐1January2017)RiskFreeReturn
onInvestment(USTreasuryBond)10Years
Referensi
CAPEXCalculation
Assumption
WACC=(DB/(DB+EQ))*Cod+(EQ/(DB+EQ))*Coe
Asumsi70%Debt
Asumsi30%Equity
Assumption
5YearAverage(1January2012‐1January2017)Sizeoffluctuation
ininvestmentportfoliosorindividualinvestmentinstruments
com
p
aredtothemarket
(
stockmarket
)
Coe=Rf+β*(BPMEM+ICRP)
UU36of2008Article17Paragraph2
Cod=InterestofDebtx(1‐IncomeTax)
Indonesia5yearaveragecountryriskpremium2013‐2017
Average5YearsBasePremiumformatureequitymarket2013‐
2017
ICoSTE 2020 - the International Conference on Science, Technology, and Environment (ICoSTE)
16
