
Semi Quantitative Risk Analysis of Onshore Receiving Facility
Patria Wiratama, Yuliusman
Department of Chemical Engineering, Engineering Faculty, University of Indonesia, Depok, Indonesia
Keywords: Onshore receiving facility, risk analysis, monte carlo simulation.
Abstract: During the onshore receiving facility (ORF), a potential hazard that could cause an installation failure is found.
Onshore receiving facility installation operator needs to do a risk analysis to identify hazards, determine the
probability of Failure and consequence of Failure and conduct Semi-quantitative risk analysis due to knowing
the risk profile at the onshore receiving facility and the consequence for the environment, people,
assets/business, and company reputation. Based on the risk level, the ORF operator can determine a mitigation
plan and recommend reducing risks such as inspection frequency, maintenance, and repairs related to internal
corrosion and external corrosion. The result of risk analysis states that the overall risk of the ORF installation
is at low risk.
1 INTRODUCTION
1.1 Background
The oil and gas business involves several stages, such
as exploration, exploitation, and production. In
general, the oil and gas business is an industry with
high risks both from a business perspective and a
safety/accident perspective, especially risks caused
by fires and explosions.
Significant hazards in the oil and gas and chemical
industries are related to fires, explosions, and toxic
releases. Of the three hazards, the most common is
fire, but the explosion has the most significant effect
on mortality and loss of production. (Lees, 1994).
The Flixborough incident was the enormous
explosion that occurred in Great Britain, which
caused 28 fatalities and total damage to the vicinity of
the NYPRO plant. The explosion on the Bombay
High North Platform on 27 July 2005 was caused by
a support vessel hitting the gas export riser platform,
causing 22 fatalities and environmental damage, and
loss of production of 120,000 barrels of oil and 4.4
million cubic meters of gas per day. One of the most
significant accidents and the largest accident in the oil
and gas industry occurred on July 6, 1988, at the Piper
Alpha platform in the North Sea, which killed 167
people and totalled the US $ 3.4 billion business
losses. This type of risk is a category of catastrophic
events. Although these occurrences are rare, the
repercussions can be enormous. Not only events that
result in an unacceptable loss of life, large-scale
environmental problems, the economy, poor
community relations, civil litigation, and even
criminal prosecution. These events also often have a
major impact on the development of management
systems and regulations. (Sutton, 2015).
In the oil and gas industry, risks cannot be
avoided. However, these risks can be managed by
referring to the concept of risk management. Risk
management aims to increase opportunities and
minimize losses. The risk management process based
on ISO 31000: 2018 includes: Risk Identification,
Risk Analysis, Risk Evaluation, and Risk Treatment /
Control.
In the gas processing facility, there is a risk of fire
and explosion due to the content of natural gas, most
of which is mainly methane (around 70-90%) and is
highly flammable. These risks can potentially cause
harm to humans (serious injuries, minor injuries, and
death), environmental damage, equipment damage,
and company reputation. These losses can be
controlled by carrying out a risk analysis.
1.2 Facility Description
Onshore Receiving Facility receiving gas and crude
oil from Floating Production Unit (FPU). Gas and
condensate from FPU are separated in the separator.
The volume of the gas from the separator is measured
and sent to the customer. Part of the gas is used to
supply ORF fuel gas used to purge gas and pilot flare
Wiratama, P. and Yuliusman, .
Semi Quantitative Risk Analysis of Onshore Receiving Facility.
DOI: 10.5220/0010785600003317
In Proceedings of the 2nd International Conference on Science, Technology, and Environment (ICoSTE 2020) - Green Technology and Science to Face a New Century, pages 5-11
ISBN: 978-989-758-545-6
Copyright
c
2022 by SCITEPRESS – Science and Technology Publications, Lda. All rights reserved
5

gas in the flare system. Meanwhile, condensate from
the separator is combined with the crude oil from the
FPU to be sent and stored in a storage tank.
2 METHODOLOGY
2.1 Hazard Identification
Hazard identification is carried out by understanding
the equipment damage mechanism in the Onshore
Receiving Facilities installation. It is crucial to make
a proper plan to reduce the failure rate of the
equipment and increase the safety of the plant
operation. Table 1 shows the identification of hazards
and damage that may occur during the operation of
the installation.
Table 1. Damage and Hazard Mechanism of Installation
E
quipment
Damage
Mechanism
Cause Hazard
Pressure
Vessel
Erosion
Corrosion
Failure is
characterized
by metal loss
or thinning of
the pressure
vessel caused
by the
abrasive
material. The
severity is
determined by
gas flow rate,
pressure, type,
and quantity.
Leak
Rupture
Atmospheric
Corrosion
Atmospheric
corrosion is
caused by
moisture in the
air which can
form a thin
layer of liquid
on the surface
of the pressure
vessel. This
depends on the
different
atmospheric
conditions of
the particles
and gases.
Leak
Rupture
E
quipment
Damage
Mechanism
Cause Hazard
Piping Mechanical
Fatigue
Cyclic load
processes and
stress loss.
Mechanical
fatigue can
cause failures
that occur at
relatively low
stress levels.
Leak
Rupture
External
Corrosion
Corrosion
occurs due to
contact
between pipes
and water/soil.
There is a
microscopic
reaction
between
anodic and
cathodic,
triggered by
coating
records,
differences in
aeration,
resistivity, soil
acidity, and
heterogeneity
of soil acidity.
Leak
Rupture
Internal
Corrosion
Corrosion is
caused by gas
content
containing
water, CO2,
H2S, or a
percentage of
SRB.
Leak
Rupture
Erosion
Corrosion
Failure is
characterized
by metal loss
or thinning of
the pressure
vessel caused
by the
abrasive
material. The
severity is
determined by
gas flow rate,
pressure, type,
and quantity.
Leak
Rupture
ICoSTE 2020 - the International Conference on Science, Technology, and Environment (ICoSTE)
6

2.2 Determine of Probability of Failure
(PoF)
Determination of the probability of Failure
(Probability of Failure), is done by evaluating the
parameters of the damage by considering the
percentage of each possible hazard that occurs. The
scoring system is carried out following the
requirements of the installation system. Parameters
and percentages used in the determination of PoF
such as
2.2.1 Corrosion Factor (30%)
Corrosion factors can cause a reduction in thickness
or a possible hazard to the walls of the installation
equipment (pipes and pressure vessels). A reduction
in thickness can be caused by the interaction of pipe
walls and pressure vessels with the products/fluids
contained in pipes and pressure vessels. To determine
the value of the corrosion factor, there are several
variables as follows: Inspection frequency (20%),
equipment service life (20%), external protection
(15%), equipment material (15%), fluid impact
(15%), water impact (15%).
2.2.2 Operating Condition Factor (25%)
In operating conditions, some factors may allow the
installation facility to fail. Factors that can cause
Failure are leaks in the installation equipment. To
determine the operating factor value, there are several
variables as follows: Excess flow (25%), excess
pressure (30%), pressure shift (15%), level shift
(15%), and temperature shift (15%).
2.2.3 Electrical Failure (5%)
In addition to leading equipment such as pipes and
pressure vessels, the ORF installation also includes
electrical instruments. As for the possibility of
damage that can occur to the electrical system caused
by internal factors (electrical equipment inspection
frequency) (55%) and external factors (history of
being struck by lightning ) (45%).
2.2.4 Leakage Factor (10%)
ORF installations have the highest design pressure of
2300 PSIG and an operating pressure of up to 1200
PSIG. Under these operating conditions, it can cause
erosion-corrosion and lead to leakage failure. To
determine the leakage factor value, there are several
variables as follows: Leakage history (40%), flange
management (30%), and valve inspection interval
(30%).
2.2.5 Third-Party damage (10%)
On the third party, factors indicate the extent of
activity or distraction from the third party to the ORF
installation. Third-party interference, in this case, is
the history and possibility of sabotage of the ORF
installation operation
2.2.6 Equipment Design (10%)
In the equipment system design factor, an assessment
is carried out on the suitability of the equipment
design with applicable codes and standards both
nationally and internationally.
2.2.7 Construction Factor (10%)
In the construction factor of the equipment, an
assessment of the suitability of the equipment with
the as-built drawing is also carried out and its
supervision.
2.3 Determine of Consequence of
Failure (CoF)
The consequences of Failure are determined based on
the risk parameters applied by the company by
considering the weight of each consequence factor on
the possible events that occur during operational
activities. The calculated consequence parameters
described as below.
2.3.1 Safety Factor (30%)
The variable of the safety factor is the level of fatality
that can occur in the Onshore Receiving Facility
Installation in the event of an operation failure. The
safety level is rated the size of the leak diameter. The
safety variable weights 30% of the total consequences
of installation failure.
2.3.2 Environmental Factor (25%)
The environmental impact variable is reviewed by the
level of pollution or damage caused by the installation
equipment if it experiences Failure or leakage. On the
consequences of environmental damage, an
assessment of the type of fluid service (40%),
flammability (30%), and population density (30%)
are carried out. The environmental damage variable
weighs 25% of the total consequences of installation
failure.
Semi Quantitative Risk Analysis of Onshore Receiving Facility
7
2.3.3 Assets Loss (35%)
The variable consequence of company asset loss is the
variable that states the company's infrastructure
damage caused by equipment damage to the ORF
installation. The asset damage variable weighs 35%.
2.3.4 Company Reputation (10%)
The company reputation variable shows the degree of
damage to the company's reputation that can be
caused by failure or damage to the ORF installation.
A company's reputation is determined by media
exposure of failure or damage; this variable weights
is 10%.
2.4 Risk Calculation
After all the parameters of the probability of Failure
(PoF) and Failure (CoF) have been determined, then
the risk calculation is carried out as follows
Total PoF = ∑ PoF
(i)
= 0,3 PoF
(1)
+ 0,25 PoF
(2)
+
0,05 PoF
(3)
+ 0,1 PoF
(4)
+ 0,1 PoF
(5)
+ 0,1 PoF
(6)
+ 0,1
PoF
(7)
………………………(1)
Total CoF = ∑ CoF
(i)
= 0,3 PoF
(1)
+ 0,25 PoF
(2)
+
0,35 PoF
(3)
+0,1PoF
(4)
……………...(2)
Risk = Total PoF x Total CoF…..(3)
From the total probability and consequence,
multiplication is then performed to obtain the ORF
installation risk value. The results of the risk value
calculation are then inputted into the risk matrix used.
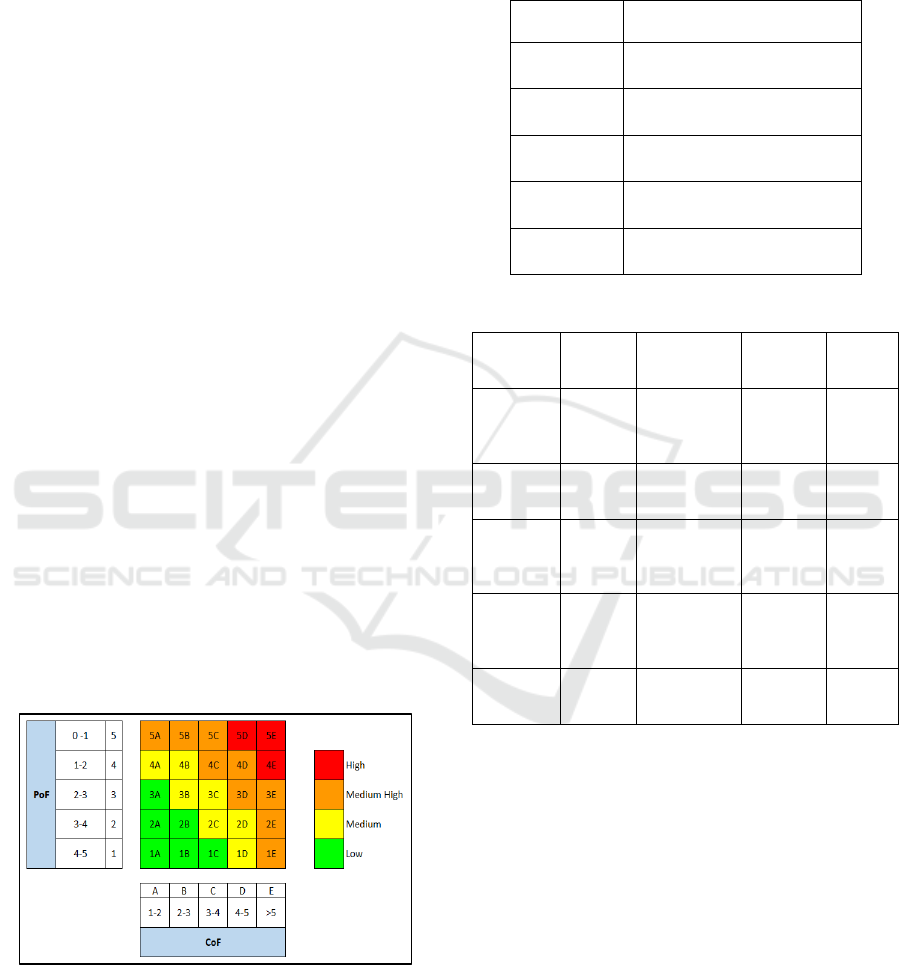
The risk matrix used is shown in Figure 1
Figure 1 Risk Matrix
In this study, the Monte Carlo equation is used.
Calculations are used with the simulation program to
generate risk values according to the risk matrix. The
certainty level that used on this simulation is 80-85%.
The risk matrix is divided into four main areas,
namely the low-risk level, medium risk level, medium
high-risk level, and high-risk level.
Table 2 Probability Category
Probability
Level
Description
5
It happens several times per
year in the company
4
It happens several times per
year in the industry
3 Has occurred in the company
2 Has occurred in the industry
1 Never heard the industry
Table 3. Consequence Category
Conse
quence
Level
People Environment Property
Repu
tation
E Multiple
fatalities
Massive
effect
Extensive
damage
Internatio
nal
impact
D Fatality
Major effect
Major
damage
National
impact
C Major
injury
potential
Localized
effect
Localized
damage
C
onsidera
ble
impact
B Minor
injury
potential
Minor effect
Minor
damage
Limited
impact
A No health
effect
No effect
No
damage
No
impact
3 RESULTS AND DISCUSSION
3.1 Probability of Failure Calculation
3.1.1 Corrosion Factor
Based on the assessment, the corrosion factor score is
3.60. The result is obtained from the following
scoring results: Inspection frequency score 4.00,
equipment service life 2.00, external protection score
5.00, equipment material score 3.00, fluid impact
score 4.00, and water impact score 4.00. The
following figure is the simulation result of Crystal
Ball for the corrosion factor.
ICoSTE 2020 - the International Conference on Science, Technology, and Environment (ICoSTE)
8
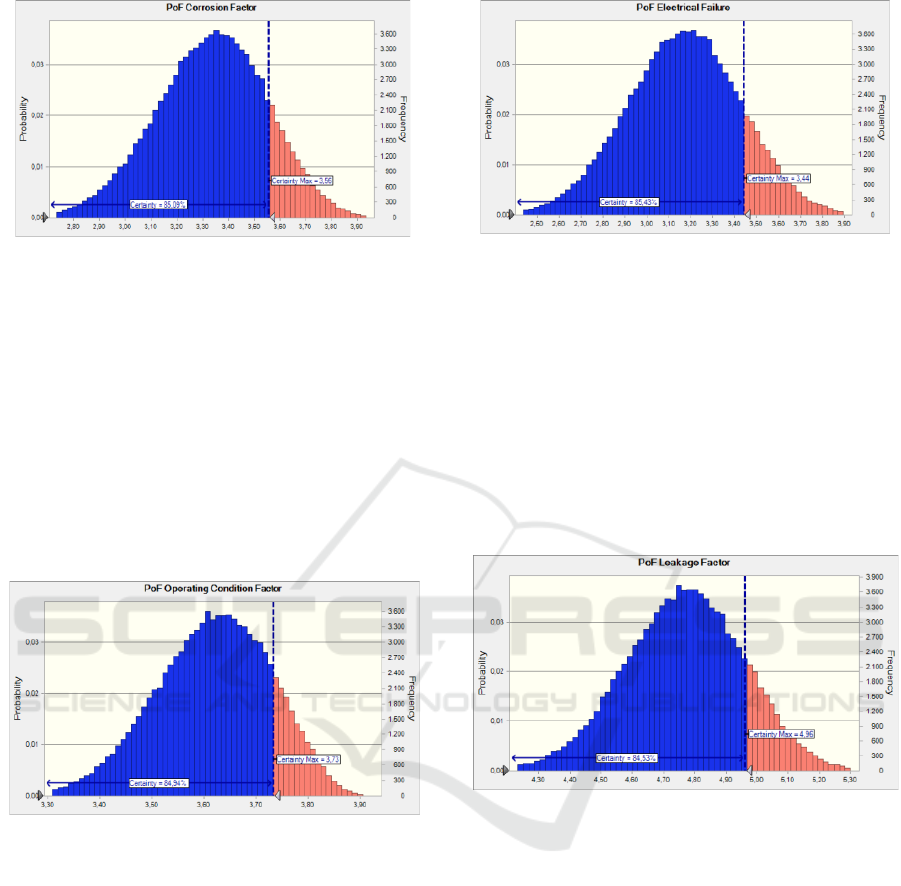
Figure 2 Corrosion Factor Simulation
Based on Figure 2, the total PoF value of the corrosion
factor is 3.56, with a certainty level of 85%.
3.1.2 Operating Condition Factor
Based on the assessment, the operating condition
factor score is 4.10. The result is obtained from the
following scoring results: Excess flow score 5.00,
excess pressure score 3.00, pressure shift score 4.00,
level shift score 4,00, and temperature shift score
5.00. The following figure is the simulation result of
Crystal Ball for the operating condition factor
Figure 3 Operating Condition Factor Simulation
Based on Figure 3, the total PoF value of the
operational factor is 3.73 with a certainty level of 85%
3.1.3 Electrical Failure
Based on the assessment, the electrical failure score
is 3.35. The result is obtained from the following
scoring results: Electrical equipment inspection
frequency scores 2.00 and history of being struck by
lightning score 5.00 The following figure is the
simulation result of Crystal Ball for the electrical
failure.
Figure 4 Electrical Failure Simulation
Based on Figure 4, the total PoF value of the electrical
failure is 3.44, with a certainty level of 85%
3.1.4 Leakage Factor
Based on the assessment, the leakage factor score is
5.00. The result is obtained from the following
scoring results: Leakage history score 5.00, flange
management score 5.00, and valve inspection interval
score 5.00. The following figure is the simulation
result of Crystal Ball for the leakage factor
Figure 5 Leakage Factor Simulation
Based on Figure 5, the total PoF value of the electrical
failure is 4.96 with a certainty level of 85%
3.1.5 Third Party Damage
Based on the assessment, the third-party damage
score is 5.00. These results are based on the situation
surrounding the installation being stable, and there is
no history of sabotage. The following figure is the
simulation result of Crystal Ball for the Third Party
Damage.
Semi Quantitative Risk Analysis of Onshore Receiving Facility
9
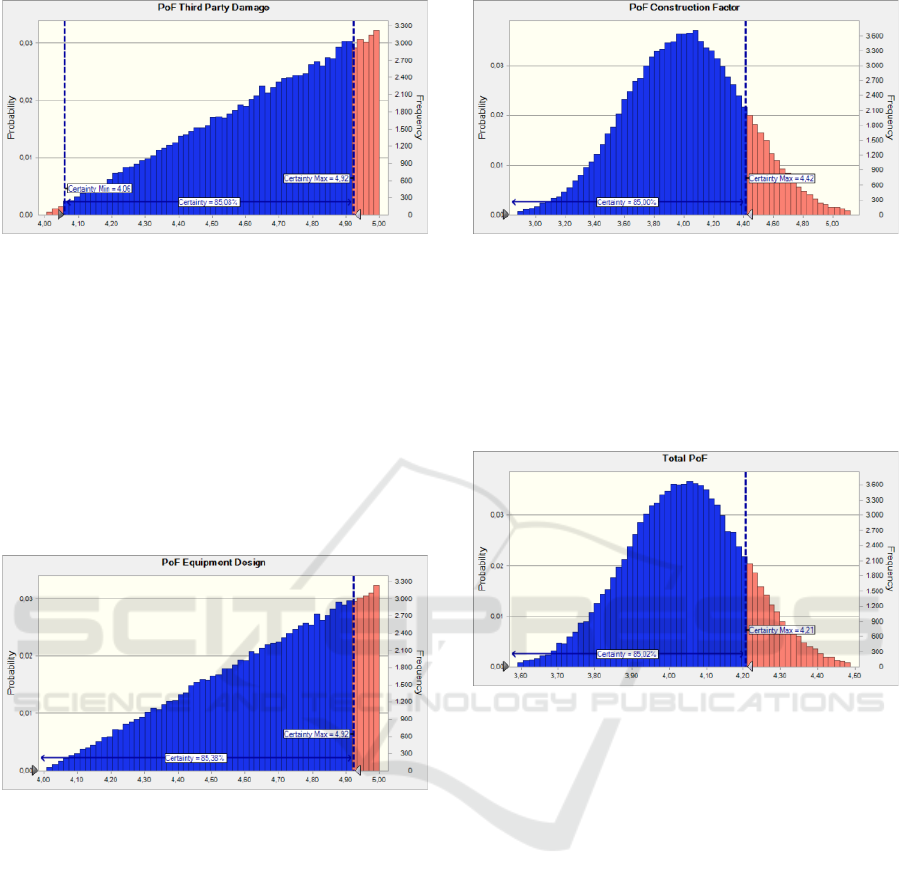
Figure 6 Third-Party Damage Simulation
Based on Figure 6, the total PoF value of the third
party damage is 4.92, with a certainty level of 85%.
3.1.6 Equipment Design
Based on the assessment, the equipment design score
is 5.00. These results are based on the design is well
documented, and the design of the equipment meets
the international applicable codes & standards. The
following figure is the simulation result of Crystal
Ball for the Equipment Design.
Figure 7 Equipment Design Simulation
Based on Figure 7, the total value of the equipment
design is 4.92 with a certainty level of 85%.
3.1.7 Construction Factor
Based on the assessment, the equipment design score
is 4.00. These results are based on the equipment
constructed following (as-built drawing) and mainly
supervised (75%). The following figure is the
simulation result of Crystal Ball for the Construction
Factor.
Figure 8 Construction Factor Simulation
Based on Figure 8, the total value of the
equipment design is 4.42 of 85%
3.1.8 Probability of Failure Total Score
The following figure is the simulation result of
Crystal Ball for total Probability of Failure (PoF)
Figure 9 Total PoF
Based on Figure 9, the total PoF value of installation
is 4.21, with a certainty level of 85%. Referring to the
risk matrix, the probability level is at level 1
3.2 Consequence of Failure Calculation
3.2.1 Safety Consequence
Based on the assessment, the safety factor score is
1.00 of 5.00. These results are based on no leakage
history in the installation.
3.2.2 Environmental Consequence
Based on the assessment, the environmental score is
3.50 of 5.00. These results are based on the
installation fluid service score is crude oil & sweet
natural score 5.00 of 5.00 which are flammable
material, but there is no ignition source the score 2 of
5.00, and the density of population is ASME location
class 2 the score 2 of 5.00
ICoSTE 2020 - the International Conference on Science, Technology, and Environment (ICoSTE)
10
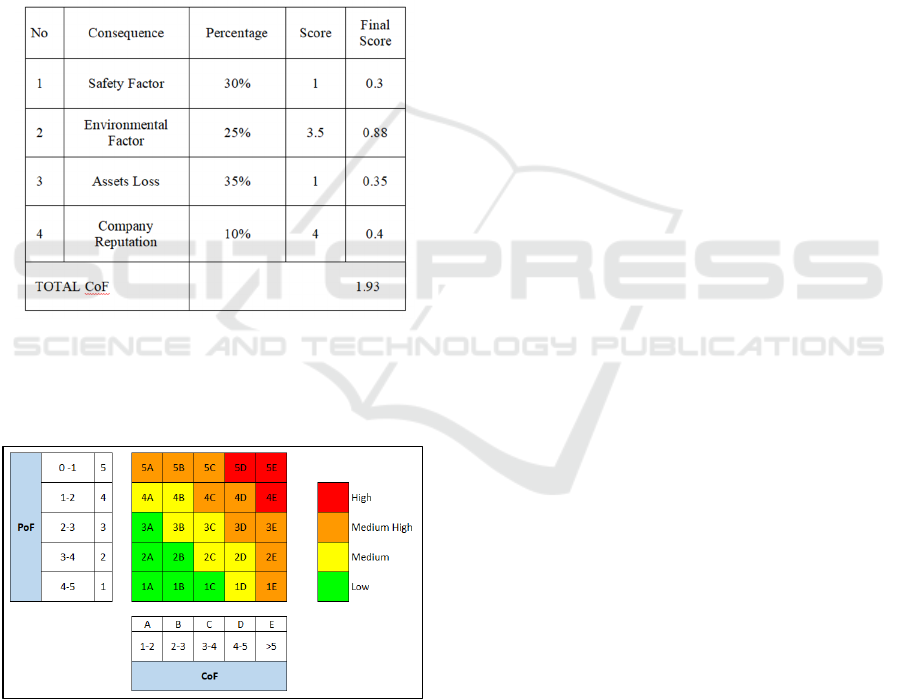
3.2.3 Assets Loss Consequence
Based on the assessment, the assets loss score is 1 of
5.00. These results are based on the 1 (one) day
production delay, which cost <US$ 1 million in
repair, but there is no record of shutdown history.
3.2.4 Company Reputation Consequence
Based on the assessment, the company reputation
consequence score is 4 of 5.00. These results are
based on the national media coverage in the event of
an installation failure.
Table 4. CoF Calculation Result
3.2.5 Final Risk
Based on Total PoF x Total CoF, the result of ORF
Installation shown in the figure below.
Figure 10. Final Risk
4 CONCLUSIONS
Based on the risk analysis assessment results, the
probability level is 1 (one), and consequence A so
refer to the risk matrix that the risk level of the
Onshore Receiving Facility Installation is in the
"Low" zoning, which indicates an insignificant and
acceptable risk profileg.
REFERENCES
Arnur Ramdani, 2014, Analisis Semi-Kuantitatif Risiko
Kebakaran dan Ledakan Pada Fasilitas Pengolahan
Gas, Universitas Indonesia, Jakarta.
AS/NZS 4360. 2004. Risk Management Guidelines.
Canadian Society for Chemical Engineering, 2012, Process
Safety Management Guide, Ontario.
Crowl Daniel A, Joseph F. Louvar, 2001, Chemical Process
Safety Fundamentals with Applications: 2
nd
Edition,
Pearson College.
Crowl Daniel A, Joseph F. Louvar, Chemical Process
Safety Fundamentals with Applications: 3
rd
Edition,
Pearson College.
Khan, A. A, 1993, Risk Analysis of an LPG Storage Facility
in India, Indian Institute of Chemical Technology.
Lees Frank P, Loss Prevention in the Process Industries 2
nd
Edition, Vol. 1, Department of Chemical Engineering,
Loughborough University, United Kingdom.
Mannan, Sam, 2014, Lees’ Process Safety Essentials,
Elsevier Inc.
Martins M.R, Pestana, Quantitative Risk Analysis of
Loading and Offloading Liquified Natural Gas (LNG)
on Floating Storage and Regasification Unit (FSRU),
Journal of Loss Prevention in the Process Industries.
Sutton Ian, Process Risk and Reliability Management 2
nd
Edition, 2015, Oxford.
Tsan Ming Choi, Chun Hung Chiu, 2012, Risk Analysis in
Stochastic Supply Chains A Mean- Risk Approach, Vol.
178. Hongkong.
The US Department of Labor Occupational Safety and
Health Administration, 2002, Process Safety
Management.
Yakub Maulana, Sisca Mayang Puspa, 2019, Manajemen
Risiko Kebakaran Pada PT Pertamina EP Asset 4 Field
Sukowati, Journal of Industrial Hygiene and
Occupational Health, Vol. 3.
Semi Quantitative Risk Analysis of Onshore Receiving Facility
11
