The Effect of Financial Constraints on
Cash Tax Savings
Arni Yulvia and Wika Arsanti Putri
Managerial Accounting Department, Politeknik Negeri Batam, Ahmad Yani Street, Batam, Indonesia
Keywords: Financial Constraints, Cash Tax Savings, Tax Avoidance
Abstract: This study aims to empirically examine the effect of financial constraints on cash tax savings. The object
under study is manufacturing sector companies listed on the Indonesia Stock Exchange in the 2014 -
2018 period with a total sample of 185 companies over 5 years obtained by purposive sampling. The
research method used is a quantitative method with a panel data regression analysis approach fixed effect
model with the help of Eviews application version 11. The results of the study found that changes
in financial constraints did not significantly influence the cash tax savings that was proxied by
∆GAAP ETR. This shows that companies with increased financial constraints do not obtain additional
internal funds with a cash tax savings strategy. Companies pay more attention to the risks they will face if
using this strategy.
1 INTRODUCTION
The main revenue for Indonesia is mostly sourced
from the tax sector. The tax revenue will then be
used to finance the needs of the country so that all
taxpayers both individuals and entities are expected
to meet their tax obligations following applicable
taxation provisions. Based on data obtained from
the Ministry of Finance, the amount of state
revenue through the tax sector targeted by the
government as a source of funding for State
Expenditure Budget in 2018 reached 85.40 percent
of the total state revenue of Rp 1,894.72 trillion or
around Rp 1,618.10 trillion. The government must
optimize tax revenue so that it can be realized
according to the targets set to encourage economic
growth (Wiratmoko, 2018).
One of the efforts made by the government to
realize the goals of a nation in financing the
country's development is to explore sources of
funding from the tax sector. The government
continues to be determined to carry out tax reforms
to increase tax revenue. The government is trying to
increase the tax ratio gradually as one indicator to
assess the government's ability to collect tax revenue
(www.kemenkeu.go.id).
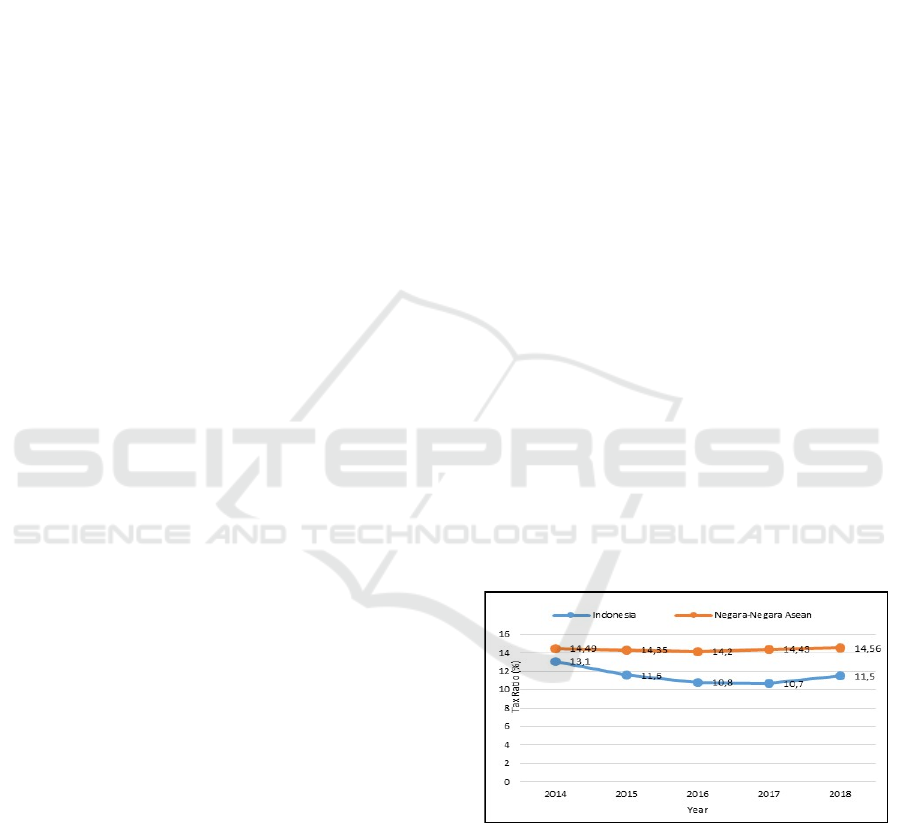
Minister of Finance, Sri Mulyani, based on a
quote from wartaekonomi.co.id (January 3, 2019)
revealed that Indonesia's tax ratio in 2018
experienced a significant increase to 11.5 percent.
However, when viewed from a comparison of
ASEAN countries, Indonesia's tax ratio from 2014-
2018 is still far behind. The comparison of the
tax ratio between Indonesia and ASEAN countries
can be seen in Figure 1.
Figure 1: Comparison of Tax Ratio between Indonesia and
ASEAN countries
Source : World Bank, Kementerian Keuangan (2019)
According to Darussalam (2017), a fundamental
problem in the Indonesian taxation sector that has
not yet been fully resolved to date, one of which is
the leakage of tax revenue caused by tax avoidance
activities. Taxpayers will try to do tax avoidance as
a form of tax planning strategy to minimize the
amount of tax paid against the state without
174
Yulvia, A. and Putri, W.
The Effect of Financial Constraints on Cash Tax Savings.
DOI: 10.5220/0010355601740185
In Proceedings of the 2nd International Conference on Applied Economics and Social Science (ICAESS 2020) - Shaping a Better Future Through Sustainable Technology, pages 174-185
ISBN: 978-989-758-517-3
Copyright
c
2021 by SCITEPRESS – Science and Technology Publications, Lda. All rights reserved

violating taxation laws (Mardiasmo, 2018).
According to Koester, Shevlin, & Wangerin (2016),
one tax avoidance strategy includes an effort to cash
tax savings.
Tax avoidance strategies with tax savings by
companies can cause huge losses for the
government. Therefore, the government needs to
learn more about the characteristics of companies
that utilize tax savings as a way to do tax avoidance.
It is intended that the government can consider and
make it easier to assess whether transactions that
occur by companies are still within reasonable limits
or not. Most companies prefer to increase tax savings
to maintain corporate profits to avoid bankruptcy.
Based on evidence by Law & Mills (2015) and
Edwards, Schwab, & Shevlin (2016) shows that
companies tend to increase cash tax savings to
generate internal funds in response to increased
financial constraints.
Financial constraints are conditions where
companies have difficulty in accessing funding from
external sources. The existence of financial
constraints can be caused by several conditions both
from internal and external factors. Internal factors
occur if the company experiences liquidity problems
caused by the failure of the company in achieving
sales targets, causing the company to not be able to
finance the company's operations until in the end the
situation causes bankruptcy for the company
(Altman, 1968) and if the company faces difficulties
in financing its investment (Kaplan & Zingales,
1997; Whited & Wu, 2006). External factors occur
due to macroeconomic shocks, such as the economic
crisis, inflation, and the banking crisis
4
.
This study is the adoption of research by
Edwards, Schwab, & Shevlin (2016). The difference
that supports from previous research lies in several
parts, including (1) Using GAAP changes in the
Effective Tax Rate (∆GAAP ETR) to measure cash
tax savings as the dependent variable. (2) Using
secondary data in the form of annual reports on
manufacturing sector companies listed on the
Indonesia Stock Exchange (IDX) within five years
starting from 2014-2018.
This research was conducted to test whether
companies facing financial constraints tend to
generate internal funds through tax avoidance
activities. This study will use financial constraints
and cash tax savings variables which have been
tested in previous studies with inconsistent results.
The results of research by Edwards, Schwab, &
Shevlin (2016) argue that the increases financial
constraints measured by firm-specific and
macroeconomic shocks has positive effect on cash
tax savings. Different from previous studies, the
results of research in Indonesia conducted by
Hermawan & Riandoko (2018) conclude that the
increases in financial constraints measured by firm-
specific levels has significant positive effect on cash
tax savings, but not significant if measured by
macroeconomic shocks. Based on the background of
the problems outlined above, the title of this study is
"The Effect of Financial Constraints on Cash Tax
Savings".
2 THEORETICAL
FRAMEWORK AND
HYPOTHESIS
DEVELOPMENT
2.1 Theoretical Framework
2.1.1 Theory of Constraints
Theory of Constraints (TOC) is the development of
Optimized Production Technology (OPT). This
theory was first introduced by Dr. Eliyahu M.
Goldratt in 1986. OPT is a technique for optimizing
production scheduling that aims to increase the
overall output of products sold (Throughput), reduce
inventory (Inventory), and reduce operational costs
(Operational expense). Goldratt (1986) has made a
concept in OMO by incorporating management
philosophy in improvement based on identifying
obstacles to increasing profit.
The basic concept of TOC is that every
organization has at least one obstacle that prevents
management from achieving its operational goals.
These constraints should be identified to improve
performance. If an obstacle is solved then the next
obstacle can be identified and updated.
2.1.2 Pecking Order Theory
Pecking Order Theory was first introduced by
Donaldson in 1961 with the theory naming done by
Steward C. Myers and Nicholas S. Majluf in 1984.
This theory states that companies tend to prioritize
funding from internal sources to pay dividends and
fund investment. If the use of internal funds is
insufficient, the company will use external funds
besides. Internal funding is obtained from the
company's operating results in the form of retained
earnings, cash flow, and depreciation. Whereas
external funding in the form of bond issuance takes
precedence over the issuance of new shares. The
The Effect of Financial Constraints on Cash Tax Savings
175
results of Donaldson's research (1961) state that
bond issuance is carried out by companies to avoid
issuance costs (floatation costs) that are tied to
external funding because the cost of issuing bonds is
cheaper than issuing new shares.
2.1.3 Financial
Financial is defined as the availability of money
needed to maintain the company. According to
Jatmiko (2017), finance is the art and science of
managing money that influences every organization
to achieve its goals. Howard & Upton (1952) in
Jatmiko (2017) defines finance as an "administrative
area" in a company that deals with how to manage
cash flow so that the company has the means to
carry out its objectives as efficiently as possible and
at the same time fulfill the obligations that must be
paid. If the company's finances are inadequate then
the company will not be able to achieve its goals.
2.1.4 Tax Law Tax Avoidance
Tax avoidance through cash tax savings is one type
of strategy that companies pay attention to because it
aims to minimize the amount of tax paid to the
government (Whited & Wu, 2006). Companies that
always try in various ways to make cash, can be said
that the company is in a state of financial
constraints. But they don't always make cash
through tax avoidance as a result of financial
constraints. When macroeconomic shocks occur like
an economic crisis, all companies will be affected.
This will tend to encourage companies to generate
cash through tax avoidance.
2.2 Hypothesis Development
2.2.1 Effects of Changes in Financial
Constraints on Cash Tax Savings
Research by Edwards, Schwab, & Shevlin (2016)
states that the increases in financial constraints both
measured by firm-specific and macroeconomic
shocks have positive effect on cash tax savings.
Contrary to the results of previous studies,
Hermawan & Riandoko (2018) found that the
increases in financial constraints measured by firm-
specific levels has significant positive effect on cash
tax savings, but not significant if measured by
macroeconomic shocks
According to Edwards, Schwab, & Shevlin
(2016), companies that face increasing financial
constraints will tend to generate additional internal
funds through a tax avoidance strategy rather than
accessing external funding. This is because external
funding is far riskier because of the emergence of
greater external funding that must be borne by the
company. The formulation of the hypothesis that
will be tested by researchers based on the above
hypothesis development path is:
H1: Changes in financial constraints has positive
effect on cash tax savings
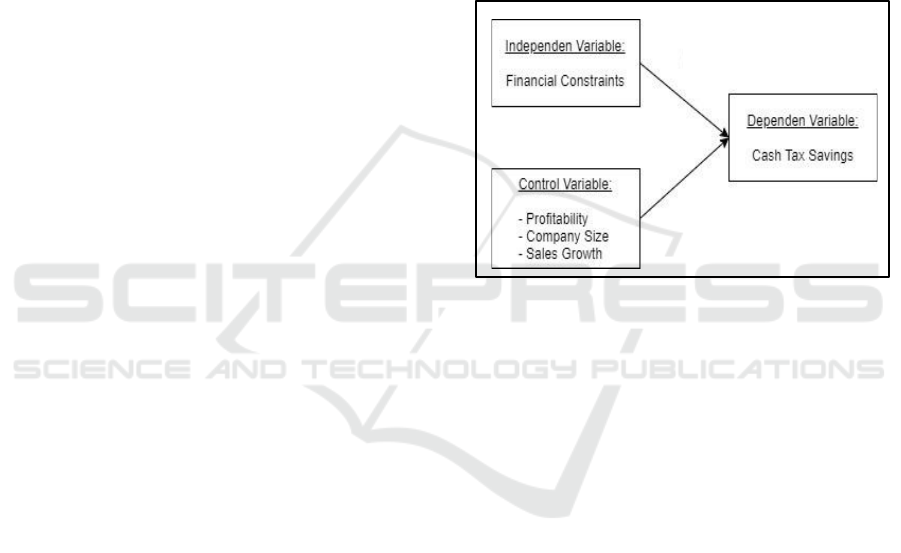
Based on the development of the hypothesis
that the researcher has described above, the
description of the research model adopted by the
researcher, namely:
H1
(+)
Figure 2: Research Model
3 RESEARCH METHOD
3.1 Data Types and Sources
The type of data used is quantitative data with data
sources used, namely secondary data in the form of
figures from annual reports on manufacturing sector
companies obtained through the official website of
the IDX during 2014-2018 period. Based on the time
of collection, cross-section data and time series will
be used in this study.
3.2 Variable Operational Definitions
and Measurements
3.2.1 Dependent Variable
The dependent variable defined in this study is cash
tax savings. A proxy that will be used to measure
cash tax savings is ∆GAAP ETR. GAAP ETR is
represented by a percentage of the amount of cash
paid for tax costs divided by profit before tax.
Researchers measure ∆GAAP ETR in t + 1 year
period (starting from 2015-2018) because companies
ICAESS 2020 - The International Conference on Applied Economics and Social Science
176
generally need time to plan and implement tax
avoidance strategies (Edwards, Schwab, &
Shevlin, 2016). The formula used to calculate
∆GAAP ETR according to Hanlon & Heitzman
(2010) is:
Total income tax expense t+1
∆GAAP ETRt+1 =
Total Pretax accounting income t+1
3.2.2 Independent Variable
The independent variable determined in this study is
the change in financial constraints (Constraints).
This variable is represented by two proxies, namely
∆Altman Z-Score and ∆KZ-Index. Researchers
measured ∆Constraints in the period t-1 to t years
(starting from 2014-2017) but the effect of changes
in the dependent and control variables began in
2015-2018. Higher ∆Constraints represent increased
financial constraints.
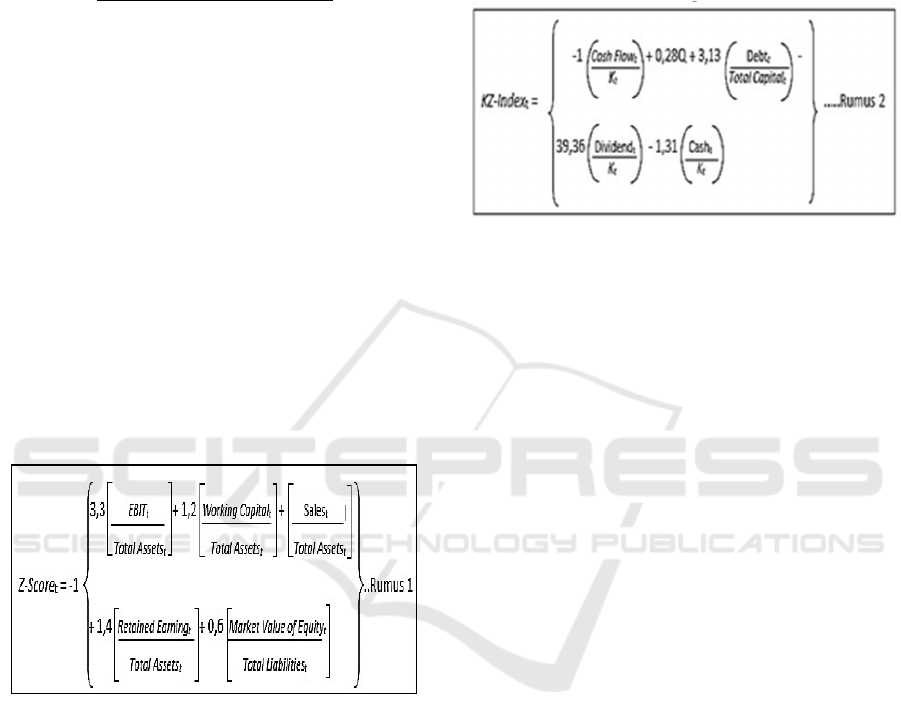
∆Altman Z-Score is intended to know the
prediction of financial distress and ∆KZ-Index to
find out the constraints related to corporate
investment. The formulas used to calculate the
∆Altman Z-Score and ∆KZ-Index according to
Altman (1968) and Kaplan & Zingales (1997) are:
Where:
t =
Annual financial statements
for 2014-2017 period
EBIT =
Earning Before Interest and
Taxes
Working
Capital = Current assets - Current
liabilities
Sales = Net sales
Retained
Earning = Appropriated +
Unappropriated
Market Value of
Equity = Stock price x Share
outstanding
Total Assets = Current Assets + Fixed
Assets
Total Liabilities = Short-term liabilities +
Long-term liabilities
Where:
t = Annual financial statement for
2014-2017 period
Cash flow = Net profit before extraordinary
items + Depreciation &
Amortization
Tobin’s Q = Market value of equity + Debt) /
Total asset (Lindenberg & Ross,
1981)
Debt = Total Long-term debt + Debt
in current liabilities
Total Capital = Total Long-term debt + Debt
in current liabilities +
Stockholders’ equity
Dividend = Total Cash Dividends
Paid (common and preferred)
Cash = Cash and short-term investments
K = Property, plant & equipment
All proxies used to measure the level of financial
constraints are multiplied by -1 so that the higher
values represent an increase in financial constraints.
3.2.3 Control Variable
The control variables in this study are used to
complete or control the causal relationship between
the independent variable and the dependent variable,
to get more complete empirical model. Control
variables are measured together with changes in
∆GAAP ETR in t + 1 year period (starting from
The Effect of Financial Constraints on Cash Tax Savings
177

2015-2018). The control variables used in this study
related to cash tax savings are:
Profitability
Profitability can be measured by proxy for changes
in Return On Assets (∆ROA), ie changes inthe ratio
of profit before tax to the level of assetincome. The
formula used to calculate ∆ROA basedon the proxy
model by Adhikari, Derashid, & Zhang
(2006) is:
∆ROAt+1 = Profit before tax t+1
Total Assets t+1
Company Size
This variable is calculated through the ∆LnSales
proxy, using a change in the natural logarithm ratio
of total sales. This variable can directly influence the
level of GAAP ETR. The formulas used to measure
∆LnSales according to Belkaoui & Karpik (1989)
are:
∆LnSales
t+1
= Log natural of sales
t+1
Sales Growth
Sales growth can be measured by the ∆SalesGrowth
proxy, which is a change in the ratio of total sales in
the following year after deducting sales in the
previous year against sales in the previous year. The
formula used to measure ∆SalesGrowth according to
Poernawarman (2015):
∆SalesGrowth = Sales (t) – Sales (t-1)
Sales (t-1)
3.3 Research Object
The research object used is financial constraints and
their influence on cash tax savings in manufacturing
sector companies listed on the Indonesia Stock
Exchange during 2014-2018 period.
3.4 Population and Sample
The research sample used was companies in the
manufacturing sector listing on the Indonesia Stock
Exchange from 2014-2018 with a determined
population of 165 companies, but the total
population had been reduced according to
established criteria so that the number of samples
taken was 37 companies with 185 observations
during 5 years.
3.5 Sampling Technique
The sampling technique in this study is a non-
probability sampling (non-random) in the form of
purposive sampling with criteria based on judgment
sampling. The criteria used are companies in the
manufacturing sector that are listed on the IDX and
publish financial reports consistently from 2014-
2018, companies that publish financial statements
for the period of January 1 to December 31, present
financial statements in currencies in rupiah, has
complete financial data related to the research
variables, companies that obtain positive profit
before tax and companies whose transactions are
subject to final income tax (PPh) are exempted from
the sampling criteria considering the final PPh is
different in terms of the level and administration of
the Corporate Income Tax.
3.6 Data Collection Technique
Data collection techniques related to research to
be carried out is the archive data in the database.
This technique is used to determine secondary data
from related sources, namely the Indonesia Stock
Exchange which can be accessed through the
website www.idx.co.id.
3.7 Data Processing Techniques
The data processing technique used is data
tabulation. This technique is done by placing the
data in the financial statements according to the
needs of analysis into a table that has been made
with the Microsoft Excel program to facilitate
researchers in the process of data analysis. Data that
have been analyzed are then processed statistically
using the Eviews 11 application.
3.8 Data Analysis Technique
The data analysis technique used in this study is a
panel data regression analysis technique to examine
the effect of financial constraints on cash tax
savings (Hermawan & Riandoko, 2018). Panel data
is a combination of time series data and cross-
section data (Basuki & Prawoto, 2017). The data
obtained in this study were processed using panel
data regression models, namely the simple effect
model (common effect), fixed effect model (fixed
effect), and the random effect model (random effect)
ICAESS 2020 - The International Conference on Applied Economics and Social Science
178

with the selection of panel data regression models
based on the chow test, test Hausman, and the
Lagrange multiplier (LM) test.
4 RESULTS AND DISCUSSION
4.1 Descriptive Statistics
Descriptive statistical analysis is used to find out
the mean, minimum, maximum, median, and
standard deviation of ∆GAAP ETR, ∆Z-Score,
∆KZ-Index, ∆ROA, ∆LnSales, and ∆SalesGrowth as
control variables. The results of the analysis can be
seen in table 1
Table 1: Results of Descriptive Statistics Analysis
Variabel n Mean Min Max Median Std.
Dev.
∆GAAP ETR 185 0.2153 0.0000 0.5809 0.2498 0.1281
∆Z-Score 185 378.430 1.649.791 0.0000 -46.748 2.134.653
∆KZ-Index 185 0.2039 -789.307 3.508.786 -16.824 494.702
∆ROA 185 0.1109 0.0000 0.7091 0.0830 0.1268
∆LnSales 185 185.702 0.0000 30.8116 207.575 105.509
∆
S
al
e
s
Growth 185 0.0635 -0.4376 0.8437 0.0457 0.1190
Note: This table displays descriptive statistical test results.
Dependent Variable: Cash Tax Savings (∆GAAP ETR).
Independent Variable: Financial Constraints (∆Z-Score, ∆KZ-
Index). Control Variables: Profitability (∆ROA), Company
Size (∆LnSales), Sales
G
r
owth (∆Sales
G
r
owth).
Source: Data processing results in Eviews 11
Based on the descriptive statistical test results in
table 1, the number of samples used in this study
was 185 samples. The dependent variable in the
form of cash tax savings as measured by the ∆GAAP
ETR proxy has an average value of 0.2153 which
shows the average ability of the company to make
cash tax savings. Companies that have a cash tax
savings index value exceeding 1 indicate that
the level of companies that use cash tax savings
strategies is very high. The lowest (minimum)
value of cash tax savings of 0.0000 is owned by
PT. Mandom Indonesia Tbk in 2015 while the
highest value (maximum) of 0.5809 is owned
by PT. Argha Karya Prima Industry Tbk in
2017. The median value is 0.2498 and the
standard deviation is 0.1281.
The independent variables in this study are
financial constraints as measured by the proxy ∆Z-
Score and ∆KZ-Index. The index value of financial
constraints with ∆Z-Score proxy has an average
value of 37.8430 which shows the average ability of
a company to predict financial distress. The lowest
value of ∆Z-Score of 1,649.791 is owned by PT.
Astra International Tbk in 2016 while the highest
value of 0.0000 is owned by PT. Argha Karya Prima
Industry Tbk in 2015. The mean value is -
4.6748 and the standard deviation value is 213.4653.
The index value of financial constraints with a
Proxy ∆KZ-Index has an average value of 0.2039,
which indicates the average ability of a company to
know constraints related to investment. The lowest
value of the ZKZ-Index of -78.9307 is owned by PT.
Merck Tbk in 2015 while the highest value of
350.8786 was owned by PT. Astra International Tbk
in 2016. The mean value is -1.6824 and the standard
deviation value is 49.4702.
This study uses three control variables, namely
profitability, company size, and sales growth.
Profitability as measured by the ∆ROA proxy shows
an average value of 0.1109 meaning that 11% of
manufacturing companies show efficiency in
utilizing assets owned by companies with the lowest
value of 0.0000 owned by PT. Asahimas Flat Glass
Tbk in 2018 while the highest value of 0.7091 is
owned by PT. Multi Bintang Indonesia Tbk in 2017.
The mean value is 0.0830 and the standard deviation
value is 0.1268.
Company size is measured by performing a natural
logarithm of the total sales obtained by the company
showing an average value of 18.5702 with the
lowest value of 0.0000 owned by PT. Astra
International Tbk in 2016 while the highest value of
30.8116 is owned by PT. Mayora Indah Tbk in
2018. High and low sales values by companies
greatly affect the level of company size. The middle
value of the company size is 20.7575 and the
standard deviation is 10.5509. The level of sales
growth is measured by taking into account the level
of sales in the following year after deducting the
total sales in the previous year divided by total sales
in the previous year having an average value of
0.0635 meaning that 6% of manufacturing
companies can meet their financial obligations with
a high level of sales growth. The lowest value of the
sales growth rate is -0.4376 owned by PT. Merck
Tbk in 2017 while the highest value of 0.8437 is
owned by PT. Impack Pratama Industri Tbk in 2015.
The middle value of the sales growth rate is 0.0457
and the standard deviation value is 0.1190.
The Effect of Financial Constraints on Cash Tax Savings
179

Table 2: Panel Data Regression Results
Variable Coefficient Std. Error t-Statistic Prob.
C 0.0144 0.0129 1.1144 0.2669
∆Z-Score 4.9908 0.0001 0.3922 0.6954
∆KZ-Index 6.6857 0.0005 0.1228 0.9024
∆ROA -0.0293 0.0747 -0.3918 0.6958
∆LnSales 0.0112 0.0006 16.818 0.0000
∆SalesGrowth -0.0497 0.0473 -1.0506 0.2952
R-Squared 0.7874
Adjusted R-squared 0.7265
Prob(F-statistic) 0.0000
N 185
Hausman Test Result
F
ixed
E
f
f
ect
*** Significant at level 1%, ** Significant at level 5%,
* Significant at level 10%
Note: This table displays the results of testing the hypothesis.
Dependent Variable: Cash Tax Savings (∆GAAP ETR).
Independent Variable: Financial Constraints (∆Z-Score, ∆KZ-
Index). Control Variables: Profitability (∆ROA), Company Size
(∆LnSales), Sales
G
r
owth (∆Sales
G
r
owth).
Source: Data processing results in Eviews 11
Based on the results of the regression analysis of
the fixed-effect model panel data in table 2, using a
significant level of 5%, the regression equation is
obtained as follows:
∆GAAPETR
i,t+1
= 0.0144+4.9908∆Z‐Score
i,t
+
6.6857∆KZ‐Indexi,t–0.0293
∆ROA
i,t+1
+0.0112∆LnSales
i,t+1
–
0.0497∆SalesGrowth
i,t+1
+e
i,t
The regression equation above shows the effect
between the independent and control variables on
the dependent variable. The definition of the
equation is that there is a constant value of 0.0144,
meaning that if financial constraints, profitability,
and company size and sales growth are constant,
then the average cash tax savings in the company is
0.0144. The regression coefficient of the financial
constraints variable measured at the prediction level
of financial distress and the constraints level related
to investment is 4.9908 and 6.6857, meaning that if
financial constraints increase by 1 unit, an increase
in cash tax savings will be increased by 4.9908 and
6.6857. Profitability variable regression coefficient
of -0.0293, meaning that if profitability increases by
1 unit it will be followed by a decrease in cash tax
savings of -0.0293. The regression coefficient of the
company size variable is 0.0112, meaning that if
company size increases by 1 unit, it will be followed
by an increase in cash tax savings of 0.0112.
Furthermore, the regression coefficient of the
variable sales growth of -0.0497, meaning that if
sales growth increases by 1 unit, it will be followed
by a decrease in cash tax savings of -0.0497.
4.3 Hypothesis Testing Results
Hypothesis testing is done using panel data
regression analysis. The selection of an appropriate
regression model is carried out using the Hausman
test through the Eviews 11 data processing
application. Based on the Hausman test, the best
regression model used is the Fixed Effect Model.
4.3.1 The Effect of Changes in Financial
Constraints on Cash Tax Savings
The hypothesis proposed in this study states that
changes in financial constraints has positive effect
on cash tax savings. This hypothesis can be
supported if the level of significance (α) <0.05. Here
are the results of the hypothesis test based on
prediction level of financial distress in this study can
be seen in table 3.
Table 3: Hypothesis Test Results (Prediction Level of
Financial Distress)
Variable Coefficient Std. Error t-Statistic Prob.
C 0.0135 0.0110 1.2323 0.2198
∆Z-Score 3.5534 4.9769 0.7139 0.4764
∆ROA -0.0293 0.0745 -0.3943 0.6939
∆
L
nSa
l
e
s
0.0112 0.0006 17.187 0.0000
∆SalesGrowth -0.0494 0.0471 -1.0487 0.2960
R-Squared
0.7874
Adjusted R-square
d
0.7283
Prob(F-statistic)
0.0000
N
185
Hausman Test Result Fixed Effect
*** Significant at level 1%, ** Significant at level 5%,
* Significant at level 10%
Note: This table displays the results of testing the
hypothesis.
Dependent Variable: Cash Tax Savings
(∆GAAP ETR).
Independent Variable: Financial Constraints
(∆Z-Score). Control Variables: Profitability (∆ROA), Company
Size (∆LnSales), Sales Growth (∆SalesGrowth).
Source: Data processing results in Eviews 11
ICAESS 2020 - The International Conference on Applied Economics and Social Science
180

Table 4: Hypothesis Test Results (Constraints Level
Related to Investment)
Variable Coefficient Std. Error t-Statistic Prob.
C 0.0116 0.0108 1.0773 0.2831
∆KZ-Index -0.0001 0.0002 -0.6079 0.5442
∆ROA -0.0294 0.0745 -0.3946 0.6937
∆LnSales 0.0113 0.0006 17.182 0.0000
∆SalesGrowth -0.0481 0.0470 -1.0236 0.3077
R-Squared 0.7872
Adjusted R-squared 0.7281
Prob(F-statistic) 0.0000
N 185
Hausman Test Result
F
ixed
E
f
f
ect
*** Significant at level 1%, ** Significant at level 5%,
* Significant at level 10%
N
o
t
e: This table displays the results of testing the hypothesis.
Dependent Variable: Cash Tax Savings (∆GAAP ETR).
Independent Variable: Financial Constraints (∆KZ-Index).
Control Variables: Profitability (∆ROA), Company Size
(∆LnSales), Sales
G
r
owth (∆Sales
G
r
owth).
Source: Data processing results in Eviews 11
Based on the results of hypothesis testing in table
3 and table 4 above shows the value of prob. Of ∆Z-
Score of 0.4764> 0.05 and ∆KZ-Index of
0.5442> 0.05 which means that the hypothesis is not
supported. This shows that changes in financial
constraints both measured at the level of prediction
of financial difficulties and the level of constraints
related to corporate investment does not have
significantly effect on cash tax savings, meaning
companies that face an increase (decrease) in
financial constraints do not necessarily carry out
cash tax savings strategies to obtain funds additional
internal company and an increase (decrease) in
financial constraints that occur in the company will
not limit the way investors to invest when the
company is increasing cash tax savings to obtain
additional internal company funds. This can happen
because cash tax savings are not classified as illegal
tax evasion.
The results of hypothesis testing based on the
prediction level of financial difficulties show the
value of profitability and sales growth as a control
variable has a significant value of 0.6939 and 0.2960
greater than the three significance levels of 1%, 5%,
and 10% while the significant value of company size
is 0.0000 less than the three levels of significance,
namely 1%, 5%, and 10%. The R-Square value from
the analysis above shows that the variation of the
dependent variable can be explained by the
independent variable, namely financial constraints
by 79% (0.7874), and the rest is explained by other
variables outside this research model.
Hypothesis testing results based on the level of
constraints related to investment show the value of
profitability and sales growth as a control variable
has a significant value of 0.6937 and 0.3077 is
greater than the three levels of significance that are
equal to 1%, 5%, and 10% while the significant
value of company size is 0.0000 less than the three
levels of significance, namely 1%, 5%, and 10%.
The R-Square value from the analysis above shows
that the variation of the dependent variable can be
explained by the independent variable, namely
financial constraints by 79% (0.7872), and the rest is
explained by other variables outside this research
model.
4.4 Data Analysis
Based on the results of hypothesis testing between
independent variables, control variables, and the
dependent variable then the summary of the
hypothesis test results can be seen in Table 5
Table 5: Summary of Hypothesis Test Results
Hypothesis Prob. t Result
Changes in
financial
H1: constraints has
positive effect on cash
tax savings
0.4764
0.7139
Hypothesis
is not
supported
0.5442
-0.6079
Description: α = 5%
Source: Self-processed
4.4.1 The Effect of Changes in Financial
Constraints on Cash Tax Savings
Based on the results of testing the hypothesis that
has been described in tables 3 and 4, the results
show that changes in financial constraints does not
have significantly effect on cash tax savings so the
hypothesis is not supported. The existence of tax
avoidance determinants also supports the results of
this study by testing based on the average
profitability of manufacturing companies listed on
the Stock Exchange with a graph that can be shown
in Figure 3
The Effect of Financial Constraints on Cash Tax Savings
181

Figure 3: Average Profitability (ΔROA) in 2014 – 2018
Source: Self-processed
Based on the graph above, it can be seen that the
value of profitability in manufacturing companies on
the Indonesia Stock Exchange during the five years
of observation mainly has increased with an average
percentage reaching 68%. This means that these
companies generally try to reduce operational costs
or reduce unnecessary costs and maximize the use of
assets owned by companies to increase profits.
Besides, the company's ability to increase profits is
also influenced by the size of the company. With the
increasing size of the company, there will be more
availability of resources that can be utilized by
managers, so that it can help the company in
optimizing the achievement of company profits.
One of the utilization of the availability of
resources by managers to determine the level of
company size is to increase sales volume. If
illustrated in graphical form, it can be seen the
average value of company size as shown in Figure 4
Figure 4: Average Company Size (ΔLnSales) in 2014 -
2018
Source: Self-processed
Based on the graph above, the value of the size
of the manufacturing companies listed on the Stock
Exchange during the five years of observation
mainly has increased with an average percentage
reaching 59%. This means that these companies
generally try to obtain greater profits by increasing
the sales the volume of a company each year. The
sales volume in the company's operational activities
can increase revenue which in turn can support the
higher the profitability of the company so that the
company will be able to determine the level of
company size.
The company's ability to increase sales growth is
also influenced by a higher level of profitability and
company size. Sales growth reflects the success of
past investment periods and can be used as a
prediction of future growth. If illustrated in
graphical form, it can be seen the average value of
sales growth as shown in Figure 5
Figure 5: Sales Growth Rate (ΔSalesGrowth)
Source: Self-processed
Based on the graph above, the value of sales
growth in manufacturing companies listed on the
Stock Exchange mainly has increased every year.
This means that these companies generally try to
increase total sales from year to year. The higher the
sales growth, the less tax avoidance activity of a
company because a company with a relatively large
level of sales makes it possible for the company to
obtain large profits and be able to pay taxes.
Companies with high sales growth will be able to
meet their financial obligations if the company funds
its investment activities with debt.
These results also support research conducted by
Putri & Chariri (2017) which states that financial
distress does not have significantly effect on tax
avoidance, meaning that the greater the
manufacturing sector companies listed on the IDX
are involved in financial distress, then it will be
smaller to the company for doing tax avoidance. In
other words, companies with large financial distress
tend to report higher taxes or obey paying taxes
(Putri & Chariri, 2017).
The results of this study differ from the results of
research conducted by Richardson, Taylor, & Lanis
ICAESS 2020 - The International Conference on Applied Economics and Social Science
182

(2015) by taking a sample of companies in Australia
stating that the financial distress has significant
positive effect on tax avoidance. This increase in
financial constraints causes the tax payments made
by companies to increase. This is because managers
more consider the risks and costs that will arise
when doing tax avoidance. When companies are in
financial constraints, investors will view tax
avoidance activities as a high-risk action. As a
result, investor concerns arise if the possibility of the
company is bankrupt or liquidated in the future,
which in turn will spend money invested by
investors in the company. If tax evasion is illegal
and known to the tax authority, it will lead to
sanctions that are even more burdensome to the
company's finances.
Companies that if declared bankrupt by the court,
the curator must settle their tax obligations first. The
tax rules applicable in Indonesia in the Law of the
Republic of Indonesia Number 16 of 2009
concerning the Fourth Amendment to the Law of the
Republic of Indonesia Number 6 of 1983 concerning
General Provisions and Tax Procedures Article 21
paragraph 1 define the position of the state as a
creditor preferring to have a prior right to debt tax
on goods owned by the Taxpayer to be auctioned in
public, while payments to other creditors are settled
after the tax debt is paid. This tax debt includes tax
principal, administrative sanctions in the form of
fines, interest, increases, and tax collection costs.
In Article 32 it is stated that the Taxpayer is
represented one of them in the case of a body
declared bankrupt by the curator, where the
representative of the Taxpayer is personally and/or
specially responsible for the payment of the tax due,
the Taxpayer is represented in terms of the body by
the management, namely, the person has the
authority to participate in determining policies
and/or making decisions in running a company, this
provision also applies to commissioners and
majority or controlling shareholders. When viewed
from these rules, the higher the risk obtained from a
tax audit if there are findings of a lack of tax
payments in the past so that the risk to be borne by
the manager, shareholders, and creditors will also be
higher.
To minimize the high level of risk, companies
must settle their tax debts to the state when the
company is nearing bankruptcy. The use of funding
from internal sources is preferred to fulfill its tax
obligations. If the use of internal funds is
insufficient, the company will use external funds
also. One form of external funding is bond issuance.
Modigliani & Miller (1963) in theory argue that the
value of a company with debt will be higher than the
value of a company without debt. The higher the
level of use of debt by companies, the level of profit
required will also increase. The existence of high-
interest costs obtained from the use of debt can
reduce the amount of tax paid.
5 CONCLUSIONS AND
SUGGESTIONS
5.1 Conclusion
Based on the results of the research conducted, the
authors can conclude that changes in financial
constraints experienced by company does not have
significantly effect on cash tax savings so that the
hypothesis is not supported. This is because the way
to obtain additional internal funds when financial
constraints occur is not to avoid taxes or save taxes.
The company will prioritize paying off all of its tax
debt to the state when the level of financial
constraints faced by the company is very high and
avoids a high level of risk if the company takes cash
tax savings.
Based on the results of the research conducted,
the authors can conclude that changes in financial
constraints experienced by company does not have
significantly effect on cash tax savings so that the
hypothesis is not supported. This is because the way
to obtain additional internal funds when financial
constraints occur is not to avoid taxes or save taxes.
The company will prioritize paying off all of its tax
debt to the state when the level of financial
constraints faced by the company is very high and
avoids a high level of risk if the company takes cash
tax savings.
5.2 Limitation
The limitation in this study is the sample in this
study is only limited to manufacturing sector
companies so it does not cover all industrial sectors
listed on the IDX. The sample data only uses 185
observations over the five years, namely from 2014-
2018 so it does not represent the existing
population. The author only uses financial
constraints as an independent variable to test its
effect on cash tax savings. This study only uses the
∆GAAP ETR proxy to measure changes in cash tax
savings and ∆Z-Score and ∆KZ-Index to measure
changes in financial constraints. Time series data
and cross- section writer use in statistical testing.
The Effect of Financial Constraints on Cash Tax Savings
183

REFERENCES
Adhikari, A., Derashid, C., & Zhang, H. (2006). Public
policy, political connections, and effective tax rates:
Longitudinal evidence from Malaysia. Journal of
Accounting and Public Policy, 25, 574–595.
Altman, E. I. (1968). Financial Ratios, Discriminant
Analysis and the Prediction of Corporate Bankruptcy.
The Journal of Finance, 23(4), 589-609.
Barbee, W., Mukherji, S., & Raines, G. (1996). Do Sales
Price and Debt Equity Explain Stock Returns Better
than Book-Market and Firm Size? Financial Analysts
Journal, 56-60.
Basuki, A. T., & Prawoto, N. (2017). Analisis Regresi
Dalam Penelitian Ekonomi & Bisnis : Dilengkapi
Aplikasi SPSS & EVIEWS. PT. Rajagrafindo Persada.
Belkaoui, A., & Karpik, P. G. (1989). Determinants of the
Corporate Decision to Disclose Social Information.
Accounting, Auditing and Accountability Journal, 36-
51.
Darussalam. (2017). Tren, Outlook, dan Tantangan Pajak
2017. IAI Global. Retrieved September 2019, 08, from
http://www.iaiglobal.or.id/v03/files/file_publikasi/Tre
n,%20Outlook,%20dan%20Tantangan%20Pajak%202
017.pdf
Donaldson, G. (1961). Corporate Debt Capacity: A Study
of Corporate Debt Policy and the Determination of
Corporate Debt Capacity. Boston: Harvard Business
School.
Edwards, A., Schwab, C., & Shevlin, T. (2013). Financial
constraints and the incentive for tax planning. In 2013
American Taxation Association Midyear Meeting: New
Faculty/Doctoral Student Session, 1-60.
Edwards, A., Schwab, C., & Shevlin, T. (2016). Financial
Constraints and Cash Tax Savings. The Accounting
Review, 91(3), 859–881.
Frank, M. Z., & Goyal, V. K. (2008). Trade-off and
Pecking Order Theories of Debt. Handbook of
Corporate Finance: Empirical Corporate Finance, 2,
135-202.
Ghozali, I. (2018). Aplikasi Analisis Multivariate dengan
Program IBM SPSS 25 Edisi 9. Badan Penerbit
Universitas Diponegoro.
Goldratt, E. M., & Cox, J. (1986). The goal : a process of
ongoing improvement. New York: North River Press.
Gupta, S., & Newberry, K. (1997). Determinants of
the
Variability in Corporate Effective Tax Rates: Evidence
from Longitudinal Data. Journal of Accounting and
Public Policy, 16(1), 1-34.
Hanlon, M., & Heitzman, S. (2010). A review of tax
research. Journal of Accounting and Economics, 50,
127-178.
Hermawan, J. E., & Riandoko, R. (2018). Do Firms
Facing Increases in Financial Constraints Tend to
Generate Cash through Tax Avoidance? Empirical
Evidence from Indonesia Publicly Listed Firms. 1-12.
doi:10.13140/RG.2.2.29077.99049
Howard, B., & Upton, M. (1952). Introduction to business
finance.
Jatmiko, D. P. (2017). Pengantar Manajemen Keuangan.
Diandra Kreatif.
Jensen, M. C., & Meckling, W. H. (1976). Theory of The
Firm: Managerial Behavior, Agency Cost, and
Ownership Structure. Jurnal of Financial Economics,
3(4), 305-360.
Kaplan, S. N., & Zingales, L. (1997). Do Investment-Cash
Flow Sensitivities Provide Useful Measure of
Financial Constraints? The Quarterly Journal of
Economics, 169-215.
Koester, A., Shevlin, T., & Wangerin, D. (2016). The Role
of Managerial Ability in Corporate Tax Avoidance.
Management Science, Articles in Advance, 1–27.
Lang, L., Ofek, E., & Stulz, R. M. (1996). Leverage,
Investment, and Firm Growth. Journal of Financial
Economics, 40(1), 3-29.
Lanis, R., & Richardson, G. (2012). Corporate social
responsibility and tax aggressiveness: An empirical
analysis. J. Account. Public Policy, 86–108.
Law, K. K., & Mills, L. F. (2015). Taxes and Financial
Constraints: Evidence from Linguistic Cues. Journal
of Accounting Research, 53(4), 777-819.
doi:10.1111/1475-679X.12081
Lindenberg, E. B., & Ross, S. A. (1981). Tobin's q Ratio
and Industrial Organization. Journal of Business,
54(1), 1-32.
Mardiasmo. (2018). Perpajakan (2018 ed.). Yogyakarta,
Indonesia: Andi.
Modigliani, F., & Miller, M. H. (1963). Corporate Income
Taxes and the Cost of Capital: A Correction. The
American Economic Review, 53(3), 433-443.
Myers, S. C. (2001). Capital Structure. Journal of
Economic Perspectives, 15(2), 81-102.
Nachrowi, N. D., & Usman, H. (2006). Pendekatan
Populer dan Praktis Ekonometrika untuk Analisis
Ekonomi dan Keuangan. Jakarta: Lembaga Penerbit
FEUI.
Najmudin. (2011). Manajemen Keuangan dan Aktualisasi
Syar'iyyah Modern. Yogyakarta: ANDI.
Poernawarman. (2015). Pengaruh Return On Asset, Sales
Growth, Asset Growth, Cash Flow, Dan Likuiditas
Terhadap Dividend Payout Ratio Perusahaan
Perbankan Di Bursa Efek Indonesia Tahun 2009 -
2013. Jom Fekom, 2(1).
Putri, R. A., & Chariri, A. (2017). Pengaruh Financial
Distress dan Good Corporate Governance Terhadap
Praktik Tax Avoidance pada Perusahaan Manufaktur.
Diponegoro Journal of Accounting, 6(2), 1-11.
Rahman, S. (1998). Theory of constraints. International
Journal of Operations & Production Management,
18(4), 336-355.
Richardson, G., Taylor, G., & Lanis, R. (2015). The
impact of financial distress on corporate tax avoidance
spanning the global financial crisis: Evidence from
Australia. Economic Modelling, 44, 44–53.
Valensia, K., & Khairani, S. (2019). Pengaruh
Profitabilitas, Financial Distress, Dewan Komisaris
Independen dan Komite Audit Terhadap Nilai
Perusahaan Dimediasi oleh Tax Avoidance. Jurnal
Akuntansi, 9(1).
ICAESS 2020 - The International Conference on Applied Economics and Social Science
184

Warta Ekonomi. Penerimaan Naik, Rasio Pajak 2018 di
Level 11,5%. (2019). Retrieved September 08, 2019,
from
https://www.wartaekonomi.co.id/read210050/penerim
aan-naik-rasio-pajak-2018-di-level-115.html
Whited, T. M., & Wu, G. (2006). Financial Constraints
Risk. The Review of Financial Studies, 19(2), 531-
559. Wiratmoko, S. (2018). The Effect of Corporate
Governance, Corporate Social Responsibility, and
Financial Performance on Tax Avoidance. The
Indonesian Accounting Review, 8(2), 245 – 257.
World Bank. Tax revenue (% of GDP). (2014-2018).
Retrieved September 08, 2019, from
https://data.worldbank.org/indicator/GC.TAX.TOTL.
GD.ZS
The Effect of Financial Constraints on Cash Tax Savings
185
