
Identification and Modeling of Factors That Cause Patient Queue
Sylvana Rianti, Ermi Girsang, Sri Wahyuni Nasution
Faculty of Medical, Universitas Prima Indonesia, Indonesia
Keywords: Patient Queue, Outpatient, Waiting Time.
Abstract: Patient queues occur in various hospitals in the world, especially in outpatients with an average waiting time
of more than 60 minutes. Long queues often occur and become a problem because of the many people who
come to wait beyond the normal limit. The purpose of this study was to identify and model the factors causing
the queue of patients from 5,898 patients with a sample of 260 respondents (accidental sampling). Data
analysis used univariate, bivariate with chi-square test, and multivariate with multiple logistic regression at
the 95% confidence level ( = 0.05) were performed. Statistical test results showed that there was an influence
of patient waiting time at registration until the call, length of time the doctor's examination, human resources
to the patient queue, p <0.05. As the most influential variable, human resource (HR) availability has a 9.6
times higher chance of inadequate HR availability. Accuracy of 91% for the design of the patient queue
variable model using SEM method for all test variables was achieved.
1 INTRODUCTION
Queuing is a common thing in daily life. Queuing is
done in many ways one of which is queuing for health
checks in health facilities such as health centers,
clinics or hospitals (Akbar & Hirawan, 2018).
Hospital queues can occur in outpatient services,
inpatient services and emergency services. Outpatient
service is the first service and is the gate of the
hospital, and is the only part of the medical service
that gives a first impression for patients as consumers
(Kakiay, 2014). In outpatient services, both new
patients and old patients will undergo a series of
service processes that can not be separated from the
queue itself, namely when waiting for a call in the
administrative, polyclinic, or while making a
redemption of drugs or payment in the cashier's
pocket (Barnhart & Laporte, 2015).
One aspect of service quality is the fast and
precise aspect. Leaving consumers waiting for no
apparent reason causes negative perceptions in
service quality (Sugiarto, 2014). Timeliness is the
suitability of medical services provided from what is
needed from time to time (Lovelock & Wright, 2012).
If all services provided have not been able to satisfy
patients this will end in a low level of patient
satisfaction, and end in a low level of patient loyalty
(Septiani, Wigati, & Fatmaasari, 2017).
In hospitals, patient queues occur as a result of
high demand for health services which means that
demand for health care services by residents exceeds
the capacity of service facilities. Queues can be fully
represented by the process of patient arrival (in) and
service provision (out) which are the main
components of each queuing system (Obulor & Eke,
2016; Turnip et al,2018).
Patient queues occur in various parts of the world,
the data obtained from several previous researchers.
Mohebbifar et al. (2014) in several clinics and
hospitals in Iran showed that the waiting time for
ophthalmology clinic outpatients with an average of
245 minutes. The orthopedic clinic has a minimum
average waiting time of 77 minutes per patient, the
average waiting time for each patient in a teaching
hospital is around 161 minutes. Musinguzi Research
(2013) at the Mulago Hospital, Uganda that patients
spend more than 5 hours waiting time, most of the
time spent in the registration and pharmacy. There are
also patients who report> 11 hours, at the beginning
of the week (Monday) increasing by about 3-4
minutes for each patient who is waiting in line.
Likewise what happened in China is that one of the
biggest complaints voiced by the Chinese community
is the amount of time needed to queue for outpatient
registration at the hospital (Yu et al., 2013).
Category of distance between waiting time and
check time which is estimated to be satisfactory or
104
Rianti, S. and Nasution, S.
Identification and Modeling of Factors That Cause Patient Queue.
DOI: 10.5220/0010289601040111
In Proceedings of the International Conference on Health Informatics, Medical, Biological Engineering, and Pharmaceutical (HIMBEP 2020), pages 104-111
ISBN: 978-989-758-500-5
Copyright
c
2021 by SCITEPRESS – Science and Technology Publications, Lda. All rights reserved

unsatisfactory for patients, among others, when the
patient comes from registering to the counter,
queuing and waiting for a call to the general poly to
be planted and examined by a doctor, nurse or
midwife for more than 90 minutes ( old category), 30-
60 minutes (medium category) and ≤ 30 minutes (fast
category) (Esti, 2015). Waiting times in Indonesia are
determined by the Ministry of Health through
minimum service standards. Every hospital must
follow this minimum service standard regarding
waiting time. The minimum standard of care in
outpatient services based on the Ministry of Health
No. 129 / Menkes / SK / II / 2008 is less or equal to
60 minutes (Kemenkes RI, 2008).
Public hospitals in major cities in Indonesia such
as Jakarta, patients can queue up at 5 in the morning.
Based on observations made between March and June
2017 in outpatients, patients queue from 9 am to 10
am queues at internal medicine clinics around 110
patients, queues at cardiac clinics around 104 patients
and lung clinics 60 patients (Dachyar, Farizal, & Yafi,
2018). Mayasari's study (2016) in the AMC Metro
RSIA clinic most of the outpatients waited for
queuing for more than 60 minutes to be served by
nurses and doctors so they felt dissatisfied, a small
portion waited less than 60 minutes.
The cause of the accumulation of queues at the
outpatient reception is the human factor, which is
slow service, the use of manual systems and patients
who often do not carry registration requirements.
Machine factor (machine), which is electricity that
often dies due to inadequate power and the use of
queue number machines that are used to speed up
service actually experience problems in operation due
to machine factors (machine error). Factor methods
(methods) namely incomplete Standard Operating
Procedures (SPO) or work procedures and the
absence of media information or communication to
patients (Sari, 2016).
The impact of long queues on hospital services
will cause patients to feel bored. As a result, patients
will go and look for other hospitals. This is
considered a loss for the organization because
patients become disloyal (Fitzsimmons &
Fitzsimmons, 2014). Long waiting times at health
centers can increase disease severity and cause socio-
economic costs. The results of several studies on the
assessment of patient satisfaction show a direct
correlation between patient satisfaction and waiting
time, and show the negative effect of long waiting
times on total patient perception of service quality
(Bahadori et al., 2014; Kusumandari et al, 2018;
Turnip et al, 2018).
The best service for patients is to provide fast
service to patients, so they don't wait too long to get
services. However, the impact of this rapid service
delivery will incur costs for organizations such as
hospitals, because they have to add expensive service
facilities and technology (Dachyar et al., 2018).
Stella Maris Hospital in Medan is a specialized
hospital that provides services for maternal and child
health. Stella Maris Medan RSIA has several
integrated polyclinics that can help serve family
health. By presenting the best doctors, as well as
medical services provided, as a form of commitment
of Stella Maris Medan Women's and Children's
Hospital to reliable health services for all maternal
and child health problems. Based on the performance
indicators achieved by the Stella Maris Hospital in
Medan in 2017, the Bed Occupancy Rate (BOR) is
80.2%, the Average Length of Stay (ALOS) is 2.7
days and the Turn Over Interval (TOI) is 1 day
whereas in 2018, the number of BOR was 72.9%,
ALOS was 2.8 days and TOI was 0.6 days (RSIA
Stella Maris, 2019a). The ideal BOR parameter value
is 60-85%, the ALOS value is between 6-9 days, the
TOI value is in the range of 1-3 days (MOH RI,
2005).
The latest data that researchers obtained from the
Stella Maris Mother and Child Hospital Medan that
the number of recurrent outpatients during the last 8
months (the period January 2019-August 2919) was
37,294 patients. While the total number of outpatients
as many as 47,179 people, namely in January 2019 as
many as 6,074 people, February 2019 as many as
5,271 people, March 2019 as many as 5,828 people,
April 2019 as many as 5,474 people, in May 2019 as
many as 5,783 people, in June 2019 as many as 5,694
people, July 2019 as many as 6,224 people, and in
August 2019 there were 6,831 people. The average
number of outpatients every month is 5,898 (RSIA
Stella Maris, 2019b). In statistical techniques we
know what is called Structural Equation Modeling
(SEM). SEM is a statistical technique that is able to
analyze the pattern of relationships between latent
constructs and indicators, latent constructs with one
another, and direct measurement errors. SEM is a
multivariate dependent statistical family. SEM allows
analysis between several dependent and independent
variables directly (Yamin, 2009).
Data analysis uses the Structural Equation
Modeling (SEM) approach using the AMOS
program. Structural Equation Modeling (SEM)
equation model based on components or variants.
AMOS can help researchers for predictive purposes.
The formal model defines latent variables as linear
aggregates of the indicators. Weight estimates for
Identification and Modeling of Factors That Cause Patient Queue
105

creating the component score of latent variables are
obtained based on how the outer model (measurement
model is the relationship between indicators and
constructs) and inner model (structural models that
connect between latent variables) (Ghazali, 2013;
Turnip et al, 2020; Wijaya et al, 2019).
In statistical techniques we know what is called
Structural Equation Modeling (SEM). SEM is a
statistical technique that is able to analyze the pattern
of relationships between latent constructs and
indicators, latent constructs with one another, and
direct measurement errors. SEM is a multivariate
dependent statistical family. SEM allows analysis
between several dependent and independent variables
directly (Yamin, 2009).
Data analysis uses the Structural Equation
Modeling (SEM) approach using the AMOS
program. Structural Equation Modeling (SEM)
equation model based on components or variants.
AMOS can help researchers for predictive purposes.
The formal model defines latent variables as linear
aggregates of the indicators. Weight estimates for
creating the component score of latent variables are
obtained based on how the outer model (measurement
model is the relationship between indicators and
constructs) and inner model (structural models that
connect between latent variables) (Ghazali 2013;
Turnip et al, 2020; Wijaya et al, 2019).
Preliminary survey conducted by researchers
conducted observations on 20 outpatients by asking
them, how long they waited for a queue in the
outpatient room. A total of 12 people said to wait less
than 1 hour (≤60 minutes) while 8 others said to wait
for a queue for more than 1 hour (> 60 minutes). They
said that they were bored and caused more time to be
consumed because they had to queue and did not
know when the time would be called for inspection.
2 METHOD
This type of research is a quantitative analytic study
with a cross sectional study design. This research was
conducted at Stella Maris Hospital in Medan in
November 2019. The study population was all
outpatients at the Polyclinic of the Stella Maris
Hospital in Medan with an average number of 5,898
people per month, and samples were 260 people. The
research sampling technique was accidental
sampling. Univariate data analysis, bivariate using
chi-square test, and multivariate using multiple
logistic regression tests with a confidence level of
95% ( = 0.05).
In this study data analysis using the Structural
Equation Modeling (SEM) approach using the
AMOS program. Structural Equation Modeling
(SEM) equation model based on components or
variants. AMOS can help researchers for predictive
purposes. The underlying reason used by SEM is
First, SEM has the ability to estimate relationships
between variables that are multiple relationships. This
relationship is formed in the structural model (the
relationship between dependent and independent
constructs). Second, it has the ability to describe the
pattern of relationships between latent (Unobserved)
and manifest variables (manifest variables or
indicator variables). In its development, processing
data for SEM analysis has become easy with the help
of several statistical software, such as Lisrel, AMOS,
and Smart PLS. The reliability test in SEM is
calculated using the following formula (Puncopo,
2015).
The variables in this study consisted of queuing
variables as exogenous variables. Human resources
and arrival as endogenous variables. Data analysis in
this study uses descriptive analysis and Structural
Equation Modeling (SEM) analysis. Descriptive
analysis aims to describe the characteristics of the
respondents studied as well as each variable so as to
give a clear picture of the patient queue. Structural
Equation Modeling (SEM) analysis is used to test the
models and relationships developed in this study.
SEM is a statistical technique used to measure
research questions that are regression or dimensional.
The data analysis technique used to discuss the
problems in this study is the Structural Equation
Model (SEM). Structural Equation Model (SEM)
models are statistical techniques that enable the
testing of a series of relatively complex relationships
simultaneously (Ghozali, 2007). Complex
relationships can be established between one or
several dependent variables with one or several
independent variables. There may also be a variable
that has a dual role, that is, as an independent variable
in a relationship, but becomes a dependent variable in
another relationship given the tiered causal
relationship. Conceptual framework or thought flow
in this study can be seen in Figure 1 which shows the
research flowchart model.
HIMBEP 2020 - International Conference on Health Informatics, Medical, Biological Engineering, and Pharmaceutical
106

Figure 1: Model diagram of the patient queue path.
3 RESULTS AND DISCUSSIONS
Characteristics of respondents most of the majority of
respondents aged <43 years were 54.6%. Based on
gender, the majority of respondents were female as
many as 52.7%. Based on education, most of the
respondents had high education as much as 78.5%,
the rest had secondary education as much as 21.5%.
Based on work, the majority of respondents work as
entrepreneurs / traders as much as 37.7%, the rest are
civil servants as much as 13.0%. Based on the reason
for the visit, the majority of respondents to the
hospital for treatment were 50.8%, the rest were for
controls (routine checks) as much as 49.2%.
Based on the results of bivariate analysis, all
independent variables are significantly related to
maternal satisfaction, namely physical evidence (p =
0,000), reliability (p = 0,000), responsiveness (p =
0,000), guarantee (p = 0,000), and empathy (p =
0,000) ), Full Chi-Square statistical test results can be
seen in Table 1.
Table 1: Relationship of Each Independent and Dependent
Variable.
Variables
Keantrian Pasien
Jumlah
p
-value
Tidak
Antri
Antri
f f F
Arrival:
On time
Not on time
121
49
109
61
51
39
46
44
172
88
155
105
0,027
Waiting time
for
registration:
Suitable
Not Suitable
0,047
Waiting Time
for Doctor
Services:
Suitable
Not Suitable
108
62
105
65
150
20
38
52
44
46
41
49
146
114
149
111
191
69
0,002
Waiting Time
for
Pharmaceutic
al Services:
Sesuai
Tidak sesuai
0,049
Human
Resources:
Adequate
Inadequate
0,000
Multivariate analysis results with multiple logistic
regression tests (Table 2) show that of the 5 variables
as model candidates, 3 variables are obtained that are
related to the cause of patient queue, namely waiting
time for registration until the call, waiting time for
doctor services and HR availability.
The variable that has the greatest relationship with
output is the HR availability variable having a value
of Exp (B) / OR = 9,618 meaning that patients who
state that human resources (HR) are adequate are
available, and the chances of patient queue being
resolved are 9.6 times higher.
Table 2: Multiple Logistic Regression Test Results
.
Variabel B Sig. Exp(B)
95% CI for
Exp(B)
Waiting time
Service time
Availability SDM
Constants
0,867
1,081
2,264
-2,024
0,007
0,001
0,000
0,000
2,380
2,946
9,618
1,272-4,452
1,584-5,480
4,965-18,630
3.1 Waiting Time Factors
Based on the results of the study showed that there
was a relationship between the time of registration
and call with the cause of the patient queue, p = 0.007
<0.05. Variable length of time of registration until the
summon has a value Exp (B) / OR = 2.380 means that
patients who state the length of time of registration
until the summon was appropriate, the patient
queuing chance was resolved by 2.3 times higher than
that which was not appropriate.
Patients or customers come to a health facility
with random, irregular time and cannot be served
immediately so they have to wait long enough. The
queue process starts when customers who need
service start coming (registration) to get health care
facilities according to their needs. They come from a
Identification and Modeling of Factors That Cause Patient Queue
107

population that is referred to as an input source. The
input source of a queuing system consists of a
population of people, goods, paperwork components
that come to the service system.
The results of this study prove that the queue or
waiting time of patients from registration to the call is
the cause of the patient queue. The average time
required by patients in the registration section is 10.57
minutes, with the fastest time (minimum) of 5.08
minutes, and the longest time is 14.59 minutes. It was
also found that the majority of patient waiting times
were appropriate ie below the average time even
though there were still 40% of respondents with
waiting times above the average time. This is due to
the large number of patient visits so they have to
queue and wait for the examination of patients who
have come first. The Hospital must strive for the
waiting time (queuing) of patients in the registration
until the calling is increased again, so that more
patients are waiting in line below the average waiting
time.
3.2 Service Time
Based on the results of the study showed that there is
a relationship between the length of time the doctor's
service and the cause of the patient queue, p = 0.001
<0.05. The length of time the doctor's service variable
has the value Exp (B) / OR = 2,946 means that
patients who state the length of time the doctor's
service is appropriate, the patient queuing chance is
resolved by 2.9 times higher than that which is not
appropriate.
The results of this study prove that the length of
time a patient's health examination by a doctor is one
of the causes of patient queue. If seen from the
waiting time or the average doctor's service time the
patient is 16.58 minutes exceeding the standard
average waiting time which is 15 minutes. The
shortest service time is 8.59 minutes while the longest
service time is 29.54 minutes. As many as 56.2% of
patients get appropriate services in the sense that less
than 15 minutes get doctor's services, while the other
43.8% get services more than 15 minutes.
Doctor's examination in outpatients also depends
on the patient's condition at the time of the
examination, whether the patient has a disease in the
category of mild, moderate or severe. A quick and
thorough examination requires a longer time,
especially for patients who come with moderate and
severe disease, whereas patients with mild illness
conditions, the examination is carried out with a faster
time.
3.3 Availability
Based on the results of the study showed that there is
a relationship between the availability of human
resources (HR) with the cause of the queue of patients
at Stella Maris Hospital in 2019, p = 0,000 <0.05.
Variable availability of human resources has a value
of Exp (B) / OR = 9,618 meaning that patients who
claim the availability of adequate human resources
have a chance of queuing for patients to be 9.6 times
higher than patients who claim the availability of
human resources is inadequate.
The results of this study prove that human
resources were related to the patient queue. The
sufficient number of employees in the registration
section has an impact on reducing the number of
queues in the registration section. Human resources
or officers who work skillfully and skillfully will be
able to make the queue not pile up. Likewise friendly
and communicative officers make it easy for patients
to understand the stages of service. As many as 73.5%
of respondents stated that human resources in the
registration section were sufficient. Respondents who
said that HR was inadequate because they had to wait
longer, especially in the registration until the
summons. For this reason, the hospital must innovate
by providing free wifi for all visitors, especially
outpatients so that when waiting in line, they can
spend time surfing the internet. In addition, the
Hospital must provide regular training to each
employee in the registration section so that the ability
and competency of employees increases.
3.4 Modeling using SEM
Figure 2 showing the model after analysis and
modification, the chi-square value of 196,714 with a
p-value greater than the specified criteria (0.0477
<0.05), so that the overall fit size of the model based
on the chi-square value has a good matching level.
RMSEA value of 0.028 (close fit 0.05 good fit 0.08
bad fit) with a p-value of .0477 <0.05 and the
RMSEA value is within 90 percent confidence
interval for RMSEA of 0.020; 0.083, so the RMSEA
is in good precision. Differentiate the results of the
RMSEA match size to have a good fit.
Indicators on the arrival variable are X1.1, X1.2,
X1.3, X1.4, and X1.5. Shows the results of the biggest
value loading factor of 1.47 indicated by the value of
X1.5 to the arrival variable. this shows that the X1.5
variable has a greater influence than the other
variables on the arrival variable. It can also be
concluded that to find out the patient's flow in the
hospital, X1.5 is a very important factor.
HIMBEP 2020 - International Conference on Health Informatics, Medical, Biological Engineering, and Pharmaceutical
108
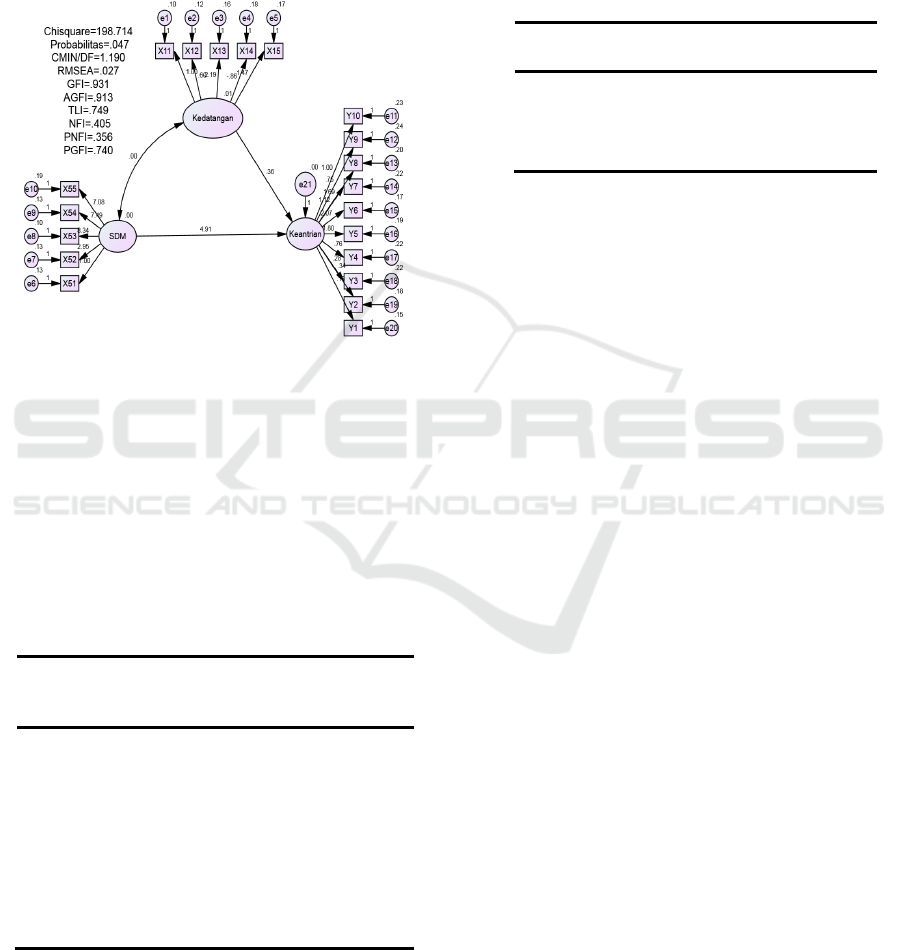
Indicators on the HR variable are X5.1, X5.2,
X5.3, X5.4, and X5.5. Shows the results of the biggest
value loading factor of 8.34 indicated by the value of
X5.3 to the HR variable. this shows that the X5.3
variable has a greater influence than the other
variables on the arrival variable. It can also be
concluded that to find out the patient's flow in the
hospital, X5.3 is a very important factor.
Figure 2. Patient Queue Model
Evaluation of the model is done through
suitability and statistical tests, and reliability testing.
In the suitability and statistical tests carried out by
using several Fit Indexes to measure the truth of the
proposed model. The results of the evaluation of each
of the modified models are compared with the
statistical limits set in the SEM procedure. The results
of the Goodness Of Fit Indexes test in this study are
as follows:
Table3: Recapitulation of Goodness Evaluation (Fit)
Criteria Fit Cut of
Value
Results Evaluation
Chi Square
0
198,71
4
Fit
Probability < 0,05 0,047 Fit
CMIN/DF < 2,00 1,190 Fit
GFI
1
0,931 Fit
RMSEA < 0,08 0,027 Fit
NFI
1
0.845 Fit
Based on the Table 3 it is known that the
Goodness of Fit Indexes values of this research model
of all the criteria have been fulfilled well, so it can be
concluded that the created model was in accordance
with the observation data.
This hypothesis test was conducted to determine
whether or not exogenous variables affect
endogenous variables. This hypothesis can be
accepted if the probability value is P> 0.05 and the
Critical Ratio (CR) value <1.96.
Table 3: Regression Weights Estimates Software AMOS.
C.R. P
Queue <--- HR .688 .492
Queue <--- Arrival .937 .349
Basis of Decision: If the Probability value (P)>
0.05 then the hypothesis can be accepted, If the
Probability value (P) <0.05 then the hypothesis can
be accepted. Based on the table above obtained
information from the results of hypothesis testing
from HR and arrival to queue has a value of P> 0.05,
then the hypothesis can be accepted. So it can be said
that there is a positive and significant effect between
HR and the arrival of the patient queue at the hospital.
4 CONCLUSIONS
Physical evidence, reliability, responsiveness, and
empathy influence on maternal satisfaction while
guarantee variables have no effect. The most
influential variable in this study is the responsiveness
variable which has a value of Exp (B) / OR = 7,985
meaning that the mother who states the
responsiveness of the hospital is good, have a 7.9
times higher chance of being satisfied with pregnancy
and childbirth services.
The results of the SEM study show that there is a
relationship between the length of time the doctor's
service and the cause of the patient's queue. The
hospital is seen from the value of p = 0.349> 0.05. If
seen from the average patient waiting time or doctor's
service time which is 16.58 minutes exceeding the
standard average waiting time which is 15 minutes, a
fast and thorough examination is needed by the
hospital for the efficiency of doctor's service time so
as to reduce the patient queue length in the hospital .
There is a relationship between the availability of
human resources (HR) and the causes of queues in
hospital patients with a value of p = 0.492> 0.05. This
proves that human resources at the hospital are related
to the occurrence of patient queues. In this case a
Identification and Modeling of Factors That Cause Patient Queue
109

sufficient number of employees can affect the speed
of the patient registration process. In addition, the
hospital must make innovations by providing
convenient facilities for all visitors, especially
outpatients so that when waiting in line patients still
feel relaxed.
REFERENCES
A.M. Bruin, R. Bekker, L. Zanten, G.M. Koole
Dimensioning hospital wards using the Erlang loss
model Ann Oper Res, 178 (2010), pp. 23-43
Adeleke, R. A., Ogunwale, O.D. and Halid, O.Y. (2009),
Application of Queuing Theory to Waiting Time of
Out-Patients in Hospitals, The Pacific Journal of Science
and Technology, 10 (2): 270-274.
Akbar, W. F., & Hirawan, D. (2018). Rancang Bangun
Sistem Pencegahan Penumpukan Pasien Berbasis
Internet Of Things. Universities Komputer Indonesia.
Bahadori, M., Mohammadnejhad, S. M., Ravangard, R., &
Teymourzadeh, E. (2014). Using queuing theory and
simulation model to optimize hospital pharmacy
performance. Iranian Red Crescent Medical Journal,
16(3), e16807.
Barnhart, C., & Laporte, G. (2015). Handbook in
Operations Research and Management Service. USA:
Elsiever.
Bustani, N. M., Rattu, A. J., & Saerang, J. S. M. (2015).
Analisis Lama Waktu Tunggu Pelayanan Pasien Rawat
Jalan Di Balai Kesehatan Mata Masyarakat Propinsi
Sulawesi Utara. Jurnal E-Biomedik, 3(3), 872-883.
https://doi.org/10.35790/ebm.3.3.2015.10456
Dachyar, M., Farizal, & Yafi, M. M. (2018). Analysis of
Outpatient Service Queue of Public Hospital in Jakarta.
MATEC, 248(2), 1-5.
Depkes RI. (2005). Indikator Kinerja Rumah Sakit. Jakarta:
Departemen Kesehatan Republik Indonesia.
Esti, A. (2015). Pengaruh Waktu Tunggu dan Waktu
Sentuh Pasien terhadap Tingkat Kepuasan Pasien Poli
Umum di Puskesmas Sukorame Kota Kediri. Prodi
Kesmas Stikes Strada.
F. Gorunescu, S.I. McClean, P.H. Millard
A queueing model for bed-occupancy management and
planning of hospitals J Oper Res Soc, 53 (1) (2002), pp.
19-24
Fitzsimmons, J. A., & Fitzsimmons, M. J. (2014). Service
Management: Operations, Strategy, Information
Technology. New York: McGraw-Hill.
Hill-Smith, I. (1989), Mathematical Relationship Between
Waiting Times and Appointment Interval for Doctors
and Patients, Journal of the Royal College of General
Practitioners, 39 (329): 492-494.
Hospital statistics, 1976, 1981, 1991–2010 editions.
Chicago, IL. (Copyrights 1976, 1981, 1991–2010).
<http://www.cdc.gov/nchs/data/hus/2010/104.pdf>,
<http://www.cdc.gov/nchs/data/hus/2010/113.pdf>.
Husnan, S. (2015). Teori Antrian. Arti dan Kegunaannya
bagi Management (Cetakan 4). Yogyakarta: Bhakti
Profesindo (BPFE).
Kakiay, T. J. (2014). Dasar Teori Antrian untuk Kehidupan
Nyata (Cetakan 2). Yogyakarta: Andi Offset.
Kemenkes RI. (2008). Keputusan Menteri Kesehatan
Republik Indonesia Nomor 129 tentang Standar
Pelayanan Minimal Rumah Sakit. Jakarta: Kementerian
Kesehatan Republik Indonesia.
Kusumandari, D., Risqyawan, M., Yazir, M., Turnip, M.,
Darma, A. and Turnip, A., 2018. Application of
convolutional neural network classifier for wireless
arrhythmia detection, Journal of Physics: Conference
Series, Volume 1080 (2018) 012048 doi:
10.1088/1742-6596/1080/1/012048.
Laeliyah, N., & Subekti, H. (2017). Waktu Tunggu
Pelayanan Rawat Jalan dengan Kepuasan Pasien
Terhadap Pelayanan di Rawat Jalan RSUD Kabupaten
Indramayu. Jurnal Kesehatan Vokasional, 1(2), 102.
https://doi.org/10.22146/jkesvo.27576
Lakshmi, C and Sivakumar, A.I. (2013), Application of
Queuing Theory in Healthcare: A Literature Review,
Operations Research for Healthcare, 2 (1-2): 25-39.
Lovelock, C. H., & Wright, L. K. (2012). Principles Service
Marketing and Management (2nd Editio). New Jersey:
Pearson Education.
Mayasari, F. (2016). Analisis Hubungan Waktu Pelayanan
dan Faktor Total Quality Service Terhadap Kepuasan
Pasien di Poliklinik Kebidanan dan Kandungan RSIA
Anugerah Medical Centre Kota Metro Tahun 2015.
Jurnal ARSI, 2(3), 214-230.
Mohebbifar, R., Hasanpoor, E., Mohseni, M., Sokhanvar,
M., Khosravizadeh, O., & Mousavi Isfahani, H. (2014).
Outpatient waiting time in health services and teaching
hospitals: a case study in Iran. Global Journal of Health
Science, 6(1), 172-180.
Musinguzi, C. (2013). Patient waiting time and associated
factors at the Assessment Center, General out-patient
Department Mulago Hospital Uganda (Masters of
Health Services Research).
Nadeak, S. (2016). Analisis Antrian Pasien Instalasi Rawat
Jalan Poliklinik Lantai 1 Dan 2 RSUD Cengkareng,
Jakarta. Jurusan Statistika Fakultas Sains Dan
Matematika Universitas Diponegoro.
Nugraheni, R. (2017). Gambaran Waktu Tunggu Pasien dan
Mutu Pelayanan Rawat Jalan di Poli Umum UPTD
Puskesmas Pesantren 1 Kota Kediri Tahun 2017. Jurnal
Wiyata, 4(2), 165-172.
Obulor, R., & Eke, B. O. (2016). Outpatient Queuing Model
Development for Hospital Appointment System.
International Journal of Scientific Engineering and
Applied Science, 2(4), 15-22.
RSIA Stella Maris. (2019a). Data Laporan Kinerja RSIA
Stella Maris Medan Tahun 2017-2018. Medan.
RSIA Stella Maris. (2019b). Data Pegawai dan Kunjungan
Rawat Inap di RSIA Stella Maris Medan Tahun 2019.
Medan.
Sari, D. M. (2016). Analisis Penyebab Penumpukan
Antrian Pasien Di Tempat Penerimaan Pasien Rawat
HIMBEP 2020 - International Conference on Health Informatics, Medical, Biological Engineering, and Pharmaceutical
110

Jalan Di Puskesmas Playen I Gunung Kidul
Yogyakarta. Universitas GAdjah Mada Yogyakarta.
Septiani, A. S., Wigati, P. A., & Fatmaasari, E. Y. (2017).
Gambaran Sistem Antrian Pasien Dalam Optimasi
Pelayanan Di Loket Pendaftaran Instalasi Rawat Jalan
Rumah Sakit Umum Pusat Fatmawati. Jurnal
Kesehatan Masyarakat (e-Journal), 5(4), 1-14.
Sugiarto, E. (2014). Psikologi Pelayanan Dalam Industri
Jasa (Cetakan 2). Jakarta: Gramedia Pustaka Utama.
Turnip, A., Andrian, Turnip, M., Dharma, A., Paninsari, D.,
Nababan, T., Ginting, C.N., 2020. An application of
modified filter algorithm fetal electrocardiogram
signals with various subjects, International Journal of
Artificial Intelligence, vol. 18, no., 2020.
Turnip, A., Ilham Rizqywan, M., Kusumandari, D., et al.,
2018. Classification of ECG signal with Support Vector
Machine Method for Arrhythmia Detection, Journal of
Physics: Conference Series, Vol. 970 (2018) 012012
doi: 10.1088/1742-6596/970/1/012012.
Turnip, A., Kusumandari, D., Pamungkas, D., 2018. Drug
Abuse Identification based EEG-P300 Amplitude and
Latency with Fuzzy Logic Calssifier, IEEE
International Conference on Applied Engineering,
(ICAE), 3-4 Oct. 2018, DOI:
10.1109/INCAE.2018.8579378.
Wijaya, C., Andrian, M., Harahap, M., Turnip, A., 2019.
Abnormalities State Detection from P-Wave, QRS
Complex, and T-Wave in Noisy ECG, Journal of
Physics: Conference Series, Volume 1230, (2019)
012015. doi:10.1088/1742-6596/1230/1/012015.
Yu, W., Yu, X., Hu, H., Duan, G., Liu, Z., & Wang, Y.
(2013). Use of hospital appointment registration
systems in China: a survey study. Global Journal of
Health Science, 5(5), 193-201.
Zhu, Z., Heng, B.H. and Teow, K.L. (2012), Analysis of
Factors Causing Long Patient Waiting Time and Clinic
Overtime in Outpatient Clinics, Journal of Medical
Systems, 36 (2): 707-713.
Identification and Modeling of Factors That Cause Patient Queue
111
