
Urban Traffic Jam Time Prediction Mode
Zhixu Gao
1, a, *
, Guyue Tian
2, b
, Fengsi Yu
2, c
1
School of physics and electronic information, Yunnan Normal University, Yunnan 650500, China
2
College of Science, Chongqing University of Technology, Chongqing, 401320, China
Keywords: Survival analysis model; Traffic congestion; Predictive model.
Abstract: Urban transportation is the core of urban social activities and economic activities. However, due to the
increase of population and motor vehicles, traffic congestion is caused by many factors. This paper established
a traffic congestion duration model based on survival analysis. The purpose is to use the model to obtain the
relationship between congestion index and congestion time, and improve the accuracy of prediction. Using
the nonparametric method to calculate, after defining the Shanghai Expressway survival function and risk
function, combined with the compiled data, calculate whether it is the impact of the working day on traffic
congestion, and the difference between the early, middle and late peaks for traffic congestion. The result can
be obtained: Traffic congestion on workdays is higher than on weekends, and traffic congestion is longer than
weekends.
1 INTRODUCTION
With the development of technology, people's
transportation is more convenient and intelligent.
Existing navigation software typically acquires real-
time GPS data through a taxi or vehicle in which the
software is installed to determine current road
conditions. Many navigation softwares have
introduced smart travel features to help people plan
the best route for travel and predict travel time. The
predictive congestion principle of navigation is to use
the speed prediction algorithm to calculate the vehicle
speed, and to update the timing according to the
driving information of the car, and then re-calibrate
and calculate. (Zhu Fuling, 2006)
However, with the increasing number of cars,
traffic congestion in cities is becoming more and
more serious, and traffic jams in urban traffic often
occur. (You Zhaoquan, 2018) Therefore, it is
practical to improve the prediction accuracy of
navigation through mathematical methods. It can
provide a guiding plan for the development of traffic
congestion control and guidance strategies. (Xiong
Li, Lu Yue, Yang Shufen, 2017)
2 DATA COLLECTION
We consult the relevant literature to collect the GPS
information of 10,000 taxies in Shanghai city on April
20,2017 (Shanghai Traffic Travel Network, 2019).
Since the data is too large, we sort out some of the
data in the table below. Please check the detailed data
in supporting documentation in appendix. The
following gives data analysis for taxies in Shanghai.
As can be seen from the table 1, the data we collected
included the latitude and longitude and instantaneous
travel speed of each tax
3 MODEL BASED ON SURVIVAL
ANALYSIS OF TRAFFIC
CONGESTION DURATION
Survival analysis is a statistical method that analyzes
and infers the survival time of living things, people,
and other things like survival rules based on
experimental or survey data. It is also called risk rate
model or continuous model. The survival analysis
methods mainly include three methods: parametric
method, semiparametric method and nonparametric
method. When the distribution type is unknown, the
nonparametric method has higher computational
efficiency.
38
Gao, Z., Tian, G. and Yu, F.
Urban Traffic Jam Time Prediction Mode.
DOI: 10.5220/0010019600380041
In Proceedings of the International Symposium on Frontiers of Intelligent Transport System (FITS 2020), pages 38-41
ISBN: 978-989-758-465-7
Copyright
c
2020 by SCITEPRESS – Science and Technology Publications, Lda. All rights reserved

3.1 Establishment of Model
3.1.1 Traffic Congestion Probability
Distribution
According to the probability statistics, the probability
distribution of the capital vehicle is represented by a
distribution function, and the function is as follows.
0
t
Ft PT t f xdx
0
lim
t
dF t P t t t
fx
dt t
,
Where
Ft
represents distribution function,
P
represents probability,
T
Indicates the duration of
traffic congestion,
f
x
Indicates the probability
density of the moment.
3.1.2 Calculation of Congestion Duration
Survival Function
The congestion duration survival function is
expressed as a survival rate, which indicates the
probability that the congestion duration is greater
than, and its expression is as follows. When the
survival probability is low, the survival curve is steep.
When the survival probability is high, the survival
curve is flat.
1-
t
s
tPTt fxdx Ft
3.1.3 Traffic Congestion Risk Function
The risk function refers to the probability that traffic
congestion does not disappear after the moment
occurs, but disappears in a very small time period
t
, also called the conditional survival probability. The
risk function can also be expressed by the distribution
function
Ft
and the probability density function
f
t
. The formula is as follows:
0
lim
1-
t
Pt T t tT t
f
tft
d
ht st
tstdF
t
The cumulative risk function curve is obtained by
integrating the risk function. The higher the position,
the higher the probability of ending the traffic
congestion event in Δt.
3.1.4 Nonparametric Kaplan
Meier
Method
Suppose there are n traffic congestion duration
samples, the duration period has k different values,
and they are directly arranged from small to large
12 k
tt t
. The survival function of the traffic
congestion duration is the estimation function of
st
as shown in equation:
j
j
j
tt
j
nd
st
n
Where
j
n
is the number of samples that existed
before the moment
j
t
, that is, the sample size that
traffic congestion continues to be;
j
d
is the number of
samples for which congestion has ended during this
unit time period
j
t
;
j
j
j
nd
n
is the probability of
survival for the moment
j
t
.
In this practice, the survival function has a simple
estimation method because there is no censored data.
Since the congestion duration in this paper is a
complete sample, that is, the exact congestion
duration is known during the observation time, there
is no censored data. Therefore, the survival function
can be estimated by the proportion of the number of
samples whose congestion duration is longer than
t
:
ˆ
t=
t
S
Here
ˆ
tS
is an estimate of
tS
, indicating the
probability that the congestion duration is longer than
t
if a congestion event has occurred. The risk
probability formula is expressed as follows:
ˆ
A
C
ht
Bt B
Then get the average risk rate: the number of
samples ending in the unit time interval of a unit
divided by the number of samples in the interval
Urban Traffic Jam Time Prediction Mode
39
where the conceptual congestion does not end, the
formula is as follows:
ˆ
h
1
-
2
A
t
BD
Where A is Number of samples ending in
congestion at the beginning of time T; B is Number
of samples with no congestion after time T; C is
Number of samples congested per unit time after time
T; D is Number of samples ending in the interval.
t
is Interval width.
3.2 Result of the Model
Calculate the survival function of Shanghai working
days and weekends based on the existing data as
shown in Fig1. (Si Sukui, 2011)
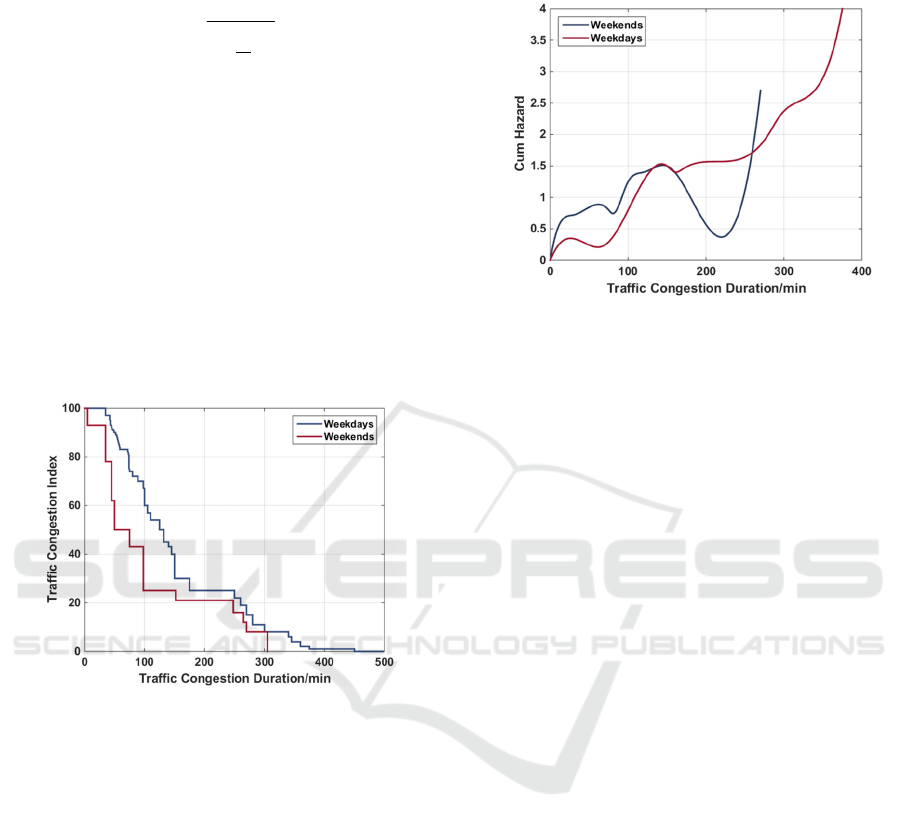
Fig 1: Traffic congestion index.
By calculating the survival function of weekdays
and weekends
=0.0039p
, it is shown that both are
significant. Known from Fig 1. The working day
survival function is above the weekend survival
function, indicating that the traffic congestion
frequency on the working day is higher than the
weekend, and the traffic congestion duration is longer
than the weekend. On weekends, the traffic
congestion duration is 85.4% within 250min. The
traffic congestion is likely to end at the end of the
traffic congestion period. The traffic congestion is
less likely to be exceeded. The working day traffic
congestion duration is less than 300min. %, the traffic
congestion is more likely to end the congestion
period, and the possibility of traffic congestion is less
than the duration. To further compare the difference
in traffic congestion duration between weekends and
weekdays, we compare the risk function based on the
traffic congestion duration model of survival analysis,
as shown in Fig 2.
Fig 2: Survival coefficient.
It can be seen from the Fig 2 that when the traffic
congestion duration is between 0 and 165 min or
greater than 275 min, the risk function of the working
day is less than the weekend risk function, indicating
that when the traffic congestion duration is within the
interval, the same congestion duration, It is easier to
end the congestion on weekends. When the
congestion duration is less than 165min or greater
than 275min, the risk function of the weekend is less
than the working day. Under this condition, the
working day is more likely to end the congestion
under the same traffic congestion duration. This is
consistent with the working day due to commuting
travel demand.
4 CONCLUSION
A traffic congestion duration model based on survival
analysis is established. The purpose is to use the
model to obtain the relationship between congestion
index and congestion time, and improve the accuracy
of prediction. Using the nonparametric method to
calculate, after defining the Shanghai Expressway
survival function and risk function, combined with
the compiled data, calculate whether it is the impact
of the working day on traffic congestion, and the
difference between the early, middle and late peaks
for traffic congestion. Get: Traffic congestion on
workdays is higher than on weekends, and traffic
congestion is longer than weekends. The traffic
congestion in the afternoon peak and the evening
peak is longer than the early peak. The traffic
congestion in the afternoon peak actually lasts until
the evening peak.
FITS 2020 - International Symposium on Frontiers of Intelligent Transport System
40

REFERENCES
Shanghai Traffic Travel Network. Interpretation of Traffic
Index [EB/OL].htt p://www. j tcx.sh.cn/zhishu/ j
iedu.html,2019-11-22
Si Sukui. Mathematical Modeling Algorithm and
Application [M]. National Defense Industry Press,
2011.
Xiong Li, Lu Yue, Yang Shufen. Study on Urban Road
Traffic Congestion Prediction and Duration[J].
Highway,2017,62(11):125-134.
You Zhaoquan. Research on Traffic Congestion Prediction
Based on Hadoop Big Data Platform [D]. Chinese
People's Public Security University, 2018.
Zhu Fuling. Research on Urban Road Traffic Congestion
Evaluation Index System [D]. Southeast University,
2006.
Urban Traffic Jam Time Prediction Mode
41
