
Phytochemical Screening of Phenolic Levels from Extracted Bitter
Mustard Leaves (Brassica Juncen L. Czern.) using UV-Visible
Spectrophotometer
Fahma Shufyani
1
, David Ginting
1
, Jhon Patar Sinurat
1
, Tika Afriani
2
, Muhammad Mabrur
1
, Ritmah
Syah Putri
1
1
Faculty of Pharmacy, Institut Kesehatan Medistra Lubuk Pakam, Sumatera Utara, Indonesia,
2
Department of Pharmacy, Mohammad Natsir University, Bukittinggi 26136, Indonesia
Keywords: Bitter Mustard, Brassica Juncea, Phenolic, Folin Ciocalteu and UV-Visible Spectrophotometer
Abstract: To determine the total phenolic content of the ethyl acetate extract of bitter mustard leaf. To determine the
total phenolic levels, the Folin – Ciocalteu method with gallic acid comparison compounds using ethyl
acetate solvents using UV-Visible spectrophotometer is expected to provide information and scientific
evidence to develop new medicines from this plant. Antioxidants are inhibitors of oxidation reactions due to
free radicals that can cause damage to unsaturated fatty acids, cell wall membranes, blood vessels, DNA
bases, and lipid tissue causing disease. Phytochemical screening was using FeCl
3
5% to identify phenolic
compound. Total phenolic is gotten by many process such maceration and partition. Analysis of total
phenolic was doing by TLC analysis. Total phenolic was analysed on plate of thin layer chromatography
with used chloroform and methanol with 70:30 comparison. Antioxidant test was measured by UV-Visible
spectrophotometer at 516 nm wavelength. Bitter mustard leaf extract contains phenolic compounds based on
phytochemical screening results. Weight total phenolic content o 39.7252 ± 0.7326 mg GAE/g extract, the
total phenol content determined according to the Folin-Ciocalteu medthod is not an absolute level, but
principally based on the reduction capacity of the material being tested against an equivalent reduction of
gallic acid. Calibration curve measurement with a concentrations of 200, 225, 250, 275 and 300 μg/ml. All
solutions were measured at a wavelength of 739.50 nm. Phytochemical screening results show that the
extract of bitter mustard leaf (Brassica juncea L.), contains chemicals, flavonoids, tannins, saponins,
glycosides, steroids / triterpenoids, anthraquinone and polyphenols. The acetyl extract of bitter mustard leaf
has a total phenolic activity value (39.7252 ± 0.7326) mg GAE / g extract. Penol compounds are susceptible
to oxidation at higher temperature in extractions that are to long can provide opportunities for phenol
compounds to oxidize more, but measured total phenol levels can be lower.
1 INTRODUCTION
Brassica juncea L. commonly known as Indian
mustard belongs to family brassicaceae. B. juncea is
an economically important plant widely used as an
oil source, a green vegetable and also having a
medicinal value. This species has been described in
traditional remedies in the ancient literature
(Manohar et al., 2009). Indian mustard is consumed
as leafy vegetable and is a source of various
micronutrients as well as antioxidants, vitamin c and
e, β-carotenoids etc. B. juncea is believed as eco-
friendly source for various nutraceuticals or drugs
which are used to prevent and cure of wide range of
non-communicable diseases in present time (Kumar
et al., 2011). Food preparation of Indian mustard
leaves is helpful in lowering the cost for diabetic
patients suffering with comorbid anxiety disorders
(Thakur et al., 2013). Plants of genus Brassica are
also known for the production of various volatile
organic compounds like ketones, aldehydes, esters,
alcohols, terpenes and glucosinolates.
The leaves of B. juncea are utilized to produce
medicines which act as stimulants, diuretics and
expectorants (Farrell et al., 1985). Indian mustard is
also known for its therapeutically pharmacological
uses due to its active bio-constituents (Kumar et al.,
2011). Glucosinolates and isothiocyanates are
reported to be very active in B. juncea (Hill et al.,
1987; McNaughton and Marks, 2003) which act as
anti-cancerous and anti-microbial compounds
(Luciano and Holley, 2009; Okulicz, 2010; Zhang et
Shufyani, F., Ginting, D., Sinurat, J., Afriani, T., Mabrur, M. and Putri, R.
Phytochemical Screening of Phenolic Levels from Extracted Bitter Mustard Leaves (Brassica juncen L. Czern.) using UV-Visible Spectrophotometer.
DOI: 10.5220/0009973605070514
In Proceedings of the International Conference on Health Informatics and Medical Application Technology (ICHIMAT 2019), pages 507-514
ISBN: 978-989-758-460-2
Copyright
c
2020 by SCITEPRESS – Science and Technology Publications, Lda. All rights reserved
507

al., 2010). Leaves of Indian mustard were also
reported to have anti-depressant effects during
diabetes (Thakur et al., 2014). The presence of
different brassinosteroids namely castasterone,
teasterone, 24-epibrassinolide and typhasterol have
been reported from B. juncea (Kanwar et al., 2015).
Indonesia has the potential to grow vegetables.
Among the various types of vegetables that can be
cultivated, mustard (Brassica juncea L.) is one of the
vegetables that has commercial value and high
prospects. Mustard greens include leaf vegetable
plants from the Cruciferae family or cabbage plants
which have high economic value because it is rich in
fiber, high in nutritional content and has medicinal
properties. Some of the results of epidemiological
studies, it is known that eating vegetables from the
genus Brassica can reduce the risk of several types
of cancer, namely breast, prostate, kidney, colon,
bladder and lung cancer. Vegetables included in the
Brassicaceae tribe are mustard greens, bitter mustard
greens, cabbage, broccoli (Sulihandari, 2013).
Antioxidants are the ability to capture free
radicals. Radicals contained in biological systems
can oxidize nucleic acids, proteins, lipids or DNA
and cause degenerative diseases. Antioxidant
components found in plants such as phenolic acids,
polyphenols and flavonoids will capture free radicals
such as peroxide, hydroperoxide or peroxyl lipids
and also inhibit oxidative mechanisms that cause
degenerative diseases (Prakash, 2001). Extraction is
needed to obtain the desired compound in the bitter
mustard greens. Selection of the right solvent can
increase extraction efficiency. Things that need to be
considered in the selection of solvents include
selectivity, toxicity, polarity, ease of evaporation and
the price of solvents. Ethyl acetate is a solvent with
low toxicity that is semi-polar so it is expected to
attract polar and nonpolar compounds from bitter
mustard leaves (Akbar, 2010). Phytochemical
screening needs to be done to determine the class of
compounds contained in the extract used. In this
study phytochemical screening was conducted to see
the class of compounds in the ethyl acetate extract of
bitter mustard leaves so that it can also be known the
ability of the ethyl acetate solvent to attract
compounds contained in bitter mustard leaves
(Akbar, 2010).
Phenolic compounds are natural compounds
which are widely used at present. Its ability as an
active biological compound gives a large role to
human interests. One of them is as an antioxidant,
for the prevention and treatment of degenerative
diseases, cancer, premature aging and immune
system disorders in the body (Apsari, 2011). This
study aims to determine the total phenolic content of
the ethyl acetate extract of bitter mustard leaves. To
determine the total phenolic content, the Folin-
Ciocalteu method with gallic acid comparison
compound using ethyl acetate solvent using UV-
Visible Spectrophotometer is expected to provide
information and scientific evidence to develop new
medicines from this plant (Andarwulan, 2012).
2 METHOD
Place of research, The extract making is carried out
in Chemical laboratory, at Pharmacy Faculty,
Institut Kesehatan Medistra Lubuk Pakam. Research
time, This research is carried out on the month (May
2019 to September 2019). Material, Fresh bitter
mustard leaves, ethyl acetate extract from bitter
mustard leaf. Gallic acid, Hydrochloric acid,
Sulfuric acid, Iron (III) chloride, Sodium carbonate,
Sodium hydroxide, Mayer reaents, Bouchardate
reagents, Liebermann reagents Burchard, Folin –
Ciocalteau reagents and Methanol. Equipment:
Beaker Glass, Macerator, Separate Funnel (Schoot
Duran), Rotary evaporator (Heidolph), Steaming
waterbath (Memmert), TLC plate, Chamber,
Incubator (Memmert) and UV-Visible
Spectrophotometer (Shimadzu. Sample Processing,
this research was carried out sequentially in
laboratory with the following research scheme.
Process started from maceration and screening test,
then continued to evaporate solvent. Solid extract is
soluted by water to remove the lipid. Then filtrated
the fraction that soluted in water. Filtrate is partitied
using ethyl acetate conducted partition using n-
hexane by separate funnel. TLC is done to analysis
of total phenolic compound and measure of
antioxidant activity. The scheme of research is
showed in Figure 2.
ICHIMAT 2019 - International Conference on Health Informatics and Medical Application Technology
508
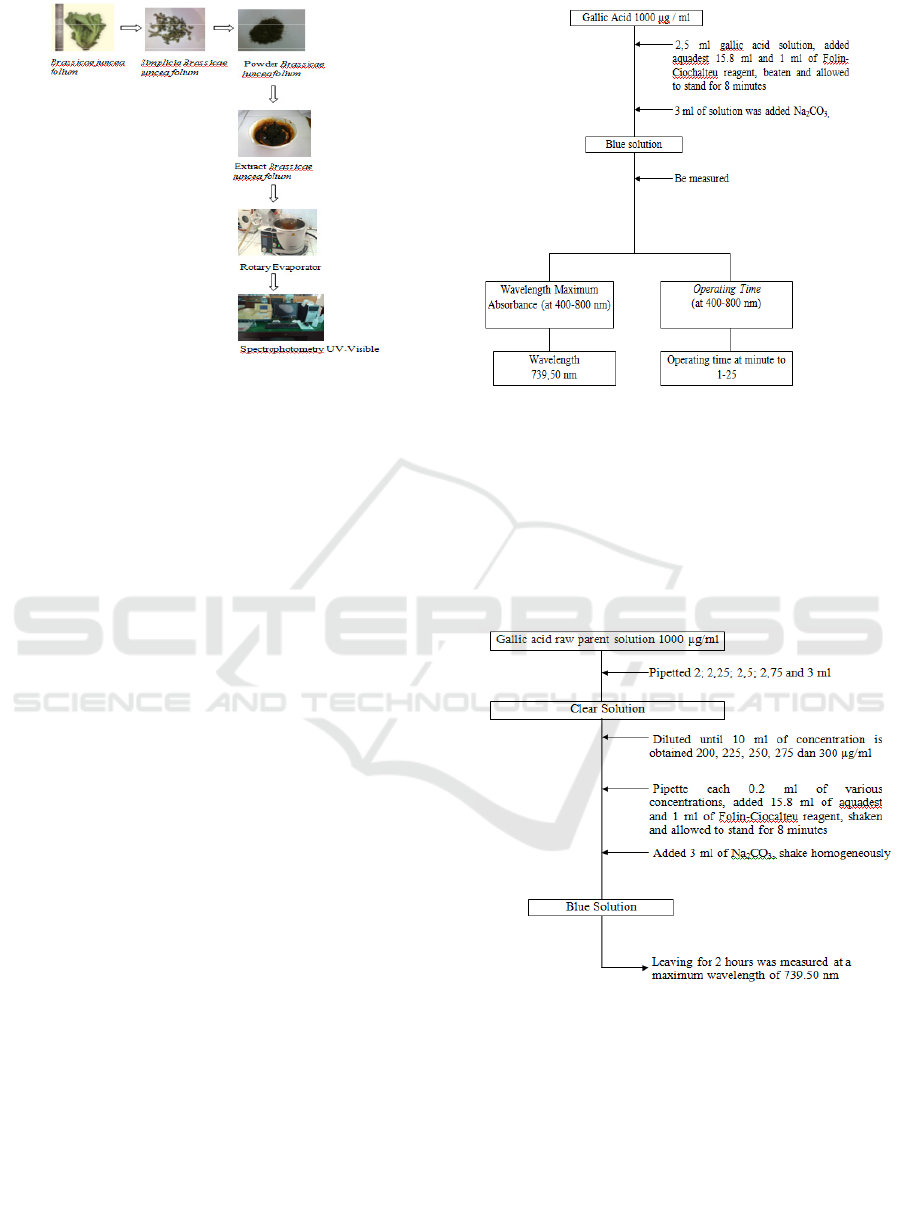
Figure 2. Scheme of Research
Phytochemical Screening:
This research was conducted in the laboratory of
organic chemistry of natural materials, Institute
Medical Lubuk Pakam, Faculty of pharmacy to
determine the presence of phenolic compounds in
the leaves of the Bitter Mustard plant. A preliminary
test was carried out, phytochemical screening where
10 g fresh leaves of Bitter Mustard plant that had
been blended with a blender macerated with
methanol and then filtered. The filtrate was tested by
adding 3 drops of 5% FeCl
3
reagent solution,
forming a black precipitate if Bitter Mustard extract
is positive contained phenolic compound (Eko BM,
2015). Sample as 1000 g of Bitter Mustard leaves
powder which had been dried and finely macerated
for ± 24 hours with methanol as much as 5 liters at
room temperature. Macerate was filtered and a
extract of Bitter Mustard leaves was obtained.
Maceration was repeated using methanol as a
solvent until the methanol extract obtained gave a
negative test result with 5% FeCl
3
reagent. The
methanol extract obtained was concentrated by
rotary evaporator at a temperature of 60
o
C with a
rotation of 80 rpm. The following is the
determination of the wavelength of gallic acid with
the addition of the Flin Ciohalteu reagent, measured
in wavelength and Operating Time using a UV-
Visible Spectrophotometer. This is shown in Figure
3.
Figure 3: Flow Chart Determination of Maximum
Wavelength and Operating Time
The following is the determination of the
standard acid gall curve using the Folin-Ciohalteu
reagent by dissolving the raw parent sample solution
from bitter mustard leaves, where the wavelength is
measured using a UV-Visible Spectrophotometer
tool. This is shown in Figure 4.
Figure 4: Flow Chart of Determination of Raw Acid Gallic
Curve with Folin-Ciocalteu Reagent
The following is the determination of the total
phenolic content of bitter mustard ethyl acetate
extract by dissolving a bitter mustard leaf sample
soltion, which is measured in wavelength using a
UV-Visible Spectrophotometer tool as shown in
Figure 5.
Phytochemical Screening of Phenolic Levels from Extracted Bitter Mustard Leaves (Brassica juncen L. Czern.) using UV-Visible
Spectrophotometer
509
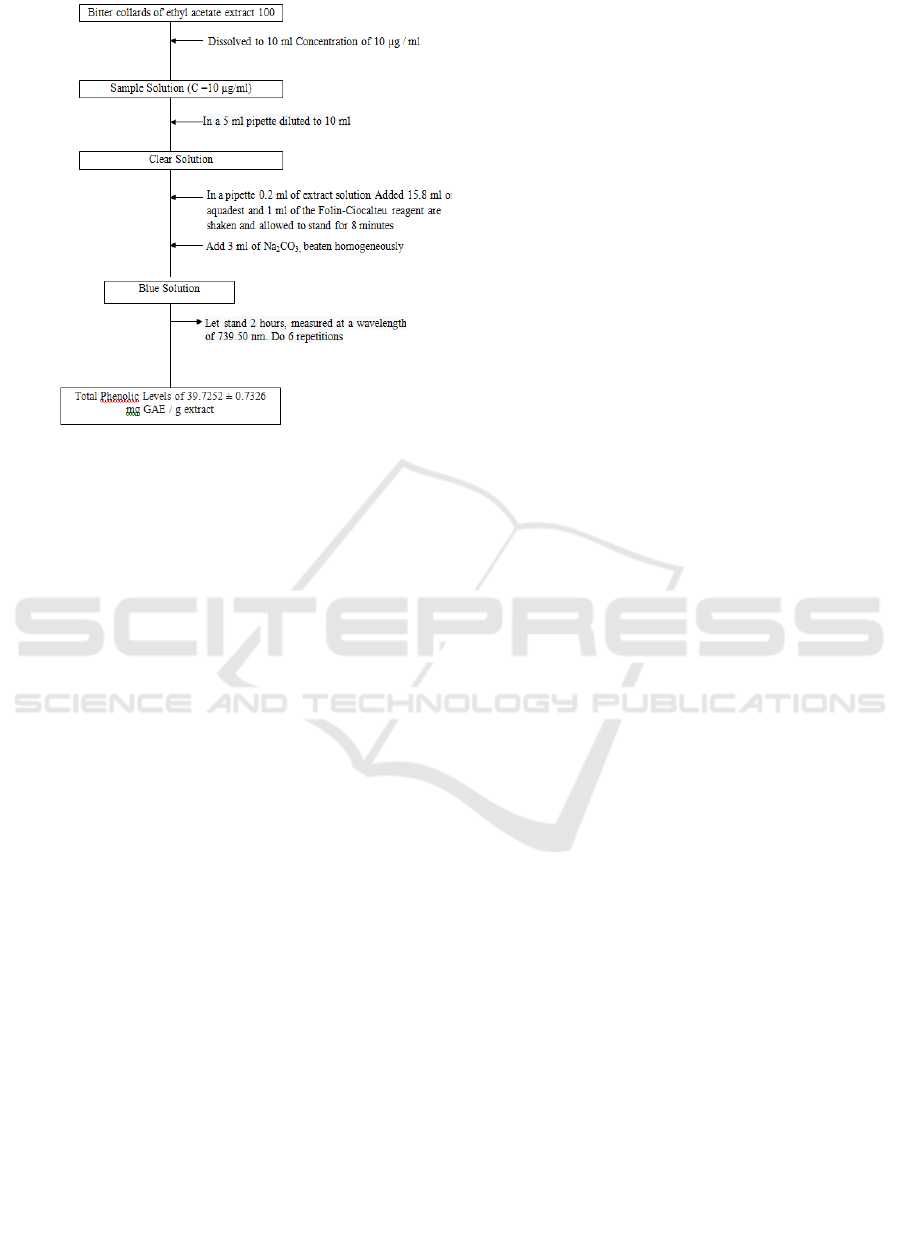
Figure 5: Flowchart Determination of Total Phenolic
Content of Bitter Mustard Extract Ethyl Acetate
Bitter mustard leaf is considered dry if it is
fragile (when squeezed it will be easily destroyed),
then dried bitter mustard leaf is made into powder by
blending, then powder which has become weighed
dry weight and obtained as much as 1 kg of powder
weight. Simplicia powder that has been weighed is
then put into a dry plastic bag that is well closed,
protected from sunlight and protected from heat. A
total of 500 g of simplex powder of bitter mustard
leaves were macerated using ethyl acetate solvent.
For the first treatment 3750 ml of ethyl acetate was
used in a tightly closed container and protected from
sunlight for 5 days, the maserat could be separated
into another container, the pulp was macerated again
with 1250 ml of ethyl acetate for 2 days, then
filtered so that it was obtained by the maserate. The
first and second maserates obtained were transferred
to another container which was tightly closed and
then evaporated in a rotary evaporator so that a thick
extract was obtained.
Determination of water content is done by the
azeotropic method (toluene distillation). The device
consists of a 500 ml round bottom flask, a container,
a ball cooler, a connecting tube and a 0.1 ml scale
receiving tube. A total of 200 ml of toluene and 2 ml
of distilled water were put into a round bottom flask,
a container was installed and cooled, then distilled
for 2 hours. The distillation is stopped and allowed
to cool, then the volume of water in the receiver tube
is read as the initial volume of water with an
accuracy of 0.05 ml. In a round bottom flask
containing saturated toluene, 5 g of driedia bitter
mustard leaf powder which has been carefully
weighed is then carefully heated for 15 minutes.
Toluent to boil, the droplet speed is set to 2 drops
per second until as distilled water, then the
distillation speed is increased to 4 drops per second,
after all the water is distilled, the inside of the cooler
is rinsed with saturated toluene. The distillation is
continued for 5 minutes, then the receiver tube is
allowed to cool at room temperature, after the water
and toluene separate completely, the volume of
water is read as the final volume with accuracy of
0.05 ml. The second difference in the volume of
water reads according to the water content contained
in the material being examined.
As much as 2.5 ml of 1000 μg gallic acid
solution was put into a 10 ml volumetric flask, then
stirred up to the mark with ethanol, then pipetted 0.2
ml put into a 25 ml flask, then added 15.8 ml of
distilled water and 1 ml of Folin-reagent Ciocalteu,
then shaken and allowed to stand for 8 minutes. To
the solution was added 3 ml of Na
2
CO
3
solution,
shaken until homogeneous and allowed to stand for
2 hours at room temperature, then the absorbance
was measured at a wavelength of 400-800 nm. As
much as 2.5 ml of 1000 μg gallic acid solution was
put into a 10 ml volumetric flask, then stirred up to
the mark line, then pipetted 0.2 ml put into a 25 ml
flask, then added 15.8 ml of distilled water and 1 ml
of Folin-Ciocalteu reagent, then shake until
homogeneous and sit for 8 minutes. To the solution
was added 3 ml of Na
2
CO
3
solution, then shaken
homogeneously and allowed to stand for 2 hours at
room temperature, measured its absorbance in the
span of 1-25 minutes wavelength 739.50 nm. From
the gallic acid mother liquor concentration of 1000
μg / ml pipetted 2, 2, 25, 2, 5, 2, 75 and 3 ml then
put into a 10 ml flask, then stirred to the mark line
with ethanol. From each pipette 0.2 ml was put into
a 25 ml flask and then added 15.8 ml of aquadest
and 1 ml of the Folin-Ciocalteu reagent were shaken
until homogeneous, allowed to stand for 8 minutes.
To the solution was added 3 ml of Na
2
CO
3
solution
then shaken homogeneously, allowed to stand for 2
hours at room temperature. The absorbance was
measured at a wavelength of 739.50 nm to obtain
concentrations of 200, 225, 250, 275 and 300 μg /
ml.
A total of 100 mg of bitter mustard extract was
dissolved with 10 ml of distilled water to obtain a
concentration of 10 mg / ml. From a concentration
of 10 mg / ml pipette 5 ml put into a 10 ml flask,
then stirred up to the mark line, then pipette 0.2 ml
extract put into a 25 ml flask then added 15.8 ml of
distilled water and 1 ml of Folin-Ciocalteu reagent,
ICHIMAT 2019 - International Conference on Health Informatics and Medical Application Technology
510

shaken homogeneously let stand for 8 minutes then
add 3 ml of Na
2
CO
3
solution. allowed to stand for 2
hours at room temperature. The absorbance of the
extract solution was measured with a UV-Visible
Spectrophotometer.
3 RESULT AND DISCUSSION
The results of phytochemical screening of bitter
mustard seed ethanol extract. Phytochemical
screening uses 5% FeCl3 reagent where the sample
was previously dissolved with methanol solvent
repeatedly. In this case, the extract becomes a black
precipitate after decreasing 5% FeCl3 while the
previous extract is green. The screening results are
tested in a test tube. The black sediment in question
is bitter mustard leaf which contains phenolic. The
maceration process is processed on a sample of
bitter mustard leaf powder in macerator. Maceration
is treated repeatedly to maximize the extract
produced. Samples as macerated solid extracts in
methanol solvents were obtained at 300 g. This
method is carried out by inserting suitable plant
powders and solvents into a humidly closed
container at room temperature. The principle of
maceration method is based that samples soaked
using organic solvents will break down the cell walls
and membranes due to pressure differences found
outside and inside the cell so that secondary
metabolites contained in the cytoplasm will dissolve
into organic solvents. The extraction process is
stopped when a balance is reached between the
concentration of the compound in the solvent and
the concentration in the plant cell18.
After maceration, the partition was carried out
using ethyl acetate to obtain a 600 g solid extract.
The last partition was carried out using n-hexane to
partition non-polar compounds from phenolic
compounds. the actual total phenolic content was
39.7252 ± 0.7326 mg GAE / g extract, the total
phenol content determined according to the Folin-
Ciocalteu method was not an absolute level, but in
principle based on the reduction capacity of the
material being tested against an equivalent reduction
of gallic acid. Bitter mustard leaf extract from the
partition contains total phenolic because it reacts
positively to the FeCl3 reagent when we do the
filtering again. In the liquid-liquid partition process,
the two phases of solution have different solubility.
Separate funnel shocks during partition aim to
expand the contact surface area between insoluble
solvents. The solvent requirements for the partition
method have suitable polarity for the extracted
material and must be separated after shaking. Total
phenol levels are influenced by the type of solvent.
Phenol is a polar compound so that its solubility is
highest in a semi-polar solvent. Polar solvents are
able to dissolve phenols so that the levels in extracts
are high. Phenol compounds are susceptible to
oxidation at high temperatures so that they
experience degredation while extraction that is too
long can provide an opportunity for phenol
compounds to oxidize more, but the total phenol
levels measured can be even lower.
Phytochemical screening tests were conducted to
determine the class of chemical compounds
contained in bitter mustard leaves using ethyl acetate
extract. Based on phytochemical screening
conducted on ethyl acetate extract is a low toxicity
solvent that is semi polar so that it can attract polar
and non polar compounds from bitter mustard
leaves. Bitter mustard leaves contain flavonoids,
alkaloids, glycosides, tannins, saponins, steroids /
triterpenoids and anthraquinones. On examination of
flavonoids with the addition of hydrochloric acid to
the Mg powder, it gives a red color which indicates
the presence of flavonoid compounds. Alkaloide
examination with Mayer, Dragendorff and
Bouchardat reagents results in turbidity and
deposition. The examination of anthraquinone
glycosides with the addition of NaOH to the
simplicia powder gives a positive red color, while
the extract does not form red. Tannin examination
with the addition of FeCl
3
solution will show blue or
blackish green discoloration (Harborne, 1996).
Determination of total phenolic levels using the
spectrophotometric method of visible light with the
Folin-Ciocalteu reagent is the simplest, easiest
method, using a relatively small number of samples
and a shorter processing time. Total phenolic testing
begins with the measurement of the maximum
wavelength of gallic acid solution with a
concentration of 1000 μg / ml in ethanol using a
Visible spectrophotometer to obtain a wavelength of
739.50 nm with an absorbance of 0.340.
The color of the Folin-Ciocalteu reagent standard
solution is usually less stable so it is necessary to
find the right working time to take measurements
because the amount of absorbance in the
spectrophotometry of the visible light is strongly
influenced by the color. Determination of working
time is done by using a standard solution of the
Folin-Ciocalteu reagent accompanied by the addition
of an extract which aims to find a stable
measurement time when the sample reacts
completely with a color reagent, measured at a
wavelength of 739.50 nm. Operating Time
Phytochemical Screening of Phenolic Levels from Extracted Bitter Mustard Leaves (Brassica juncen L. Czern.) using UV-Visible
Spectrophotometer
511

measurement results obtained results in minutes 23-
25.
According to Rahmawati research, 2015.
Analysis of flavonoid and phenolic levels was done
using the Chang method, then the wavelength
optimization was performed to determine the
maximum wavelength to be used in measurements
on UV-Visible Spectrophotometer. From the
measurement results obtained a maximum
wavelength of 415 nm for flavonoids and 730 nm for
phenolics. Quantitative analysis of flavonoids was
carried out by making a series of regular standard
solution concentrations of 3.75 ppm, 5 ppm, 6.25
ppm, 7.5 ppm, 8.75 ppm and 10 ppm, from each
concentration in a 1 ml pipette, then add 3 ml of
95% ethanol 0.2 ml of aluminum chloride 10% 0.2
ml (to make a shift towards a longer wavelength,
thus changing the standard wavelength routine to
enter the Spectrophotometer of UV-Visible
wavelength range).
Determination of total phenolic levels using the
spectrophotometric method of visible light with the
Folin-Ciocalteu reagent is the simplest, easiest
method, using a relatively small number of samples
and a shorter processing time. Total phenolic testing
begins with the measurement of the maximum
wavelength of gallic acid solution concentration of
1000 μg / ml in ethanol using a Spectrophotometer
of UV-Visible to obtain a wavelength of 739.50 nm
with an absorbance of 0.340. According to Gandjar
and Rohman (2007) the blue color will produce
maximum absorbance at a maximum wavelength of
400-800 nm.
Calibration curve measurements were carried out
with different solution concentrations pipetted from
gallic acid solution at a concentration of 1000 μg /
ml. Obtained concentrations of 200, 225, 250, 275
and 300 μg / ml, put into a volumetric flask added 1
ml of Folin-Ciocalteu reagent and shaken after it is
allowed to stand for 8 minutes, each solution plus 3
ml of Na
2
CO
3
beaten homogeneously and allowed to
stand for 2 hours at room temperature to perfect the
reaction. All solutions were measured at a
wavelength of 739.50 nm, then a calibration curve
was made between the concentration of gallic acid
(μg / m) and absorbance. Calibration curve
measurements were carried out with concentrations
of different solutions pipetted from gallic acid
solution at concentrations of 1000 μg/ml with
concentrations of 200, 225, 250, 275 and 300 μg/ml.
The results of the standard absorbance of gallic acid
by using a sample of bitter mustard leaf extract
based on the concentration and absorbance of the
regression equation measured with wavelength using
the Spectrophtometer of UV-Visible tool.
Table 1: Standard Absorbance of Gallic Acid
Sampel Konse
ntrasi
Absorb
ansi
Persamaan
Regresi
Ekstrak Daun
Sawi Pahit
0,00 0,000
Y =
0,08659 x
+ 0,00046
2,00 0,175
2,25 0,197
2,50 0,216
2,75 0,235
3,00 0,262
From this table a calibration curve is obtained as
shown in the following figure:
The following are the results of the calibration
curve for gallic acid compounds which were
measured using Spectrophtometer of UV-Visible at
a maximum wavelength of 515 nm. The regression
equation used in determining the total phenolic
compound content is Y = 0.08569 x + 0.00046 with
a correlation coefficient of 0.999940. The linearity
value shows the correlation between the
concentration and the absorbance produced. Testing
the total phenolic content is calculated by
substituting the absorbance value (y) of the sample
at the maximum wavelength into the linear
regression equation y = ax + b obtained from the
gallic acid calibration curve so that the concentration
(x) is obtained. The value of x is then substituted in
the formula for calculating total phenol levels.
Measurement of total phenol levels was carried out
by repetition 6 times and the average was taken as
presented in table 2 below.
From the results of the above study, the actual
total phenolic content was 39.7252 ± 0.7326 mg
GAE / g extract, the total phenol content determined
according to the Folin-Ciocalteu method was not an
absolute level, but in principle based on the
reduction capacity of the material tested against an
equivalent reduction of gallic acid. Total phenol
levels are influenced by the type of solvent. Phenol
is a polar compound so that its solubility is highest
in a semi-polar solvent. Polar solvents are able to
dissolve phenols so that the levels in extracts are
high. Phenol compounds are susceptible to oxidation
at high temperatures so that they experience
degredation while extraction that is too long can
provide an opportunity for phenol compounds to
oxidize more, but the measured levels of total phenol
can be lower. Testing the total phenolic content is
calculated by substituting the absorbance value (y)
of the sample at the maximum wavelength into the
ICHIMAT 2019 - International Conference on Health Informatics and Medical Application Technology
512

linear regression equation y = ax + b obtained from
the gallic acid calibration curve so that the
concentration (x) is obtained. The value of x is then
substituted in the formula for calculating total
phenol levels. Total phenol levels are influenced by
the type of solvent. Phenol is a polar compound so
that its solubility is highest in a semi-polar solvent.
Polar solvents are able to dissolve phenols so that
the levels in extracts are high. Phenol compounds
are susceptible to oxidation at high temperatures so
that they experience degredation while extraction
that is too long can provide an opportunity for
phenol compounds to oxidize more, but the
measured levels of total phenol can be lower.
4 CONCLUSIONS
After maceration and partition, a total phenolic
compound is obtained from saputangan leaves as
18.25 g. Results of thin layer chromatography
analysis of total phenolics using the chloroform :
methanol as eluent showed that total phenolic has 3
spots that have an Rf of 0.44 ; 0.29 and 0.22. The
total phenolic compound is able to act as a strong
antioxidant by having an IC
50
value of 15.22 ppm.
This antioxidant test was carried out using a DPPH
(2,2-diphenyl-1- picrilhidrazil) which was
measured using a UV-Visible spectrophotometer at
a wavelength of 516 nm.
ACKNOWLEDGEMENTS
This Research was supported by Institut Kesehatan
MEDISTRA Lubuk Pakam, Indonesia and
Grandmed Hospital, Indonesia
REFERENCES
Amirt, Pal Singh. (2002). A Trestie On Pytochemistry
Emeidia Science Ltd. Antioksidant Phenolic
Compounds, Jurnal Chem, Pharmres. 2.(5).
BPOM RI. (2011). Pedoman Uji Toksisitas Nonklinik
Secara In Vivo. Jakarta: Pusat Riset Obat dan
Makanan BPOM RI.
Czernajew. (1859). Conspectus Plantarum circa
Charcoviam et in Ucrania spontecresentium et vulgo
cultarum. Conspect.Pl. Charc.
Cartea, M.E. Fransisco, M. Soengas.P. dan Valasco P,
(2011) Phenolic Compounds In Brassica Vegetables
Molecules 16.
Ditjen POM. (2000). Parameter Standar Umum Ekstrak
Tumbuhan Obat. Jakarta, Departemen Kesehatan RI.
Ditjen POM. (1979). Farmakope Indonesia Edisi III
Jakarta. Departemen Kesehatan RI.
Ditjen POM. (1995). Farmakope Indonesia Edisi IV
Jakarta. Departemen Kesehatan RI.
Depkes RI. (2000). Pedoman Pelaksanaaan Uji Klinik
Obat Tradisional, Jakarta. Direktorat Jendral
Pengawasan Obat dan Makanan.
Eko, B,M., 2015. Phytochemical Screening and Total
Flavonoid Content in the Fruit Carica pubescens
Lenne & K. Koch in the Bromo, Cangar and Dieng
Plateau Regions. Phytochemical Screening, 5(2) : 73-
82.
Farnsworth N.R. (1966). Biological and phytochemical
screening of plant. Jurnal of pharmaceutical science 3.
Gartner, J.P. (2007). Color Text Book of Histology, Edisi
Ketiga. Philadelphia: Elsevier Saunders.
Goldberg I. (1996). Designer Foods, Pharmafoods,
Nutracals. London : Chapman & Hall, Inc.
Giorgio, P. (2000). Flavonoid an Antioxidant Journal
Natural Product 2(4)
Hoelz. L.V.B Harta B.A.C. Araujo J.Q. Albugerque M.G.
Alencastro R.B And Silva J.f.M. (2010). Quantitative
Structure Activity Relarionships Of Antioxidant
Phenolic Compounds. J. Chem, Pharm Research 2 (5).
Harborne J.B. (1987). Metode Fitokimia Penentun Cara
Modern Menganalisis Tumbuhan, Bandung , Institut
Teknologi Bandung.
Hariyanto E, Tina S. dan Estu R. (2007). Sawi dan Selada.
Rineka Cipta. Jakarta.
Kanwar, M.K., Poonam and Bhardwaj, R. 2015. Arsenic
Induced Modulation of Antioxidative Defense System
and Brassinosteroids in Brassica juncea L.
Ecotoxicolgy and Environmental Safety 115 : 119 –
125.
Khadijah, , dkk. (2017). Penentuan Total Fenolik Dan
Aktivitas Antioksidan Ekstrak Etanolik Daun Samama
(Anthocephalus macrophylus) Asal Ternate, Maluku
Utara.Jurnal Kimia Mulawarman Volume 15.Kimia
FMIPA Unmul.
Kosasih, EN., Tony, S. dan Hendro, H. (2004). Peran
Antioksidan pada Lanjut Usia . Jakarta: Pusat Kajian
Nasional Masalah Lanjut Usia.
Kumar, V., Thakur, A. K., Barothia, N. D and Chatterjee,
S. S. 2011. Therapeutic Potentials of Brassica juncea :
an overview. TANG 1 : e2.
Lee. K. I Kim Y. J. dan Lee C.H ( 2003). Cocoa hansmora
phenolic Phytochemical and higher antioksidant
capacity than theasand red wine J. Agric Food Chem
Research.
Manohar, P. R., Pushpan, R and Rohini, S. 2009. Mustard
and Its Uses in Ayurveda. Indian Journal of
Traditional Knowledge 8 : 400 – 404.
Markham, K. (1998). Cara Mengidentifikasi Flavonoid.
Terjemahan Kosasih, Bandung: Penerbit ITB.
Rohman A dan Riyanto S. (2006). Aktivitas antiradical
bebas ekstrak kloroform buah buah mengkudu
(morindacitri folia. L) dan fraksi-fraksinya artocapus
6 (1).
Phytochemical Screening of Phenolic Levels from Extracted Bitter Mustard Leaves (Brassica juncen L. Czern.) using UV-Visible
Spectrophotometer
513

Rohman, A. (2007). Kimia Farmasi Analisis. Universitas
Gadjah Mada Yogyakarta.
Rohyami, (2008). Penentuan Kandungan Flavonoid Dari
Ekstrak Metanol Daging Buah Mahkota Dewa
(Pheleria macrocarpa (Scheff.) Boerl.) Logika Vol.
No.8. Robinson. T. (1995). Kandungan Organik
Tumbuhan Tinggi. Edisi Ke. Enam. Bandung. Penerbit
Institut Teknologi Bandung.
Rozanna, F., R Dawson, a., lohsoonthron, V., & Williams,
M.A. (2013). Risk Factors of Early and Late Onset
Preeclampsia among Thai Women, Journal Medical
Association, 3(5).
Sunarjono, H. (2009). Berkebun 21 Jenis Tanaman Buah.
Jakarta: Penebar Swadaya.
Syamsuni H.A. (2006). Ilmu Resep. Jakarta : EGC.
Tiffani, R.A. (2015). Uji Toksisitas Etanol Herba Kailan,
Herba Sawi, Herba Sawi Botol dan Herba Sawi Pahit
dengan Metode BSLT. Skripsi. Medan: Fakultas
Farmasi Universitas Sumatera Utara.
ICHIMAT 2019 - International Conference on Health Informatics and Medical Application Technology
514
