
Loyalty in Hospital Patients
Muhammad Nawawia
1
, Dyah Sugandini
2
, Heru Tri Sutiono
2
, Mersianti Rija Anandiha
2
1
Department of Management, Sekolah Tinggi Ilmu Ekonomi Trisna Negara, Sumatera Selatan
2
Universitas Pembangunan Nasional Veteran Yogyakarta
merchyrijaanandiha@gmail.com.
Keywords: Service quality, image, trust, and loyalty
Abstract: This study aims to analyze the effect of service quality and corporate image on loyalty mediated by trust. The
subjects of this study were inpatients in hospitals in Yogyakarta, South Sumatra, and East Nusa Tenggara.
This research includes a quantitative approach with survey methods. Retrieval of data in this study using a
questionnaire with a five-point Likert scale. The number of respondents in this study was 300 hospital patients
who were being a hospital undergoing treatment at the hospital. The data analysis method used is Partial Least
Square. The results showed that the quality of service had a positive effect on inpatient loyalty. The image of
the hospital has a positive effect on patient loyalty. The quality of service affects patient loyalty, which is
mediated by trust. The image of the hospital has a significant positive effect on patient loyalty mediated by
patient trust.
1 INTRODUCTION
Customer loyalty has become a central concept in
marketing theory and practice and is one of the
essential objectives for business activities. Customer
satisfaction contributes to several crucial aspects,
such as the creation of customer loyalty, increased
company reputation, reduced price elasticity, reduced
future transaction costs, and increased employee
efficiency and productivity (Berry, 1995); Chao
(2011). Hospitals need to make an effort to stay afloat
and grow because of the high hospital operational
costs accompanied by competition in hospital service
quality. Therefore, hospitals need to maintain and
increase patient visits by displaying quality health
services. Hospitals must also have a better
understanding of the importance of image,
Sulibhavi & Shivashankar (2017) suggest that the
effect of service quality on customer loyalty reveals
companies that do good service quality can increase
customer loyalty. This means that customer loyalty is
influenced by service quality. The quality of hospital
services has a strong relationship with patient loyalty
at the hospital. Whereas the influence of image on
loyalty Marilees and Fry (2002); Mayer et al., (1995)
says, the image has a direct effect on loyalty.
However, the image can be seen clearly as a predictor
of customer loyalty. A right image will form the
mindset of the community that if people have health
problems, people do not need to think twice about
where they will get health services, because based on
the experience they have experienced themselves or
based on the information they have obtained. This
study aims to analyze the loyalty of inpatients at the
hospital, because developing inpatient loyalty
requires unlimited challenges, especially now that
patients and families of patients are more critical in
choosing a hospital as a treatment facility, which can
compare one hospital's services with others,
especially in the quality of service (Ghaliyah &
Mubarok, 2017).
2 LITERATURE REVIEW
2.1 Loyalty
In general, loyal means loyal, or loyalty can be
interpreted as loyalty. The loyalty that occurs without
coercion, but arises from one's consciousness in the
past. Efforts made to create customer satisfaction are
more likely to influence customer attitudes
(Moorman et al., 1992). Whereas the concept of
customer loyalty explains more to the behavior of
buyers or service users. According to Kotler and
Keller (2016), Loyalty is a firm commitment to
Nawawia, M., Sugandini, D., Sutiono, H. and Anandiha, M.
Loyalty in Hospital Patients.
DOI: 10.5220/0009962600730078
In Proceedings of the International Conference of Business, Economy, Entrepreneurship and Management (ICBEEM 2019), pages 73-78
ISBN: 978-989-758-471-8
Copyright
c
2020 by SCITEPRESS – Science and Technology Publications, Lda. All rights reserved
73

repurchase and subscribe to preferred products or
services in the future even though situational
influences and marketing efforts have the potential to
cause customers to switch to other products or
services. The commitment that accompanies repeated
purchases is a situation where the customer does not
want to move even though the product or service is
scarce in the market, and the customer voluntarily
recommends the product or service to colleagues,
family, or other customers.
There are two dimensions of loyalty, according to
Kesuma et al. (2013) that will affect customers,
namely: Behavioural dimensions and attitude.
Behavioral dimensions are aspects of customer
behavior (such as repurchase, purchase quantity,
purchase quality, purchase intensity), which are
indicated at a specified period. Although purchasing
is a crucial thing for marketers, interpreting loyalty
only to repurchase is not enough, because repeat
customers do not necessarily have a positive attitude
towards the goods or services purchased.
Repurchases are made not because they are satisfied
but because there are other factors. In other words,
there is no guarantee that the customer will
repurchase it from the relevant service provider if
there are other choices, both in price and service. The
attitude dimension is the intention and preference of
customers to buy certain services or products. The
intention to buy or recommend preferences for a
company is an essential factor in determining
business in the future. The higher the customer's
intention to repurchase or the intention to recommend
a service company indicates that the company has a
future business. The existence of the attitude
dimension given by Sulibhavi & Shivashankar
(2017), namely: Talking positive things about the
company; Willingness to repurchase; Willingness to
recommend to others; Commitment to the company
not to move to competitors; Encourage others to do
business with the company.
2.2 Trust
According to Mowen & Minor (2002), Consumer
belief is all knowledge possessed by consumers and
all conclusions consumers make about objects,
attributes, and benefits. Objects can be in the form of
products, people, companies, and everything where a
person has trust and attitude. Attributes are
characteristics or features that objects or may not
have. Attributes are divided into two, namely: first,
intrinsic attributes are anything related to the actual
nature of the product, while the second, extrinsic
attributes are everything obtained from external
aspects of the product such as brand names,
packaging, and labels. Finally, benefits are positive
results that contribute to consumers. Consumers form
three types of trust, namely: Trust attribute-object,
Knowledge about an object has a particular attribute
called object attribute trust. Trust attribute attributes
an attribute with an object, such as a person, goods,
or service. In the belief of attribute-objects,
consumers state what they know about something in
terms of variations in their attributes.
Trust attribute-benefits. Someone looking for
products and services will solve their problems and
meet their needs. In other words, they have attributes
that will provide benefits that can be known. This
relationship between attributes and benefits illustrates
a second type of trust, called benefit-attribute trust.
Benefit-attribute trust is a consumer's perception of
how far specific attributes produce or provide certain
benefits.
Benefit-object trust connecting objects and their
benefits form the third type of trust. Benefit-object
trust is the perception of consumers about how far
certain products, people or services will provide
specific benefits
2.3 Service Quality
According to Parasuraman (1998), Service quality is
a reflection of consumers' evaluative perceptions of
services received at a particular time. Meanwhile,
according to Sulibhavi &
Shivashankar (2017), one
of the factors that determine the level of success and
quality of the company is the company's ability to
provide services to customers. The success of a
company in providing quality services to its
customers, achieving a high market share, and
increasing the company's profits is primarily
determined by the approach used. Quality of service
is how far the difference between the expectations
and reality of the customers for the services they
receive. Service quality can be known by comparing
customer perceptions of the services they receive with
the actual service they expect. Service plays a vital
role because it is a supporting actor in marketing
activities. Service quality is the difference between
reality and customer expectations for the service they
receive. Pasuraman (1988) argues that the service
quality variable is measured by using the five
dimensions of Servqual consisting of Physical
evidence (Tangible), namely the company's ability to
demonstrate its existence to external parties. The
capability in question is the ability of the company's
physical facilities and infrastructure, and the state of
the surrounding environment is tangible evidence and
ICBEEM 2019 - International Conference on Business, Economy, Entrepreneurship and Management
74

services provided. Physical evidence is measured
using 5 items, namely: physical facilities, access to
locations, staff/employee appearances, as well as
cleanliness and the environment.
Reliability is the company's ability to provide
services following what was promised accurately and
reliably. Reliability is measured using five items,
namely: timely service, patient acceptance
procedures, staff/employee availability, availability
in hearing patient complaints. Responsiveness ie, a
willingness to help and provide fast and accurate
service to customers, with precise information
delivery. Responsiveness was measured using four
items, namely: sympathetic staff/employee attitudes,
fast service to patients, responsiveness to patient
needs, and willingness to help patients.
Assurance is knowledge, politeness, and the
ability of company employees to grow customer trust
in the company. Dimensions of certainty or assurance
is a combination of dimensions: a) Competence,
meaning that the skills and knowledge possessed by
the employees to perform services. b) Courtesy,
which includes the friendliness, attention, and attitude
of the employees. c) Credibility (Credibility),
including matters relating to confidence in the
company, such as reputation, accomplishments, and
so on. Assurance is measured by using five items,
namely: staff/employee behavior, confidence and
trust in the care provided, proper service from the
beginning of treatment, security in interacting with
staff/employees, and polite/friendly attitude towards
staff/employees towards patients.
Empathy is giving sincere and individual or
personal attention given to customers. Empathy was
measured using four items: awareness of the patient's
interests, understanding of the patient's specific
needs, willingness to respond to patient requests, and
individual attention to patients.
2.4 Image
Kotler and Keller (2016) define an image as a set of
beliefs, ideas, and impressions held by someone
regarding an object. The image includes the
company's right name, reputation, or expertise of the
company. According to Chao (2011). Five factors can
affect the image of a company in a service company,
namely: Corporate Identity. Company identity is what
is displayed by the company. Identity is a company
statement to the public about what and who they are.
A company's identity can differentiate one company
from another.
Reputation is something that has been done by the
company and is believed to be the target public based
on the experience of itself or other parties, such as the
performance of a bank's transactions. Service
Offering when the company determines the services
to be provided to customers, the company must
ensure that services are provided on time so that
customers do not wait long to get these services. Long
waiting times can harm the company's image,
especially in situations where service providers have
control over waiting times, such as in financial
institutions.
The physical environment is a service that is
produced and is assumed to affect customer
perception of the company's image significantly.
Contact Personnel. Employee performance and
employee interaction through their attitude that takes
place at the time the service is given influences the
results of evaluating employees' service and
interactions to be one of the crucial things in the
company's image.
2.5 Research Hypothesis
Based on the discussion in the background,
theoretical basis, and frame of mind, the formulation
of hypotheses formulated to test its validity in
research carried out in hospitals is as follows:
H1: Service quality has a positive and significant
effect on loyalty in hospitalized patients.
H2: Hospital image has a positive and significant
effect on loyalty in hospitalized patients.
H3: Quality of service has a positive and significant
effect on patient loyalty, which is mediated by
trust in inpatients.
H4: Hospital image has a positive and significant
effect on patient loyalty which is mediated by
trust in hospitalized patients
3 RESEARCH METHOD
The research design is a plan of activities made by
researchers to solve problems so that that data will be
obtained following the research objectives. This
research method is a type of survey research. Based
on the hypothesis in the design of this study
determined the research variables that will be used in
research. The four variables in this study are loyalty,
trust, service quality, and company image. Next
determination of the sample from the study
population. Data collection in using interviews and
questionnaires. The collected data will be processed
using descriptive and quantitative analysis tools. The
analysis technique used for data analysis is Partial
Least Square (PLS). This study aims to determine the
Loyalty in Hospital Patients
75
effect of service quality and hospital image on loyalty
through trust.
The population in this study were all inpatients in
hospitals in Yogyakarta, South Sumatra, and East
Nusa Tenggara. Researchers chose to study inpatients
because it can facilitate researchers to retrieve data
and can be interviewed directly at the hospital. The
sampling technique in this study is convenience
sampling. The number of respondents in this study
was 300 people, divided into each province by 100
people. The analytical method used is Partial Least
Square (PLS) - SEM. PLS is a Structural Equation
Modeling (SEM) technique that can analyze latent
variables, indicator variables, and measurement
errors directly. PLS can be used with a small number
of samples and can be applied at all data scales.
4 RESULTS
4.1 Quantitative Analysis
Data processing techniques using the SEM method
based on Partial Least Square (PLS) requires two
stages. According to Chin, 1998 (in Ghozali, 2015),
reporting the results of PLS analysis uses a two-step
approach or also called a two-step approach. The first
is focused on the results of the measurement model
(Outer model), and the second is focused on the
results of the structural model (Inner Model).
4.2 Outer Model
The Outer Model focuses on testing the validity and
reliability of each indicator on its latent variable.
Indicators formed from the results of the Outer Model
are reflective indicators. Reflective indicators place
that changes in latent variables will affect changes in
indicators. Outer models with reflective indicators are
evaluated through:
Convergent Validity, which is the value of factor
loading on latent variables with the indicator. Value
loading factor> 0.7. Nevertheless, according to Chin,
1998 (in Ghozali, 2015), for the initial stage of
research, the development of a measurement scale of
loading values of 0.5 - 0.6 is considered sufficient. In
this research, a loading factor limit of 0.5 will be used.
In this testing phase, all indicators of the research
variables are valid and have met the convergent
validity or are declared valid because all indicators
have a loading value above 0.5.
Discriminant Validity, namely the cross-loading
correlation value with the latent variable, must be
greater 0.70. However, according to Ghozali (2015)
0.5 - 0.7 can still be said to be valid. All indicators
that pass the Cross loadings (Discriminant Validity)
test are all valid.
Average Variance Extracted (AVE). Expected
AVE value > 0.5 to be said to be valid. For all latent
variables having the value AVE > 0.5, for that, all
latent variables are said to be valid. Composite
Reliability is an excellent Composite Reliability
value if it has a value of ≥ 0.70. All latent variables in
this study have value. Composite Reliability ≥ 0.70,
for that, all latent variables are said to be Reliable.
4.3 Inner Model (Structural Model) or
also Called the Influence
Test/Hypothesis Test
The following is a table of the results of the structural
test /output inner model (influence test/hypothesis
test) after the indicator test.
Table 1. Reporting on Results of Inner Models / Influence
Tests / Hypothesis Tests
Original
Sample (O)
P-Values
Image
Loyalty
0.169 0.030
Image
Trust
0.516 0.000
Service
Quality
Loyalty
0.144 0.028
Service
Quality
Trust
0.427 0.000
Trust
Loyalty
0.605 0.000
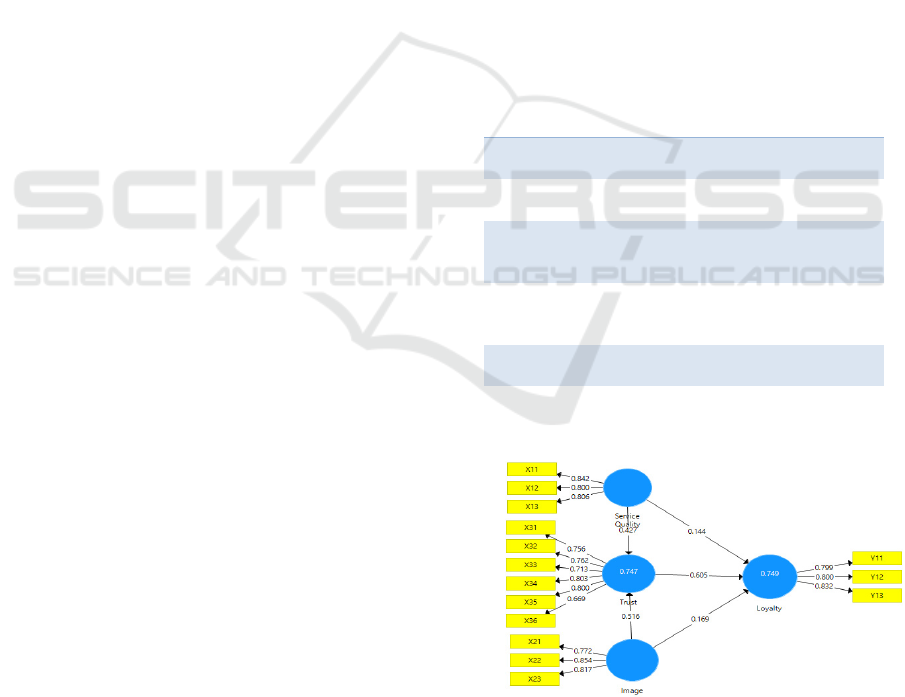
The loyalty model developed in this study can be
seen in Figure 1.
Figure 1: PLS Alogritm Loyalty from
patients
ICBEEM 2019 - International Conference on Business, Economy, Entrepreneurship and Management
76

5 DISCUSSION
5.1 The Coefficient of Determination
(R
2
)
This indicates that the Trust is affected by the quality
of service and the image of the remaining 74.7% by
25.3% influenced by other factors that are not
included in the model. While patient loyalty is
influenced by the quality of services and the image of
the hospital by 74.9%, the remaining 25.1% is
influenced by other factors that are not in the model.
5.2 Q- square Predictive Relevance
(Q
2
)
Service Quality, Hospital Image, and Trust have an
influence on patient loyalty of 80.64%, and the model
in this study cannot detect the remaining 19.36%.
5.2.1 P-value
A variable hospital image of trust has a p-value of
0,000, and trust to loyalty has a p-value of 0,000.
Also, the influence of exogenous and endogenous
variables on other endogenous variables was stated to
be significant because the P-value was less than 0.05
(significance of 5%).
5.2.2 Parameter Coefficient
The magnitude of the parameter coefficient
influences the quality of service on trust by 42.7%.
The magnitude of the parameter coefficient
influences the quality of service on loyalty by 14.4%.
The magnitude of the parameter coefficient
influences the image of the hospital on trust by
51.6%. The magnitude of the parameter coefficient
effect of hospital image on loyalty is 16.9%. The
magnitude of the parameter coefficient influence of
trust on loyalty by 60.5%.
5.2.3 Path Analysis
For path, analysis can be seen in the table below.
Smart PLS directly produces output Path Coefficient
(Indirect Effect).
Table 2. Indirect
effects
Variable Original
Sample
Image Trust Loyalty 0.441
Service Quality Trust Loyalty 0.365
5.2.4 Hypothesis Test Results
Based on the results of the data analysis presented in
this study, it shows that all hypotheses submitted in
this study can all be supported
.
6 CONCLUSIONS
The quality of service has a positive effect on
inpatient loyalty at Image Hospital. The hospital has
a positive effect on patient loyalty at the hospital. The
quality of service has a significant positive effect on
patient loyalty that is mediated by the patient's trust.
The image of the hospital has a significant positive
effect on patient loyalty, which is mediated by the
patient's trust in the hospital.
REFERENCES
Berry, L. L. (1995). "Relationship Marketing of Service-
Growing Interest Emerging Perspective." Journal of the
academy of Marketing Science. Vol.23, No.4, p.236-
245.
Chao-Wu, Chan. (2011). “The impact of hospital brand
image on service quality, patient satisfaction and
loyalty”. African Journal of Business Management.
Vol. 5(12), pp. 4873-4882.
Ghaliyah, D., & Mubarok, E. S. (2017). “The Influence of
Service Quality, Hospital Image, and Promotions to
Patients’ Trust and Loyalty”. European Journal of
Business and Management, Vol.9, No.20.
Ghozali, I. 2005. Analisis Multivariat. Semarang (ID).
Badan Penerbit Universitas
Kesuma., Hadiwidjojo., Wiagustini & Rohman F., 2013.
Service Quality Influence on Patient Loyalty: Customer
Relationship Management as Mediation Variable
(Study on Private Hospital Industry in Denpasar)
International Journal of Business and Commerce Vol.
2, No.12[01-14] (ISSN: 2225-2436)
Kotler, P. T., & Keller, K. L. (2016). Marketing
Management (Global Edition) 15th Edition. Pearson
Education,Inc.
Lau, G. T & S. H. Lee (1999). “Consumers trust in a brand
and the link to brand loyalty”. Journal of marketing
focoused manajemen.
Marilees, B., & Fry, M. (2002). “Corporate Branding: A
framework for E-Retaliers”. Corporate Reputation
Review. Vol. 5.
Mayer, R.C., Davis, J. H., and Schoorman, F. D. 1995. “An
Integratif Model of Organizational Trust,” Academy of
Management Review (30:3), pp 709-734.
Moorman, C, Zaltman, G., & Desphande, R. (1992).
“Relationships Beetwen Provider and Users of Market
Researt : The Dinamics Of Trust Withim and Between
Loyalty in Hospital Patients
77

Organizations”. Journal Marketing Research. Vol
XXIX,314-28
Mowen & Minor. (2002). Consumer behavior. Prentice
Hall; Subsequent edition
Parasuraman, A., Leonard L. Berry., & Zeitham, A.V.
(1988). “SERQUAL: Multiple-item scale for
measuring consumer perceptions of Service Quality”.
Jurnal of retailing, 64 (Spring), 12-40.
Sulibhavi, B., & Shivashankar, K. (2017). “The impact of
brand image on customer’s loyalty towards private
label brands: the mediating effect of satisfaction. Hubli-
Dharwad conglomerate city of Karnataka”.
International Journal of Marketing & Financial
Management. Volume 5, Issue 8, Aug-2017, pp 43-50.
ICBEEM 2019 - International Conference on Business, Economy, Entrepreneurship and Management
78
