
Joint Replenishment Problem for Multi Supplier One Regional
Laila Nafisah, Ahmad Muhsin, Bekti Sulistiyani, Yuni Siswanti
Universitas Pembangunan Nasional Veteran Yogyakarta
Keywords: Inventory, Joint Replenishment Problem, Multi Supplier, Probabilistic, ABC Analysis
Abstract: PT XYZ is a company that produces various bags with leather as its basic material. Request for bag
accessories as supporting raw material is uncertain (probabilistic). In view of accessories requests in the
monthly report of 2017 until 2018, there was out of stock to the value of 44%. Accessories request is not
performed in the unit, but only several accessories needed at that time. In consequence, after order is
submitted, request for additional accessories is added and makes the total request and order imbalance. The
order which is submitted several times in one month may increase inventory cost. Moreover, this research
uses the Joint Replenishment Order Method, which aims to control accessories stock. This method tries to
design control for the stock by taking into account request (Di), service level, and company's expense. The
first step of this method is determining the time between the order of each accessory(Ti), and then
determining the interval of basic order (T) in order to specify order optimal time (T*). After the optimal
time is specified, the quantity (Q), which will be ordered to the supplier, also safety stock and inventory
level for each item can be known. Stock control design will obtain the result of minimal inventory total cost.
Result of Joint Replenishment Order Method Calculation shows obtained order optimal time (T*) of 0,3558
years with the total cost to the value of Rp50.863.488; thus, in one year the obtained total cost is
Rp152.590.465 per year, while expenses with company method are to the value of Rp198.411.763. The
company can save cost up to Rp45.821.297 or 23% with this method.
1 INTRODUCTION
Inventories are idle resources, so their existence can
be seen as a waste due to the existence of embedded
capital that cannot be used. Inventory is also the
capital or assets of the company that is important for
the smooth production process in the company. If
the supply is insufficient, or there is a shortage of
inventory, the company will be faced with the
cessation of the production process, not achieving
the production target and the loss of consumer
confidence. Conversely, if there is too much
inventory, the company will bear the costs due to the
goods stored, the risk of damage to the goods, or
even the goods become out of date. Thus, the
company is faced with a dilemma that is one side of
the company wants to increase service level by
providing enough goods, and the other side is to
provide goods as minimal as possible to avoid losses
due to the risk of storing too many goods. Clearly,
the ability to satisfy consumers and simultaneously
reduce losses requires the application of good
inventory management principles.
PT XYZ is a company in Yogyakarta that
manufactures various types of leather-based bags.
One of the supporting raw materials in bag making
is accessories. This company has a diverse catalog of
bag models, where each bag model requires
accessories that can differ (vary) from one model to
another. There are 56 types of accessories managed
by companies that support the production of various
models of bags. All were ordered from 4 suppliers,
namely Prima Jakarta, 88 Buckle, Mitra Buckle, and
Beautiful Pattern. The four suppliers are located in
Jakarta. Each supplier orders several different items
(multi items).
The variety of bags produced and the uncertain
number of bag requests make it difficult for
companies to determine the stock of each item of
accessories that must be provided in the accessories
warehouse. Based on monthly reports on the need
for accessories in the last two years, there was an out
of stock of 44%. So ordering often happens several
times a month. As a result, the costs of messaging
and transportation costs are quite high. If this
continues, it will certainly make the company lose,
because it will hamper the smooth production of
Nafisah, L., Muhsin, A., Sulistiyani, B. and Siswanti, Y.
Joint Replenishment Problem for Multi Supplier One Regional.
DOI: 10.5220/0009958604010411
In Proceedings of the International Conference of Business, Economy, Entrepreneurship and Management (ICBEEM 2019), pages 401-411
ISBN: 978-989-758-471-8
Copyright
c
2020 by SCITEPRESS – Science and Technology Publications, Lda. All rights reserved
401

bags, the target is not achieved, and the level of
consumer confidence in the company decreases.
The more accessories that are provided, the more
embedded capital that cannot be used for other
purposes that are more profitable, and the greater the
risk of the product being damaged. The fewer
accessories available, the greater the likelihood that
a shortage will occur. As a result, the greater the loss
of opportunities for profit.
Based on the above problems, it is necessary to
have a design in the ordering system to control the
supply of accessories that demand is probabilistic, so
that these accessories when needed are available in
the right amount in such a way that the costs
incurred are minimal and the production process is
realized.
The Joint Replenishment Model approach can be
used to help design the ordering system in such
cases. When a company located in Yogyakarta
orders several suppliers located in Jakarta, the
company needs to develop a shipping strategy in
order to minimize transportation costs arising from
ordering items from some of these suppliers. One
way is to consolidate all items designed for ordering
using the joint replenishment model approach from
several suppliers to be sent together to Yogyakarta.
The solution method used in determining the
ordering interval together that minimizes the costs
incurred is the heuristic method. While the ABC
method can be used to classify groups of accessories
according to the level of importance or priority of
each of these accessories.
The purpose of this research is to set an
appropriate time interval for multi-item accessories
that are ordered together from multi suppliers in
order to minimize transportation costs and message
costs and at the same time, minimize out of stock.
2 LITERATURE REVIEW
Inventories are materials or products or assets from
an association that is put away that will be utilized to
meet certain targets. Each component in an
organization must have stock in different structures
and capacities. In light of the physical structure, the
stock can be as crude materials, work in the
procedure, completed merchandise, save parts, and
supplies. While dependent on its capacity, the stock
is delegated a great deal size stock, variance stock,
and expectation stock.
Despite the fact that stock is an inactive asset, it
tends to be said that no organization works without
stock. Without provisions, business visionaries will
be looked at with the hazard that their organization
will, at one time, not have the option to satisfy the
wants of their clients. The level of stock of the
complete resources of the organization is moderately
high. For instance, at the manufacturing plant level,
around 25 - 35% of the absolute resources claimed.
While at the wholesaler level, 15 - 90% of the
absolute expense of items oversaw. Thusly, the
current stock in the organization should be overseen
just as conceivable, and the stock must be arranged
and controlled successfully and productively.
Stock control intends to keep up stock at an ideal
level with the goal that reserve funds are gotten from
expenses brought about. Assurance of stock strategy
or model that suits the genuine issue will deliver a
powerful stock control framework for the
organization. Stock models are partitioned into
deterministic models and probabilistic models. In the
deterministic stock model, the parameters that
influence the inventory framework (request, lead
time) are known with sureness. Though in the
probabilistic stock model, the parameters that impact
are not known with conviction. So there are three
explanations behind the significance of stock for
organizations, to be specific: the nearness of a
component of interest vulnerability, a component of
stockpile vulnerability from providers, and a
component of the vulnerability of the elegance time
frame among requesting and sending.
Regularly an association or organization is
looked at with issues of capacity and support of
various supplies, both crude materials, parts, and
completed products. In these conditions, the
executives must give exacting control need to kinds
of stock that have high esteem, though for
inventories with low-esteem control should be
possible rather freely, in light of the fact that too
tight power over this sort of control expenses might
be higher than the estimation of stock. For proficient
control, the stock must be grouped first. The
arrangement is normally isolated into three,
generally called ABC groupings. This idea was
presented by HF. Dickie during the 1950s. The order
depends on stock worth. With the information of this
grouping, the control will be done all the more
seriously on specific things, which are the most
significant things of every single existing thing
contrasted with different things.
Stock control by the ABC strategy is a stock
control method by considering gatherings of
merchandise as per the degree of significance of
each gathering of products. This strategy was found
by Pareto. In view of the Pareto standard,
merchandise is arranged into three gatherings, to be
ICBEEM 2019 - International Conference on Business, Economy, Entrepreneurship and Management
402

specific Class A, Class B, and Class C. Class A will
be a gathering of products that ingests about 80% of
the all-out capital gave and comprises of about 20%
of all merchandise oversaw. Class B is a gathering
of products that ingests about 15% of the all-out
capital gave (after class B) and comprised about
30% of all merchandise oversaw. Though class C is
the gathering of products that retain reserves, just
about 5% of all capital gave (outside classes An and
B) and comprised of about half of all merchandise
oversaw. At the point when an organization is
dealing with a multi-thing stock, and they arrange
recharging requests of things provided by a similar
provider. The related issue is known as the joint
renewal issue (JRP). The model is a joint recharging
model (JRM).
The fundamental idea of JRM is that few things
are requested from one provider utilizing similar
methods for transportation. The benefit of this JRM
is that it can limit the expense of messages and
transportation expenses acquired contrasted with
when requesting products separately. Requesting
and dispatching that is done all the while with bigger
parts and done once in a specific period for a wide
range of things required will surely have the option
to save money on message expenses and
transportation costs. Alternately, if a request is made
independently to a similar provider, there will be
rehashed orders. This, obviously, will make the
message expenses and transportation costs higher.
By deciding the ideal request time interim, the
correct request recurrence will be acquired with the
end goal that the expenses brought about can be
limited.
Research on joint recharging issues has been
done by a few scientists. Salameh et al., has looked
into JRM by thinking about item substitution. At the
point when the item requested at the provider level
isn't accessible, it is conceivable to supplant the
arranged thing. The examination centers around
quick-moving shopper products that have the
moderately deterministic interest are sold rapidly,
and with generally low costs, for example, toiletries,
and everyday necessities. Constrained work has been
done on stock-out based substitution under
deterministic interest inside the EOQ model setting.
Nagasawa et al. have been investigated about the
utilization of Genetic Algorithms for Can-Order
Policy on JRM. Research on JRP, where the item
under thought is an item that has weakening
properties, has been done by Li et al. In this
examination, the Joint recharging issue (JRP) model
with an exponential appropriation crumbling rate
was proposed. The target capacity of the JRP model
was to limit the arrangement costs, stock holding
expenses, and decay costs. Hereditary calculation
(GA) was utilized for tackling this issue and
inquired about were likewise made in angles, for
example, chromosome coding, wellness work,
determination, hybrid and transformation activities,
and so forth. The critical thinking arrangement
offered in this exploration is to utilize hereditary
calculations.
Wang et al. have been built up an Improved Fruit
Fly streamlining calculation (IFOA) to discover
answers for taking care of issues in JRP. The
outcome is IFOA can likewise be used to explain the
commonplace JRPs that have been demonstrated as
non-deterministic polynomial difficult issues.
Similar models uncover that the proposed IFOA can
discover preferred arrangements over the present
best calculation; consequently, it is a potential
device for different complex improvement issues.
While Tynan dan Kropp thinks about occasional
audit frameworks and joint recharging under
stochastic requests condition. To begin with, they
study the single item intermittent survey issue and
propose a basic arrangement method that is close
ideal. At that point, given the presence of this basic
system, they study the joint renewal issue for various
things under stochastic requests and propose basic
heuristics, which generally give excellent outcomes.
This examination finds the straightforward strategies
joined with the vigor of the cost capacity to be
appealing in different applications that require
coordination of process durations under stochastic
requests.
In view of a few past investigations, there has not
been much inquired about on the issue of the joint
recharged issue of multi-provider one locale. In this
examination, the JRP case will talk about where a
request is made by an organization to a few
providers in a similar region under stochastic
requests. Requesting a few things to every provider
depends on probabilistic requests with the JRM
approach. At that point, all requesting things from
every provider are solidified in a specific
distribution center to be sent together from Jakarta to
Yogyakarta. The arrangement strategy utilized in
deciding the requesting interim together that limits
the expenses brought about is the heuristic
technique.
3 EXPERIMENTS
This research is performed in PT XYZ Yogyakarta.
The research object is bag accessories in the number
Joint Replenishment Problem for Multi Supplier One Regional
403
of 56 items from January 2017 until December 2018.
Required research data involve data of request,
inventory costs, and lead time.
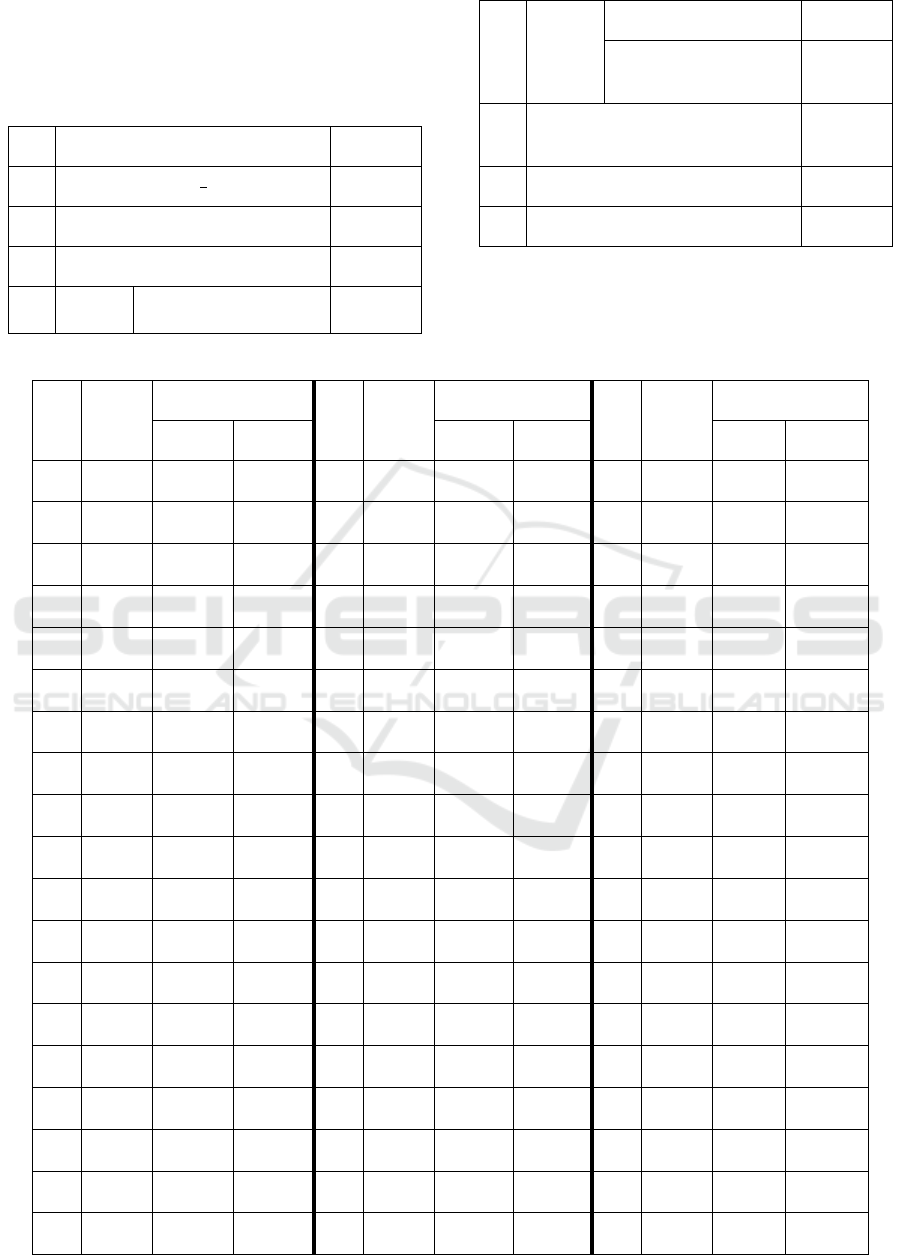
Table 1: Cost Data Collection
No Parameter Data
1 Request Data (D)
2 Purchase Price Data
3 Supplier Data
4 Order
Cost
Minor
(Administration,
Rp
telephone) (a) 20.000
Major
(transportation) (A)
Rp250.0
00
5 Storage Cost, Rp/item (h) Rp
2,663
6 Service level (z) 99%
7 Lead time, day (LT) 4
Table 2: Data of Request
No Code
Request
No Code
Request
No Code
Request
2017 2018 2017 2018 2017
2018
1
A01 15166 28878 20 A20 7000 1660 39
A39
6469 1680
2
A02 5327 20320 21 A21 7620 5878 40 A40 3000 996
3
A03 25186 34938 22 A22 19934 12713 41 A41 13655 12708
4
A04 21434 42796 23 A23 7169 3951 42 A42 15155 11701
5
A05 17649 15896 24 A24 4883 3321 43 A43 8328 14790
6
A06 15550 14382 25 A25 63490 49419 44 A44 2778 13456
7
A07 13541 13266 26 A26 3298 1147 45 A45 2618 1330
8
A08 15130 15207 27 A27 1624 1542 46 A46 21963 8945
9
A09 29118 51925 28 A28 27206 9186 47 A47 6218 2815
10
A10 6401 3423 29 A29 1603 1715 48 A48 4668 1638
11
A11 7206 6739 30 A30 6574 4356 49 A49 33000 29403
12
A12 7567 6773 31 A31 8000 2291 50 A50 39000 21326
13
A13 65425 52951 32 A32 7705 2625 51 A51 13516 8668
14
A14 5438 2978 33 A33 8513 3825 52 A52 11728 7768
15
A15 24200 19091 34 A34 5381 6658 53 A53 12923 10199
16
A16 2725 15274 35 A35 31600 21038 54 A54 13477 8281
17
A17 14067 15875 36 A36 1313 2321 55 A55 8829 7386
18
A18 13669 16393 37 A37 3255 1424 56 A56 3100 8953
19
A19 12741 16244 38 A38 3653 2310
ICBEEM 2019 - International Conference on Business, Economy, Entrepreneurship and Management
404
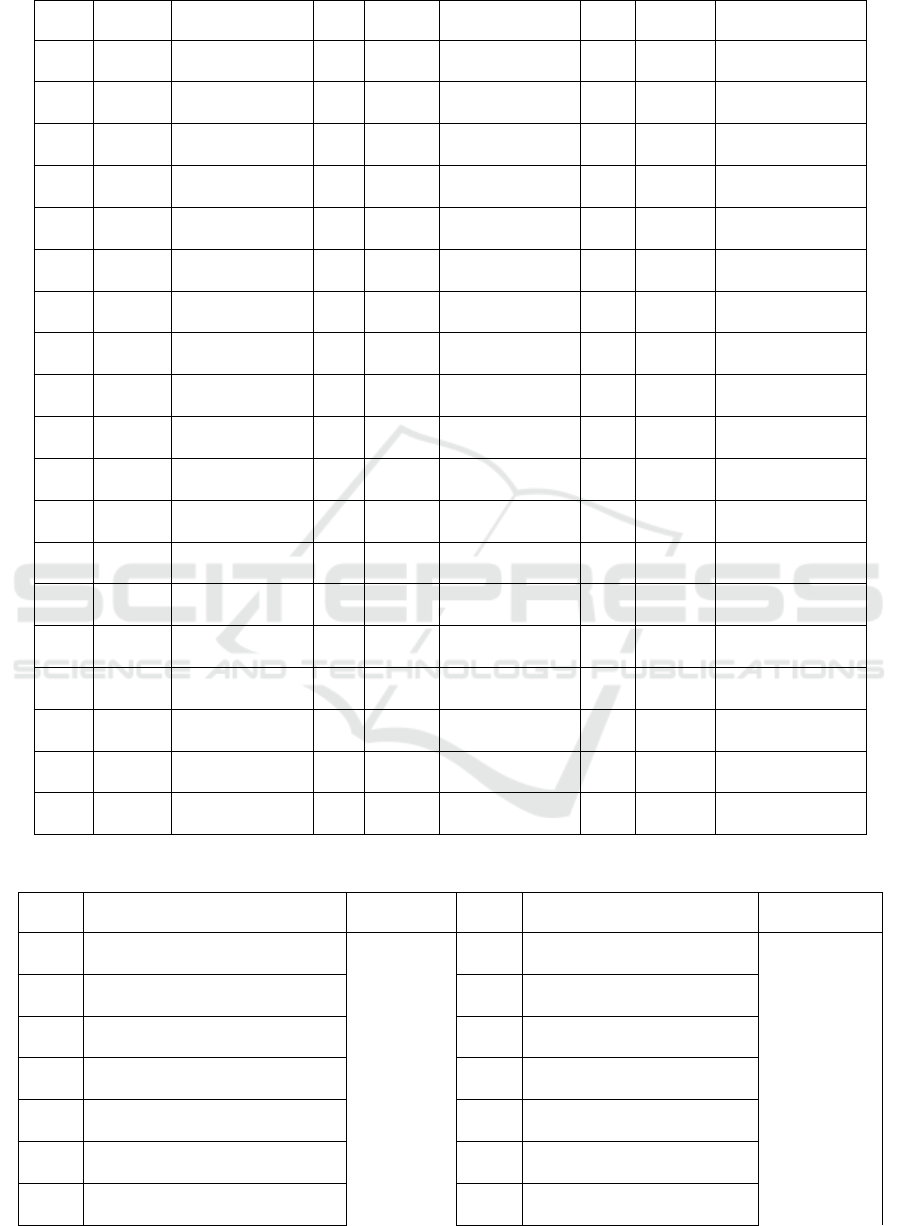
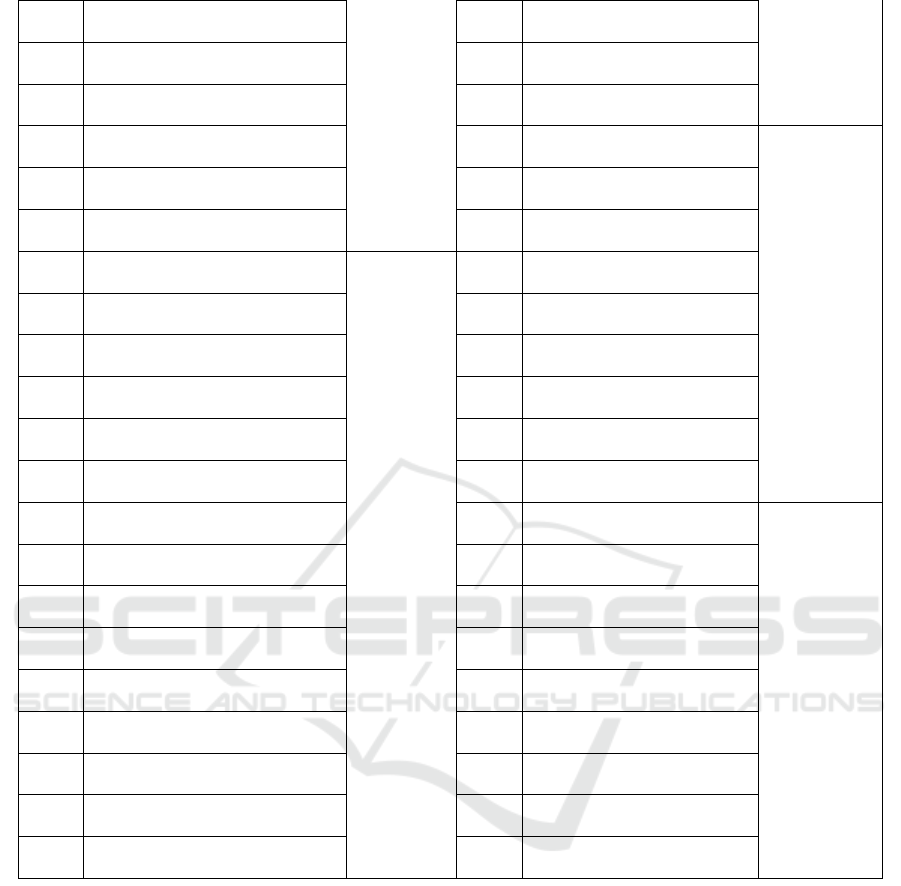
Table 3: Purchase Price Data
No Code
Price (Rp)
No Code
Price (Rp)
No Code
Price (Rp)
1
A01 1120 20 A20 360 39
A39
625
2
A02 750 21 A21 380 40 A40 632
3
A03 500 22 A22 395 41 A41 1050
4
A04 200 23 A23 410 42 A42 1150
5
A05 350 24 A24 425 43 A43 1190
6
A06 350 25 A25 175 44 A44 1205
7
A07 780 26 A26 210 45 A45 240
8
A08 507 27 A27 375 46 A46 495
9
A09 550 28 A28 425 47 A47 507
10
A10 820 29 A29 500 48 A48 550
11
A11 750 30 A30 675 49 A49 450
12
A12 450 31 A31 513 50 A50 180
13
A13 420 32 A32 575 51 A51 450
14
A14 300 33 A33 620 52 A52 180
15
A15 540 34 A34 650 53 A53 450
16
A16 300 35 A35 450 54 A54 500
17
A17 300 36 A36 500 55 A55 1350
18
A18 1150 37 A37 500 56 A56 750
19
A19 850 38 A38 619
Table 4: Supplier Data
Code Accessory Name Supplier Code Accessory Name Supplier
A01 Big Zipper
A35 Horse Buckle 1 cm
A02 Medium Zipper
A36 Horse Buckle 1,5 cm A
A05 Plastic YKK Zipper 05
A37 Horse Buckle 1,5 cm B
A06 Plastic YKK Zipper 03
A38 Horse Buckle 2,5 cm
A07 Metal YKK Zipper
A39 Horse Buckle 3,2 cm
Gesper
A08 Jacket YKK Zipper
Prima
A40 Horse Buckle 3,8 cm
88
A13 Zipper Head
Jakarta
A45 Buckle 1,5 cm
Joint Replenishment Problem for Multi Supplier One Regional
405
A14 Small Zipper Head
A46 Buckle 2,5 cm
A15 Leaf Zipper Head
A47 Buckle 3,5 cm
A16 Small Leaf Zipper Head 1
A48 Buckle 3,8 cm
A17 Small Leaf Zipper Head 2
A03 Button
A18 Metal Zipper Head NK
A04 Button Bearing
A19 Jacket Head Zipper
A10 Eyelet 1 cm
A20 Square Buckle 1,5 cm
A49 Solid Rivet T255
Mitra
A21 Square Buckle 2 cm
A50 Rivet Hole T255
Gesper
A22 Square Buckle 2,5 cm
A51 Solid Rivet T266
A23 Square Buckle 3 cm
A52 Rivet Hole T266
A24 Square Buckle 3,8 cm
A53 Short Rivet 277
A25 Ring D 1 cm
A54 Long Rivet 277
A26 Ring D 1,5 cm
Gesper
A09 Horse Chain
A27 Ring D 2 cm
88
A11 Ipod Rag
A28 Ring D 2,5 cm
A12 Ipod Rag Bearing
A29 Ring D 3 cm
A41 Roll Buckle 2 cm
Pola
A30 Ring D 3,8 cm
A42 Roll Buckle 2,5 cm
Indah
A31 Ring O 2 cm
A43 Roll Buckle 3,2 cm
A32 Ring O 2,5 cm
A44 Roll Buckle 3,8 cm
A33 Ring O 3,2 cm
A55 Magnet JP
A34 Ring O 3,8 cm
A56 Magnet HB
4 RESULTS
4.1 ABC Calculation
Step 1: Calculate the total cost per item
Step 2: Sorting out the total cost of each item from
the biggest until the smallest.
Step 3: Calculate the percentage of the total cost
Step 4: Classify each item into category A to the
value of 0-80%, category B to the value of 81%-
90%, and category C to the value of 91%-100%.
4.2 Distribution Test
The distribution test of request data is performed by
using Kolmogorov-Smirnov Method with SPSS. An
example of the calculation result can be seen in
Table 5.
ICBEEM 2019 - International Conference on Business, Economy, Entrepreneurship and Management
406
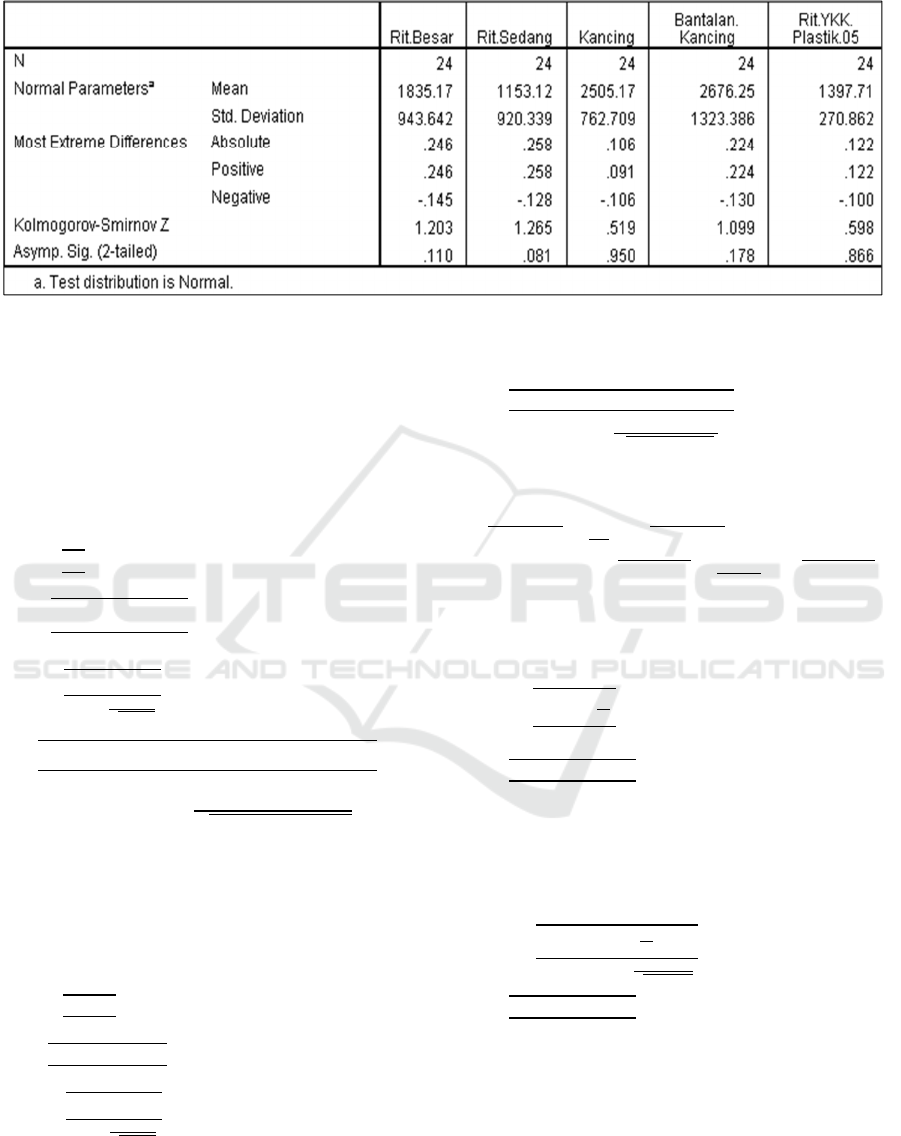
Table 5: Distribution test result
Note: Rit Besar = Big Zipper, Rit Sedang = Medium Zipper, Kancing = Button, Bantalan Kancing = Button
Bearing, Rit YKK Plastik 05 = Plastic YKK Zipper 05
4.3 Calculation of Joint Replenishment
Order
Iteration 1 for supplier 1
Step 1: Determining the value of T
i
*
(1)
220000
31,9622022
0,2383year.
∗
(2)
2
20000
31,9622022
2,327471,821
0,23830,0125
0,2773year
Step 2: Identification of the smallest T
i
*
value is
notated as item 1, with value of k
1
= 1 and other
items are notated as item 2,3,4,..,n. the smallest T
i
*
value is A13 so that it is notated k
1
= 1
Step 3: Determining T Value
(3)
,
= 0,5343 year
(4)
,
,,
,,,
= 0,5059 year
Step 4: Determining value of other k items in which
k
2
, k
3
, k
4
, , k
n
with trial and error
1
∗
1
, k
i
= q
(k = 1) =
11
1
,
,
11
1
= 0 0,4493 1,4142
(fulfilled)
Step 5: Determining T* value
∑
∑
,
= 0,3695 year
Step 6: Determining Total Cost (OT)
∑
∑
,
= 0,3558 year
Joint Replenishment Problem for Multi Supplier One Regional
407
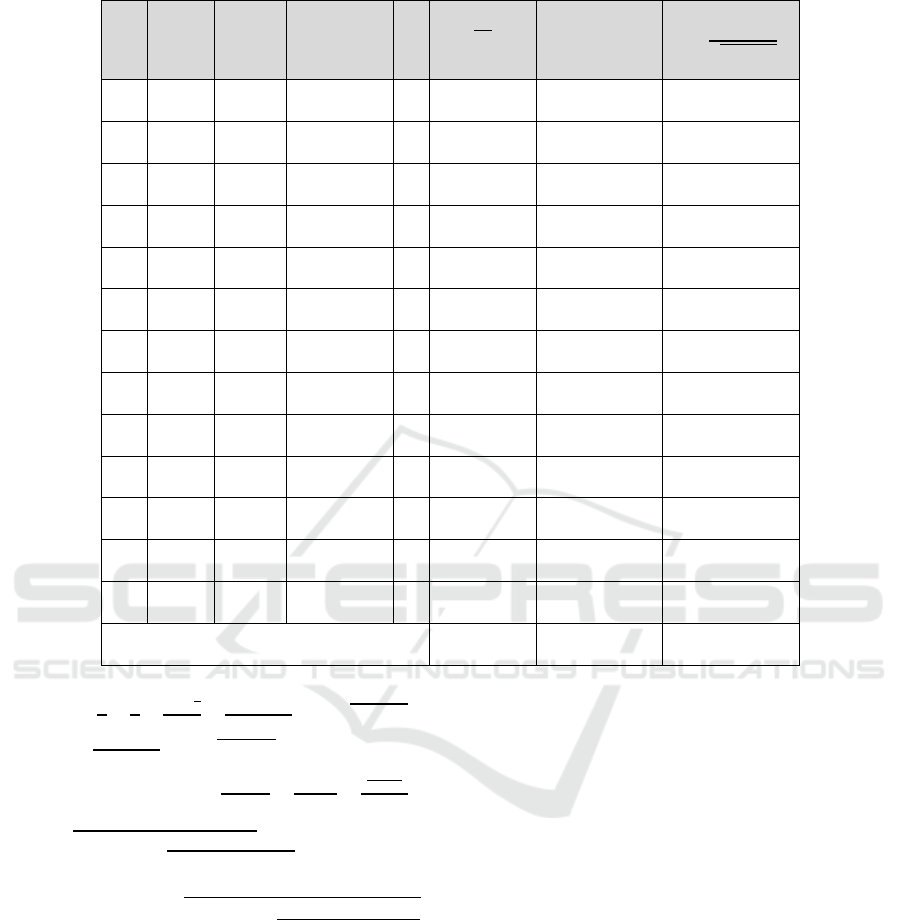
Table 6: Input of data OT supplier 1 (iteration 1)
No Code Di
k
i
h k
i
D
i
h k
i
(D
i
+
1 A01 22022 471,8210 1 20000 703831,6589 760602,5719
2 A02 12824 472,0729 1 20000 409844,0322 466645,2515
3 A05 16773 135,4311 1 20000 536055,6034 552351,0749
4 A06 14966 114,1129 1 20000 478319,163 492049,5679
5 A07 13404 90,4434 1 20000 428381,0571 439263,4785
6 A08 15169 125,9936 1 20000 484791,1415 499951,0645
7 A13 59188 1605,4512 1 20000 1891671,43 2084844,1178
8 A14 4208 159,9435 1 20000 134489,3116 153734,1932
9 A15 21646 660,2407 1 20000 691798,5729 771240,7091
10 A16 9000 320,9006 1 20000 287627,5095 326239,2267
11 A17 14971 230,4744 1 20000 478478,9649 506210,3350
12 A18 15031 234,6681 1 20000 480396,5882 508632,5526
13 A19 14493 250,1622 1 20000 463185,9194 493286,1812
Total 127830,08 7468870,95 8055050,325
OT =
∑
zσ
√
TLT
∑
zσ
√
TLT
(8)
=
,
,
,
,,
,
2,327
471,821
0,35580,0125
22022
0,35580,0125
31,96
2
2,327
471,821
0,35580,0125
= Rp1.075.540
Based on the result of the calculation, it obtains the
total cost for supplier 1 on iteration 1 is to the value
of Rp13.359.289/year. The next stage is iteration 2
started with step 4. If the result of iteration 2 is
smaller or the same with the previous iteration, then
stop, but if the obtained result of iteration is bigger
than the previous one, then it shall be continued to
the next iteration. The calculation for supplier 2,
supplier 3, and supplier 4 is using the same steps. In
consequence, it obtains optimal time (T*) of 0,3558
years 4 months with a total cost of Rp50.863.488,
and for 1 year, the obtained total cost is
Rp152.590.465.
ICBEEM 2019 - International Conference on Business, Economy, Entrepreneurship and Management
408
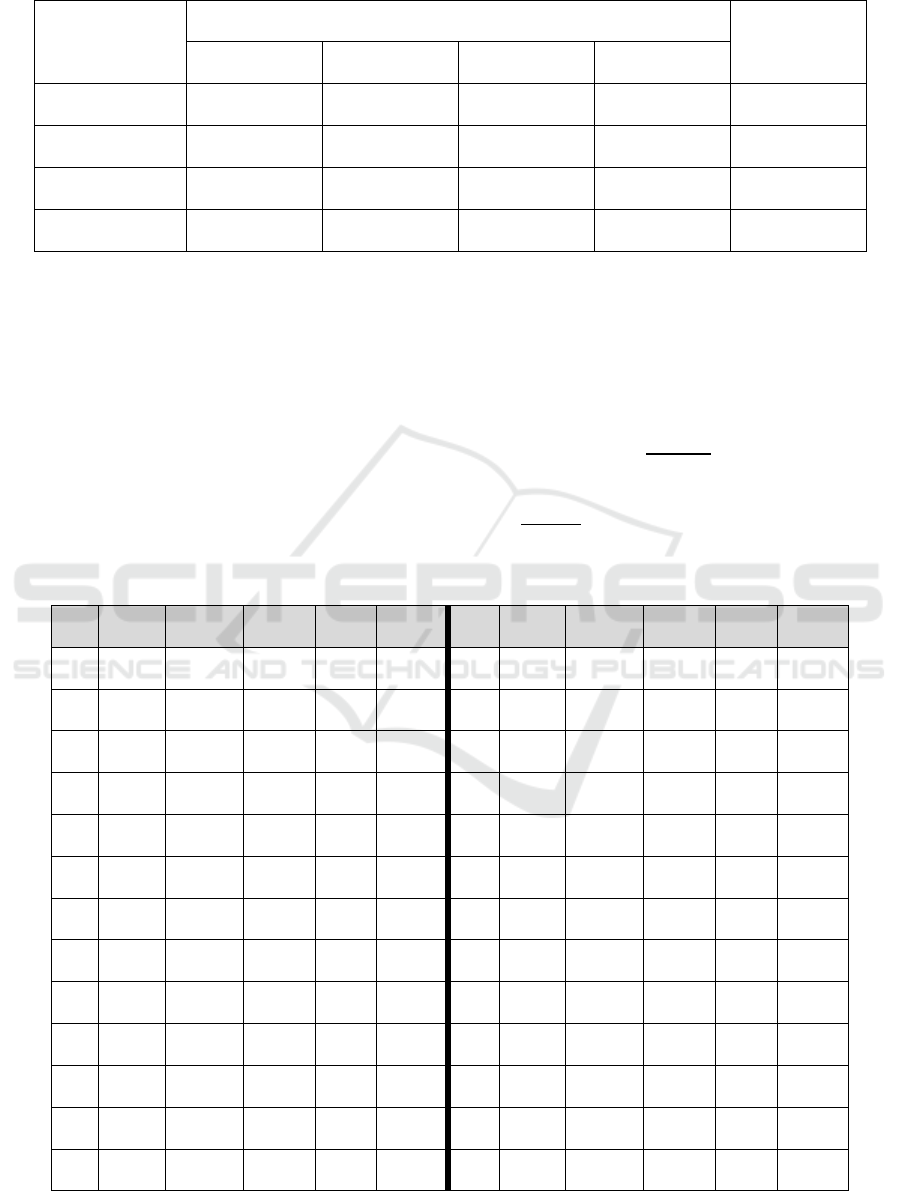
Table 7 Result of recapitulation
T*
Total cost (Rp)
TOTAL (Rp)
Supplier 1 Supplier 2 Supplier 3 Supplier 4
T*
1
= 0,3558 13,359,289 20,982,163 9,034,423 7.487.613 50.863.488*
T*
2
= 0,3962 13,483,820 21,159,823 9,198,838 7.348.389 51.190.870
T*
3
= 0,3703 13,483,820 21,214,991 9,133,900 7.475.538 51.308.248
T*
4
= 0,4229 13,694,912 20,992,152 9,214,931 7.732.542 51.634.537
4.4 Determining Order Quantity (Q)
Quantity obtains forecast result of 2019 and optimal
time (T*) of 0,3558 years. Forecast Result in 2019
uses Holt-Winters Additive Algorithm (HWA)
method and software WinQSB
Step 1: Determining the aggregate request.
Step 2: Determining the proportion of each item
Step 3: Calculating forecast by using software
WinQSB
Step 4: Calculating disaggregation
Step 5: Determining order quantity (Q) for each item
∗
(9)
4.5 Determining Safety Stock and
Inventory Level
Safety stock i = z
σ
T
LT
(10)
Inventory level i =
Table 8: Quantity, Safety stock and Inventory level
No Code D
forecast
Q SS IL No Code D
forecast
Q SS IL
1 A01 21919 7800 784 8858 29 A29 1657 590 216 826
2 A02 12767 4544 683 5386 30 A30 5446 1938 290 2296
3 A03 29921 10648 629 11650 31 A31 5125 1824 279 2167
4 A04 31964 11375 707 12481 32 A32 5145 1831 268 2164
5 A05 16694 5941 356 6505 33 A33 6145 2187 190 2454
6 A06 14898 5302 181 5668 34 A34 5995 2134 227 2436
7 A07 13345 4749 273 5189 35 A35 26195 9322 918 10567
8 A08 15101 5374 293 5855 36 A36 1813 646 253 921
9 A09 40329 14352 1332 16187 37 A37 2334 831 274 1134
10 A10 4893 1742 268 2070 38 A38 2973 1058 224 1319
11 A11 6944 2472 161 2719 39 A39 4060 1445 297 1792
12 A12 7140 2541 175 2805 40 A40 1994 710 133 867
13 A13 58903 20961 3496 25193 41 A41 13123 4670 473 5307
Joint Replenishment Problem for Multi Supplier One Regional
409
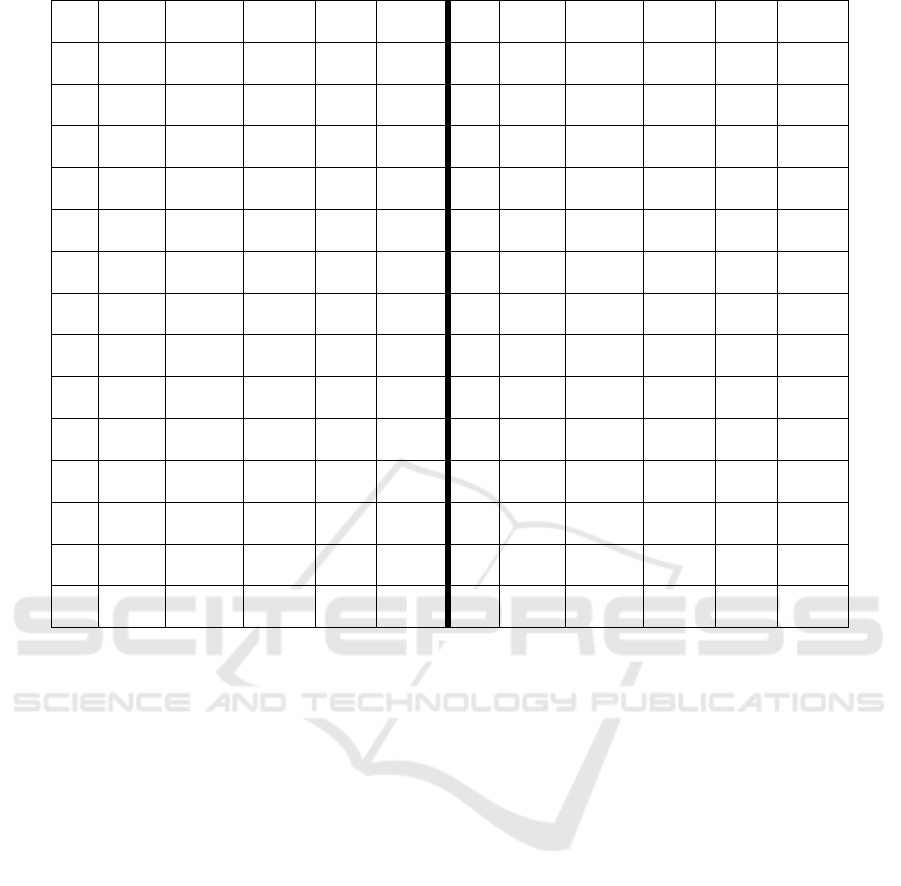
14 A14 4194 1493 275 1820 42 A42 13369 4758 398 5323
15 A15 21545 7667 1353 9289 43 A43 11508 4096 299 4538
16 A16 8961 3189 378 3679 44 A44 8082 2876 363 3340
17 A17 14903 5304 394 5883 45 A45 1970 702 144 870
18 A18 14963 5325 469 5980 46 A46 15384 5475 535 6202
19 A19 14428 5135 504 5818 47 A47 4501 1602 218 1876
20 A20 4316 1536 167 1756 48 A48 3142 1119 211 1368
21 A21 6722 2393 280 2756 49 A49 31054 11051 2506 13944
22 A22 16249 5783 732 6718 50 A50 30020 10683 1048 12105
23 A23 5542 1973 310 2352 51 A51 11042 3930 346 4413
24 A24 4087 1455 184 1690 52 A52 9707 3455 281 3857
25 A25 56185 19994 1960 22656 53 A53 11510 4096 508 4748
26 A26 2217 789 201 1017 54 A54 10830 3854 483 4472
27 A27 1580 563 212 794 55 A55 8074 2874 525 3499
28 A28 18113 6446 2416 9088 56 A56 6002 2136 365 2576
4.6 Result Analysis
Based on data processing result, request data
classification is obtained by Activity-Based Costing
(ABC) in which Category A consists of 25 items and
needs inventory cost to the value of 78,64%,
category B consists of 9 items which need inventory
cost to the value of 11,71%, and category C consists
of 22 items which need inventory cost to the value
of 10,34%. Request data which has been tested using
Kolmogorov-Smirnov with SPSS are including as
normal data, since the result of Asym. Sig is more
than 0,05. Stock control uses a joint replenishment
method to determine optimal order time. Stock
control is performed based on order cost, storage
cost, service level, and lead time. Accessory order
cost consists of major cost to the value of Rp250.000
and minor cost to the value of Rp20.000, the storage
cost of Rp31,96 per item per year, service level to
the value of 99% and lead time for 4 days or 0,0125
years.
Based on recapitulation result, it obtains the
smallest total cost of Rp50.863.488 with optimal
time (T*) in which T*
1
during 0,3558 year or 4
months. Total cost, which is obtained by the joint
replenishment order method for 1 year, is to the
value of Rp152.590.465, while the company method
is to the value of Rp198.411.763. Stock control uses
a joint replenishment method is aimed to determine
the optimal time in performing the order so that it
may save the total cost expelled by the company.
The system of stock control uses this method, and
the company can save Rp45.821.297 per year or
23%.
5 CONCLUSIONS AND FUTURE
WORK
Based on the data processing result, it can be
concluded that the company in performing
accessories order is not considering order time and
ordered quantity; thus, order by using a joint
replenishment order method can determine the
optimal time, quantity, safety stock, and inventory
level, so it minimizes inventory cost. In this method,
optimal order time (T*) of 0,3558 years or 4 months
with the total cost of Rp50.863.488 and quantity (Q)
are obtained. So that in one (1) year, there are 3
times of order, and the total cost is Rp152.590.465
ICBEEM 2019 - International Conference on Business, Economy, Entrepreneurship and Management
410

per year cheaper than the total cost of the company
method of Rp198.411.763, therefore there is saving
cost up to Rp45.821.297 or 23 %.
ACKNOWLEDGMENTS
The authors would like to thank the Institute for
Research and Community Service (LPPM) of UPN
"Veteran" Yogyakarta and Ministry of Research,
Technology, and the Higher Education Republic of
Indonesia for facilitating this research in Research
Scheme and providing financial support to produce
this publication.
REFERENCES
Bahagia, S. N., 2006, Sistem Inventori, Penerbit ITB,
Bandung, 2006.
Feng, H., Wu, Q., Muthuraman, K., & Deshpande, V.,
(2015), Replenishment policy for Multi-Product
Stochastic Inventory Systems with Correlated Demand
and Joint Replenishment Costs, Production and
Operations Management, 24(4), 647-664,
http://dx.doi.org/10.1111/poms.12290.
E.A. Silver, D.F. Pyke, R. Peterson, 1998, Inventory
Management and Production Planning and
Scheduling, third ed., Wiley, New York, 1998.
Elsayed, A.,(1994), .Analysis and Control of Production
Systems, Prentice Hall, Inc., New Jersey.
Eynan, A., dan Kropp, D.H., 1998, Periodic Review and
Joint Replenishment in Stochastic Demand
Environment, IIE Transaction, Vol. 30, pp: 1025-
1033, Washington.
I.K. Moon, S.K. Goyal, and B.C. Cha, 2008, The Joint
Replenishment Problem Involving Multiple Suppliers
Offering Quantity Discounts, International Journal of
System Science, Vol. 39, No. 6, June 2008, 629-637.
[3]
L. Nafisah, W. Sally, dan Puryani, (2016), Model
Persediaan pada Produk yang Mendekati Masa
Kadaluwarsa: Mempertimbangkan Diskon Penjualan
dan Retur, Jurnal Teknik Industri, Vol. 18, No. 1,63-
72, http://dx.doi.org/10.9744/jti.18.1.63-72, ISSN
1411-2485 (print) / ISSN 2087-7439 (online)
L. Nafisah, M.S.A. Khannan, and S.A. Shidiq, Economic
Ordering Policy of Deteriorating Item with
Incremental Discount under Permissible Delay in
Payments, ARPN Journal of Engineering and Applied
Sciences, Vol. 11, No. 16, August 2016, 9999-10003,
ISSN 1819-6608, Asian Research Publishing Network
(ARPN).
Li, C., Xu, X., & Zhan, D., (2009), Solving Joint
Replenishment Problem with Deteriorating items
Using Genetic Algorithm, journal of Advanced
Manufacturing Systems, 8(1), 305-310,
http://dx.doi.org/10.1016/j.ijpe. 2008.08.034.
Maisarah, D., Prassetiyo, H., dan Rispianda., 2015,
Rancangan Sistem Persediaan Bahan Baku Kertas
Menggunakan Metode Single Item Single Supplier
Dan Multi Item Single Supplier di CV Dwimuharam
Putra, Reka Integra ISSN: 2338-5081, Jurnal Online
Institut Teknologi Nasional, Vol. 03, No. 03, pp. 63-
74
M.K. Salameh, A.A. Yassine, B. Maddah, and L. Ghaddar,
(2014), Joint Replenishment Model with Substitution,
Journal Applied Mathematical Modelling, 38, page
3662-3671, www.elsevier.com/locate/apm.
Nagasawa, K., Irohara, T., Matoba, Y., & Liu, S., (2015),
Applying Genetic Algorithm for Can Order Policies in
The Joint Replenishment Problem, Industrial
Engineering and Management Systems, 14(1),1-10,
http:/dx.doi.org/10.7232/ iems.2015.14.1.001.
Sijabat, P.H., Alex, S., dan Emsosfi, Z., 2015, Rancangan
Sistem Persediaan Bahan Baku Karet Menggunakan
Model Persediaan Stokastik Joint Replenishment di
PT Agronesia, Reka Integra ISSN: 2338-5081, Jurnal
Online Institut Teknologi Nasional, Vol. 03, No. 03,
pp. 230-239.
Serena, D., dan Fatma, E., 2018, Analisis Pengendalian
Persediaan Menggunakan Metode Probabilistik
dengan Kebijakan Backorder dan Lot Sales, ISSN:
2527-4112, Jurnal Teknik Industri, Vol. 19, No. 1, pp.
38-48.
Tersine, R.J., 1994, Principles of Inventory and Material
Management, New Jersey: Prentice Hall, Inc.
Wang, L., Shi, Y., & Liu, S., (2015), An Improved Fruit
Fly Optimization Algorithm And Its to Joint
Replenishment Problems, Expert Systems with
Application, 42(9), 4310-4323,
http://dx.doi.org/10.1016/j.eswa. 201501.048
Joint Replenishment Problem for Multi Supplier One Regional
411
