
Soil Nutrient Content Classification for Essential Oil Plants
using kNN
Yoke Kusuma Arbawa
1
and Candra Dewi
1
1
Department of Informatics Engineering, Faculty of Computer Science, Brawijaya University, Malang, Indonesia,
Keywords: Essential Oils, Soil Image, Soil Nutrient, Image Processing, GLCM, k-NN.
Abstract: Essential oils can grow well and produce good quality of essential oils if planted in an area that has sufficient
nutrient content. In this study, the classification of soil nutrient content was carried out using soil images as
an alternative to soil testing in the laboratory. The nutrient content identified in this study is Nitrogen,
Phosphorus, and Potassium (N, P, K). The identification process begins with the extraction of soil texture
features using the Gray-Level Cooccurrence Matrix (GLCM) and continues with the classification of nutrient
content using k-NN. As a comparison in the calculation, the validation process used data from nutrient testing
results in the laboratory. Based on the results of tests on 693 data training and 297 data testing of soil images,
test results are obtained accuracy of 90.5724% for Nitrogen, 92.9293% for Phosphorus, and 91.9192% for
Potassium. These results indicate that image processing in soil images can be used as an alternative in
identifying soil nutrient content.
1 INTRODUCTION
Essential oil plant is very useful in the industry of
perfume, cosmetics, food, and medical (Elshafie and
Camele, 2017). The results of the extraction of
essential oil plants are oils that have special contents
with different uses. An example is citronella oil that
has the advantage of being able to repel mosquitoes
(Silva et. Al., 2011). The other is Patchouli oil which
has an aroma like wood which is widely used in
famous perfumes and others (Van-Beek and Joulain,
2018).
Essential plants require adequate nutrition in the
soil to produce high quality and quantity of oil. An
example is patchouli plants that need about 25% of
NPK nutrients (Nitrogen, Phosphorus and Potassium)
from the soil (Singh et al., 2015). Study by El-Sayed,
et. al (2018) also found a significant effect of the
Nitrogen and phosphorus nutrients on the growth of
citronella plants so that it can improve the yield of
citronella oil refining (El-Sayed et al., 2018).
Therefore, it is necessary to check the nutrient content
before the soil is planted with essential plants.
Currently, one of the methods used to determine soil
nutrient content is through testing soil samples in the
laboratory. However, this method requires quite a
long time and of course using chemicals that can
sometimes be dangerous. This study proposes an
alternative way to identify nutrient levels in soils by
utilizing soil image.
The identification of nutrient levels in soils using
image processing requires a specified algorithm. In
this study, the process of recognition is done by
performing classification using k-Nearest Neighbor
(kNN). This method works easily by calculating the
distance between one data with the whole data. So, it
can be done quite fast (Azlah et.al, 2019). In addition,
to produce good recognition is needed the appropriate
features as input into the classification process. This
study uses the texture features that are extracted using
Gray-Level Cooccurrence Matrix (GLCM). GLCM
has the advantage of providing texture information
from an image so that it can represent the texture of
the actual object (Yalcin, 2015).
2 THEORY
2.1 Nutrient Soil Criteria (N, P, and K)
There are various kinds of nutrients, some of the most
important are Nitrogen, Phosphorus, and Potassium
(N, P, and K). This nutrient is found in the soil to help
essential plants to develop and produce the amount of
oil production and oil yield (Gajbhiye et al., 2013).
The criteria levels range from very low to very high,
the criteria for Nitrogen are presented in Table 1, the
96
Kusuma Arbawa, Y. and Dewi, C.
Soil Nutrient Content Classification for Essential Oil Plants using kNN.
DOI: 10.5220/0009957400960100
In Proceedings of the 2nd International Conference of Essential Oils (ICEO 2019), pages 96-100
ISBN: 978-989-758-456-5
Copyright
c
2020 by SCITEPRESS – Science and Technology Publications, Lda. All rights reserved

criteria for phosphorus are presented in Table 2 and
the criteria for Potassium are presented in Table 3.
Table 1: Criteria for Nitrogen
N.Total (%)
Criteria
<0.1
Very Low
0.1 - 0.2
Low
0.21 - 0.5
Moderate
0.51 - 0.75
High
>0.75
Very High
Table 2: Criteria for Phosphorus
P.Bray1 (%)
Criteria
<10
Very Low
10 - 15
Low
16 - 25
Moderate
26 - 35
High
>35
Very High
Table 3: Criteria for Potassium
K NH4OAc1N pH 7 (%)
Criteria
<0.1
Very Low
0.1 - 0.29
Low
0.3 - 0.59
Moderate
0.6 - 1.0
High
>1.0
Very High
2.2 Gray-Level Co-occurrence Matrix
(GLCM)
Image processing is a process to get information in an
image so that it can be processed to become valuable
information. Information that can be used in imagery
such as color, texture, and shapes taken from the color
values in the image. Implementation of image
processing in the classification of nutrients in the soil
required information from the soil image. In this
study, we use information in the form of textures from
soil images. This soil image texture feature represents
soil texture which has different soil nutrient criteria.
The texture feature that we use is the Gray Level Co-
occurrence Matrix.
GLCM is an extraction that has often been used
by researchers to obtain texture features from images.
GLCM is a matrix n x n that contains the opportunity
value of meeting pairs of pixel values between
neighbors (Kekre et al., 2010). Determining the
probability of meeting pairs of neighboring pixel
values is determined by the distance value (d =
0,1,2,3,4) and the angle of neighbor orientation (θ =
0
o
, 45
o
, 90
o
, and 135
o
). In this GLCM feature
extraction, the color space used is grayscale with a
range of pixel values from 0 to 255 (Asery, Sunkaria,
Sharma, & Kumar, 2016). The GLCM matrix is then
used to calculate the value of the feature to be used.
This research uses Contrast, Dissimilarity,
Homogeneity, Energy, Correlation and Angular
Second Moment (ASM) of GLCM features
(Deenadayalan et al., 2019).
2.3 K-Nearest Neighbor (KNN)
Image processing results cannot be directly used for
classification. Classification requires a computational
algorithm for computers to learn what will be
classified. There are several algorithms that can be
used as a classification algorithm such as neural
networks, kNN, SVM and others. One algorithm that
has simple computation is k-Nearest Neighbor
(kNN).
kNN is an unsupervised learning classification
method wherein directly calculates the value of the
distance between the tested data and the training data
(Alalousi et al., 2016). Then the tested data are
classified according to the data objects that appear the
most with the smallest distance value a number of k =
3, 5, 7, 9 ... n values. The steps of the KNN algorithm
are as follows (Guo et al., 2006):
1. Calculate the value of the distance between the
tested data and the training data.
2. Sort the smallest distance value to the largest
distance value.
3. Determine the value of k and retrieve data from
a number of values k value of the top distance
4. Calculate the class frequency from the data
taken in step 3.
5. Classification is taken from the class that has the
most frequency from step 4.
3 METHOD
3.1 Data Acquisition
Data was taken from several different locations,
namely Dilem Wilis-Trenggalek, Tulungagung,
Kesamben-Blitar, Ngijo-Malang, UB Forest-Malang
and Institut Atsiri-Malang. Soil samples taken are
land planted with essential oil plants. The sample of
soil taken is soil from 20-30 cm depth from surface.
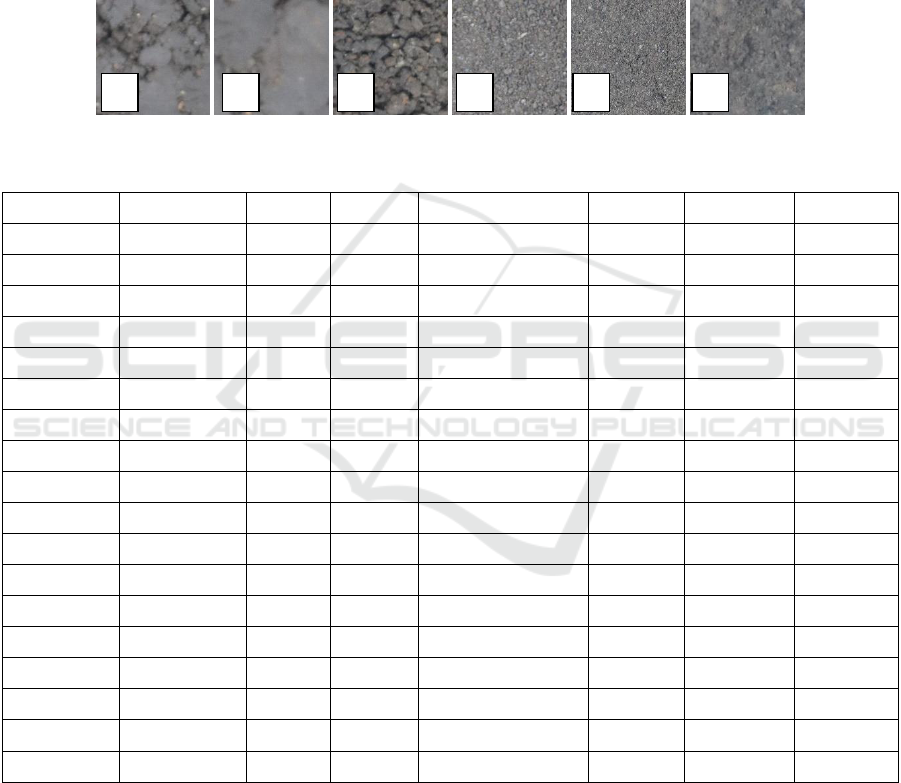
Soil images are taken using a DSLR camera on a
ministudio that has a stable light. Some soil images
samples are presented in Figure 1.
Soil Nutrient Content Classification for Essential Oil Plants using kNN
97
Data validation was carried out by laboratory tests
to obtain levels of nutrients and nutrients in the soil.
Laboratory tests were conducted at the Soil
Chemistry Laboratory of Agriculture Faculty,
University of Brawijaya. Laboratory test results are
shown in Table 4.
3.2 Classification Process
The classification process begins with the input of
soil imagery. then the feature extraction process is
performed using GLCM which generates the value of
GLCM features. These feature values are then
normalized so that the data range is not too wide.
After that, the classification process using kNN is
done using a normalized dataset. Classification
results are in the form of class predictions from the
tested data and then the accuracy is calculated. The
output results are in the form of test data class
predictions and accuracy values of the system.
Figure 1: a. Trenggalek, b. Institut Atsiri, c. Kesamben, d. Ngijo, e. Tulungagung, f. UB Forest
Table 4: Test Result of Soil Nutrient (N, P, and K)
Soil Sample
Location
N.Total
P.Bray1
K NH4OAc1N pH 7
N Class
P Class
K Class
DW1
Dilem Wilis
0.08
1.57
0.77
Very Low
Very Low
High
DW2
Dilem Wilis
0.07
0.08
0.32
Very Low
Very Low
Moderate
DW3
Dilem Wilis
0.07
0.76
0.24
Very Low
Very Low
Moderate
DW4
Dilem Wilis
0.08
0.78
0.1
Very Low
Very Low
Low
DW5
Dilem Wilis
0.09
0.79
0.1
Very Low
Very Low
Low
DW6
Dilem Wilis
0.09
2.26
0.14
Very Low
Very Low
Low
IA1
Institut Atsiri
0.14
9.04
0.72
Low
Very Low
High
IA2
Institut Atsiri
0.16
7026
0.27
Low
Very Low
Low
KS1
Kesamben
0.12
24.54
1.3
Low
Moderate
Very High
KS2
Kesamben
0.1
0.84
0.06
Low
Very Low
Very Low
KS3
Kesamben
0.13
2.39
0.17
Low
Very Low
Low
NGIJO1
Ngijo
0.09
2.5
1.06
Very Low
Very Low
Very High
NGIJO2
Ngijo
0.06
0.82
0.5
Very Low
Very Low
Moderate
TA1
Tulungagung
0.05
10.31
0.07
Very Low
Low
Very Low
TA2
Tulungagung
0.03
2.18
0.05
Very Low
Very Low
Very Low
TA3
Tulungagung
0.05
133.74
0.28
Very Low
Very High
Low
UBF1
UB Forest
0.34
1.61
0.45
Moderate
Very Low
Moderate
UBF2
UB Forest
0.46
0.81
0.39
Moderate
Very Low
Moderate
a
b
c
d
e
f
ICEO 2019 - 2nd International Conference of Essential Oil Indonesia
98

Figure 2: Flowchart of soil nutrient classification using kNN
4 RESULTS
The data used in this study were 990 data from 6 data
collection locations. The data is divided into 70% for
training data and 30% for test data. Each of the N, P,
and K nutrition categories was carried out equally.
Class labeling (very low, low, medium, high and very
high) in accordance with the dataset that has been
tested for nutrient content in the soil in the
methodology. The Nitrogen dataset from data
acquisition only consists of 3 classes, namely very
low, low and medium. The Phosphorus dataset from
data acquisition consists of 4 classes without "high"
classes. While the Potassium dataset from data
acquisition consists of 5 classes.
Testing is done using variations in the value of k.
the variation in k values used are 3, 5, 7, 9, 11, 13, 15
and 17. The results of the Nitrogen nutrient
classification test in the soil are presented in Table 5.
The results of the Phosphorus nutrition test in the soil
are presented in Table 6, while the results of the
Potassium nutrition test in the soil are presented in
Table 7.
Nitrogen nutrient classification in the soil gets the
highest accuracy value of 90.5724%. These results
are obtained by using the value k = 3. other than that
each k value increases accuracy decreases, but the
accuracy obtained is still above 85%. The average
value obtained using the value k = 3 to k = 17 is equal
to 89.2256%.
Other test results from Phosphorus nutrients in the
soil obtained an average accuracy of 91.8350%. The
highest accuracy value obtained is 92.9293% at k = 3.
Accuracy values obtained from values k = 3 to k = 17
are stable at an accuracy of 90% to 92%. These results
are better than in nitrogen nutrient testing in soils
there are still some accuracy below 90%. In this test
all uses of k values get accuracy above 90%.
Table 5: The results of testing the accuracy of nitrogen
nutrients in the soil
k
Accuracy (%)
3
90.5724%
5
89.8990%
7
89.2256%
9
89.5623%
11
88.8889%
13
88.8889%
15
88.5522%
17
88.2155%
Average
89.2256%
Table 6: The results of testing the accuracy of phosphorus
nutrients in the soil
k
Accuracy (%)
3
92.9293%
5
91.9192%
7
90.9091%
9
91.2458%
11
92.2559%
13
91.9192%
15
91.5825%
17
91.9192%
Average
91.8350%
The last test was the classification of nutrients in
the soil Potassium. In this test, the best accuracy value
is 91.9192%. The accuracy value decreases when
using the values k = 5 to k = 17 with accuracy below
90%. The average accuracy value from k = 3 to k =
Soil Nutrient Content Classification for Essential Oil Plants using kNN
99

17 is 89.1835%. This result is very good because the
accuracy value obtained is still above 85%.
Table 7: The results of testing the accuracy of potassium
nutrients in the soil
k
Accuracy (%)
3
91.9192%
5
90.9091%
7
88.8889%
9
89.5623%
11
88.5522%
13
88.2155%
15
87.8788%
17
87.5421%
Average
89.1835%
From the above results, the kNN classification
can classify NPK nutrients in the soil using images
with an average of 90%. These results can be
concluded that the use of image processing can be
used as an alternative classification of NPK nutrients
in the soil. In addition, the texture feature values in
GLCM can represent textures from soil imagery.
5 CONCLUSIONS
Referring to the test result, obtained an accuracy
value of identification of nutrient N in the soil is
90.5724%, an accuracy value of identification of
nutrient P in the soil is 92.9293%, and an accuracy
value of identification of nutrient K in the soil is
91.9192%. These results indicate that image
processing soil images can be used as an alternative
way of identifying soil nutrient content.
REFERENCES
Alalousi, A., Razif, R., AbuAlhaj, M., Anbar, M., and
Nizam, S., 2016. A Preliminary Performance
Evaluation of K-means, KNN and EM Unsupervised
Machine Learning Methods for Network Flow
Classification. International Journal of Electrical
and Computer Engineering (IJECE), 6(2), 778.
Asery, R., Sunkaria, R. K., Sharma, L. D., and Kumar, A.,
2016. Fog detection using GLCM based features and
SVM. Conference on Advances in Signal
Processing, CASP 2016, 72–76.
Azlah, M. A. F., Chua, L. S., Rahmad, F. R., Abdullah, F.
I., and Alwi, S. R. W., 2019. Review on techniques
for plant leaf classification and recognition.
Computers, 8(4).
Deenadayalan, D., Kangaiammal, A., and Poornima, B. K.,
2019. Integrated Intelligent Computing,
Communication and Security.
El-Sayed, A., El-Leithy, A., Swaefy, H., and Senossi, Z.,
2018. Effect of NPK, Bio and Organic Fertilizers on
Growth, Herb Yield, Oil Production and Anatomical
Structure of (Cymbopogon citratus, Stapf) Plant.
Annual Research & Review in Biology, 26(2), 1–15.
Elshafie, H. S., and Camele, I., 2017. An overview of the
biological effects of some mediterranean essential
oils on human health. BioMed Research
International, 2017.
Gajbhiye, B. R., Momin, Y. D., and Puri, A. N., 2013.
Effect of FYM and NPK Fertilization on Growth and
Quality Parameters of Lemongrass (Cymbopogon
flexuosus). Agricultural Science Research Journals,
3(4), 115–120.
Guo, G., Wang, H., Bell, D., Bi, Y., and Greer, K., 2006.
Using kNN model for automatic text categorization.
Soft Computing, 10(5), 423–430.
Kekre, H. B., Thepade, S. D., Sarode, anuja K., and
Suryawanshi, V., 2010. Image Retrieval using
Texture Features extracted from GLCM, LBG and
KPE. International Journal of Computer Theory and
Engineering, 2(5), 695–700.
Singh, R., Singh, M., Srinivas, A., Rao, E. V. S. P., and
Puttanna, K., 2015. Assessment of organic and
inorganic fertilizers for growth, yield and essential
oil quality of industrially important plant patchouli
(Pogostemon cablin) (blanco) benth. Journal of
Essential Oil-Bearing Plants, 18(1), 1–10.
Van-Beek, T. A., & Joulain, D., 2018. The essential oil of
patchouli, Pogostemon cablin: A review. Flavour
and Fragrance Journal, 33(1), 6–51.
Yalcin, H., 2015. Phenology monitoring of agricultural
plants using texture analysis. 2015 4th International
Conference on Agro-Geoinformatics, Agro-
Geoinformatics 2015, 338–342.
ICEO 2019 - 2nd International Conference of Essential Oil Indonesia
100
