
Hybrid of Wavelet Feature Extraction and LVQ Neural Network to
Recognize Patchouli Variety using Leaf Images
Candra Dewi
1
1
Department of Informatics, Brawijaya University, Veteran Street, Malang, Indonesia
Institute of Essential Oil, Brawijaya University, Malang, Indonesia
Keywords: Patchouli Variety, Leaf Image, Wavelet Feature Extraction, LVQ Neural Network.
Abstract: Patchouli consist of some varieties that have different patchouli alcohol (PA). This variety can be recognized
by experts who dabbling with patchouli plants through observation of shape and texture of the leaf. This study
introduced a new method to identify patchouli varieties by utilizing leaf images. The wavelet feature
extraction was used to obtain leaf texture characteristics. The varieties then are identified by using Learning
Vector Quantization (LVQ) Neural Network algorithm. The results of testing on 40 leaf image data showed
the value of recognition accuracy of patchouli varieties reached 83, 33%. This result is obtained by wavelet
parameters namely doubechies level 3, doubechies coefficient 3, and LVQ parameters, namely learning rate
0.1 learning rate reduction constant 0.2. These results can be said to be quite good considering that the
patchouli leaf tested have almost similar shape and color.
1 INTRODUCTION
Patchouli (Pogostemon cablin Benth) is one of the
essential plants that belongs to the family Labiateae.
This plant was first cultivated in the Aceh region, then
spread in several provinces such as North Sumatra,
West Sumatra, and Bengkulu. Patchouli plants
produce essential oils known as patchouli oil.
There are three types of patchouli in Indonesia
that can be distinguished by morphological character,
patchouli alcohol content (PA) and oil quality, as well
as resistance to biotic and abiotic stresses. The three
types are Pogostemon cablin Benth (Aceh patchouli),
Pogostemon heyneanus Benth (Java patchouli), and
Pogostemon hortensis Backer (Soap patchouli)
(Guenther, 1952). Of the three types, Pogostemon
cablin Benth has the highest oil content and good
composition. While Pogostemon heyneanus Benth or
Javanese patchouli more resistance to pests and
diseases, bacterial wilt and nematodes (Nuryani et al.,
1997). Besides Javanese patchouli is also resistant to
a disease, called budok in Indonesian which is caused
by the fungus Synchytrium pogostemonis (Wahyuno
and Sukamto, 2010).
Based on the description above, it can be
concluded that the selection of patchouli varieties
during crop cultivation is very necessary in order to
obtain an optimal harvest. One specific characteristic
that distinguishes patchouli varieties visually is found
in the leaves. For example, the leaves in the
Lhokseumawe variety are green and have a flat,
rounded leaf tip. While the leaves of the Sidikalang
variety are purplish green and the tips of the leaves
are flat and rounded. These differences in physical
characteristics can sometimes be recognized by
experienced of experts or farmers. However, each
variety will have different characteristics if planted in
different regions, making it even more difficult to
recognize. For example, Sidikalang varieties from
Aceh will have different leaf color and texture
characteristics if planted in Kolaka, Sulawesi. This is
often unknown to farmers and only certain experts
can recognize it. To adopt a limited number of expert
capabilities, a technology is needed in the process of
identifying patchouli leaf varieties. This paper
proposed a new method for identification of patchouli
varieties using leaf imagery. Specifically, the purpose
of this study is 1) to obtain the characteristics of leaf
texture by extracting texture features 2) to calculate
the accuracy of the recognizing of patchouli varieties
using leaf images.
Several studies on the use of leaf image
processing technology for plant identification have
been carried out. Among them is the identification of
plants through leaf shapes by counting the number of
22
Dewi, C.
Hybrid of Wavelet Feature Extraction and LVQ Neural Network to Recognize Patchouli Variety using Leaf Images.
DOI: 10.5220/0009954800220028
In Proceedings of the 2nd International Conference of Essential Oils (ICEO 2019), pages 22-28
ISBN: 978-989-758-456-5
Copyright
c
2020 by SCITEPRESS – Science and Technology Publications, Lda. All rights reserved

leaf shape patterns, PCA, and EF (Chong et al., 2015;
Laga et al., 2014; Neto et al., 2006). Furthermore,
several studies have also been carried out for leaf
classification through texture, shape, and color
features using PSO and FRVM (Lakshmi and
Vasudef, 2016); leaf identification using DBNs and
PID (Liu and Jiang-ming, 2016); Android application
for identification of plant species based on leaf
imagery (Zhao et al., 2015); plant leaf identification
based on leaf skeleton (Zang et al., 2016);
identification of plant species based on leaf texture
(Pahikkala et al., 2015); and classification of plants
based on leaf images using backpropagation ANN
method (Aakif and M. Faisal, 2015). Other related
research is the identification of plant leaves with three
extraction features, namely shape features using the
SIFT method, color features using the color moment
method, and texture features using the SFTA method.
The use of these three features resulted in an
identification accuracy of 94% (Jamil et al., 2015).
These studies provide good enough results so that the
leaf image is quite effective for the identification of
certain plants.
In contrast to previous studies where it was used
to identify different types of plants using leaf images,
this study distinguishes plants with the same type
namely patchouli, but having different varieties. The
level of difficulty in this study lies in the
characteristics of the leaves are almost the same, so
we need an appropriate feature extraction method.
Based on field observations and discussions with
experts, it is known that almost all young patchouli
leaves have a green color and are getting red as the
plant ages. These color characteristics cannot be used
to distinguish between one variety to another. Besides
the shape of the leaves, another characteristic that can
be used to distinguish patchouli varieties is the texture
of the leaves where several varieties have slightly
different textures. To get information about leaf
texture that is almost similar requires a specific
method so that the slightest difference can be known
in detail. Of the several methods available, extraction
of texture features using wavelet texture analyzers is
one suitable alternative for patchouli leaf problems.
Wavelet ability has been demonstrated in several
studies such as in the research of Abdolmaleki et al
(2017) which extracted spectral features on
hyperspectral images and produced good
recommendations for the detection of copper
deposits. Research conducted by Bakhshipour et al.,
2017 also shows that feature extraction with wavelets
can increase the effectiveness of the weed detection
process in beet plants. Other research also shows that
the use of wavelets in feature selection can improve
performance in the recognition process (Singh et al.,
2016; Murguia et al., 2013; Imtiaz and Fattah, 2013).
In contrast to previous studies, this study used
daubechies wavelet in the transformation process.
Daubechies wavelet uses overlapping windows, so
the spectrum of high frequency coefficient represents
all high frequency changes. A daubechies level and
coefficient were also tested to get the best texture
features that can distinguish between leaf
characteristics.
The best features of each leaf image obtained from
the feature extraction process are then used as input
to the variety recognition process. This study uses the
Learning Vector Quantization (LVQ) algorithm
which is one of the Neural Network based
classification algorithms as the recognition method.
The use of the LVQ method has been done in previous
studies, namely to identify the quality of patchouli
using leaf images (Dewi et al., 2016), identification
of diseases of soybean leaves (Dewi et al., 2016;
Dewi, 2017), identification of diseases on orange
leaves (Dewi and Basuki, 2016). Research conducted
by Desylvia (2013), discusses the comparison of
SOM and LVQ in the identification of facial images
with wavelets as feature extraction. This study
concludes that the LVQ method is better than the
SOM method, with accuracy for SOM is 97.894%
and accracy for LVQ is 100% Desylva, 2013).
Furthermore, research conducted by Nurkhozin
(2011) classifies diabetes mellitus by using the LVQ
and Backpropagation method, wherein it is known
that LVQ provides a higher accuracy than
Backpropagation. The study gave 82.56% results for
LVQ and 73.25% for Backpropagation for
classification using learning rate = 0.5, number of
iteration = 100, training data were 345 and test data
were 86 patients. The above reference shows that the
use of LVQ in the identification process provides
quite optimal results.
2 DATA AND METHOD
This section gives the explanation of data and general
steps of recognizing the patchouli varieties.
2.1 Identification of Patchouli Leave
Characteristic
Patchouli is one of the plants that produce essential
oils and belongs to the Labiatea family. One of the
characteristics that can be used to identify patchouli
varieties is by observing leaf morphology (Haryudin
and Suhesti, 2014). In general, the shape of patchouli
Hybrid of Wavelet Feature Extraction and LVQ Neural Network to Recognize Patchouli Variety using Leaf Images
23
leaves is round and oval, with serrated leaf edges. The
shape of the tip of the leaf is pointed and leaf base is
generally blunt. Repetition of leaves almost all
pinnate accessions. The shape of the surface of old
leaves on the top of leaves is smooth wavy while the
lower surface of leaves is smooth or flat. The surface
character of the old leaf at the top is rough bumpy.
However, according to experts there are specific
characteristics on the leaves that distinguish patchouli
varieties. An example is the difference between the
Aceh patchouli and the Javanese patchouli. On Aceh
patchouli the surface of the leaves is smooth, jagged
blunt, the tip of the leaf is pointed. While the Javanese
patchouli leaves the surface of the leaves rough, the
edges of the leaves are jagged and tapered leaves.
Aceh Patchouli is more cultivated because it has
higher oil content and oil quality. This paper uses
wavelet feature extraction to obtain this texture
charactestics.
2.2
Data
The data used were taken in several regions namely
Kesamben, Brawijaya University (UB) and
Trenggalek. Data taken is image of Diploid patchouli
leaves (Kesamben and UB), Patchoulina and
Sidikalang (Trenggalek), Tetraploid (UB). Overall
data of 60 data with each variety of 10 to 20 data. An
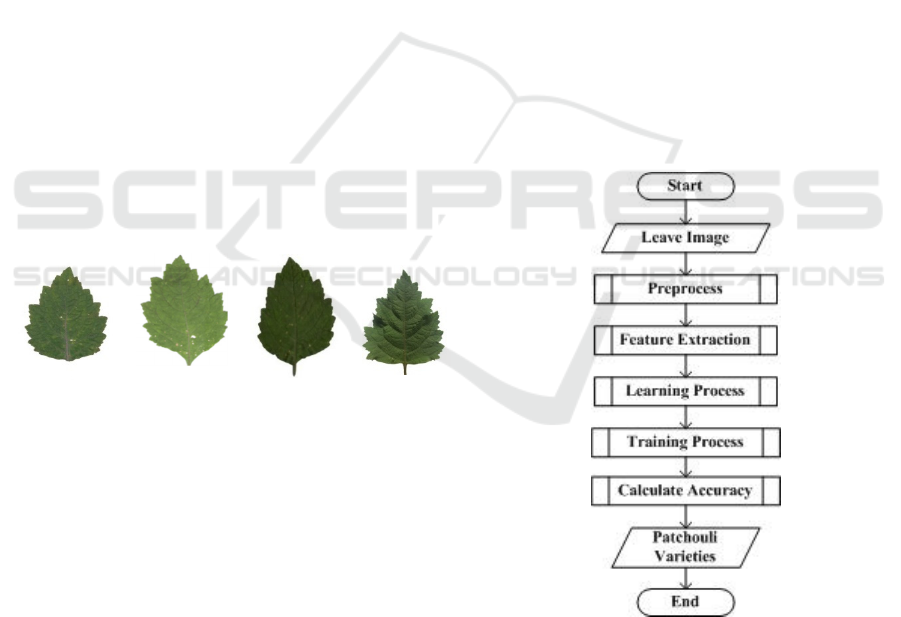
example of patchouli leaf image is shown in Figure 1.
(a) (b) (c) (d)
Figure 1: Example images of patchouli leaf: diploid (a),
patchoulina (b), sidikalang (c), tetraploid (d).
Leaf image is taken indoors using the iPhone 4S
camera with specifications of 8 MP, f / 2.4, 35mm,
autofocus, LED flash. Leaves to be taken are placed
on a white pedestal in an upright position a distance
of 20-25 cm from the camera.
2.3
General Step of Process
General flow for the recognition of patchouli varieties
is shown in Figure 2.
The input data in the form of patchouli leaf images
as training data and test data. Furthermore, the leaf
image is processed to improve the quality by resizing
the images and converting into the gray level color
model. The resize process is carried out on the image
to equalize the pixel size of the image, which is
400x500 pixels. After that the texture extraction
process is carried out from the gray level image using
the wavelet texture analysis method.
The extracted features are Energy1 (L1) and
Energi2 (L2) then used as input to the learning
process (training) and testing process (testing).
Before testing the system, the learning process is
carried out using training data to find out the best
parameters of the LVQ algorithm, so that the best
performance is obtained. This is indicated by the
convergence of training results on the parameter
values that are learned. At the learning stage the
training data sample is used in each class as the initial
weight of LVQ. The results of the study are the
optimal final weight which is then used as the LVQ
weight in the testing process. The last stage is the
testing process on the test data using the final weights
of the results of the learning process.
After that, the accuracy calculation stage is carried
out with the aim to find out the level of accuracy of
the LVQ on identification of patchouli leaves
varieties. The results of the testing process are the
identification of the varieties that exist in the test data
image and the level of accuracy of the LVQ method.
Figure 2: General steps of recognizing process.
2.3.1 Wavelet Feature Extraction
Wavelet texture analysis is done after the matrix is
transformed using wavelet transforms. In this study
wavelet daubechies are used for transformation. The
Daubechies wavelet family is written in dbN where N
ICEO 2019 - 2nd International Conference of Essential Oil Indonesia
24

is the order of wavelet with a filter length of 2N and
the number of vanishing moments and db is the short
name of wavelet (Gupta, 2015). Daubechies wavelet
transforms perform calculations using leveling
decomposition and subtraction through scalar
products with proportional signals. This wavelet type
has a balance of frequency response but has a form of
nonlinear response. Daubechies wavelet uses
overlapping windows, so the high frequency
coefficient of the spectrum represents all high
frequency changes. DbN handles problems at the
edge of the data when overlapping windows by
treating the data set as if the data were periodic. The
initial sequence of data repeats by following the end
of the sequence and the end of the data is taken for the
prefix (Ian, 2001).
The basic idea of Wavelet Texture Analysis is to
extract textural features from the detail coefficient of
wavelet (sub-band) or sub picture of each
magnification. The approximate value of the sub-
band coefficient is usually represented by lighting or
image illumination variations. Thus, the framework
of the majority of wavelet texture analysis features is
extracted from high sub-bands (HH) frequencies.
By using assumption that the energy distribution
in the frequency domain can recognize textures, the
computing of energy of the wavelet sub band will
result the texture features of the image. The
calculation of texture features obtained from the
normalization of first energy (L1) or second energy
(L2) can be done using equation 1 and equation 2.
∑∑
(1)
where is 1,,,
∑∑
/
(2)
where is 1,,,
L1 and L2 are the two energy values of the texture
projection in the subspace with Wavelet coefficient w
(i, j) at level l for sub band k, J refers to the maximum
decomposition level with horizontal wavelet
transform (h), vertical (v) and diagonal (d) on high
frequency sub band. M x N is a measure of the
coefficient of the matrix. Because the matrix is of the
same size, the value of M is equal to the value of N.
The extracted features are Energy1 (L1) and
Energi2 (L2) then used as input to the learning
process (training) and testing process (testing).
2.3.2 Leaning Vector Quantization
The Learning Vector Quantization (LVQ) is one of
the algorithms in Neural Network that perform
supervised learning against several competitive
layers. Automatically, the competitive layer learns to
group the given input vectors. Suppose there are N
data, with M input variables, and K class dividing the
data, then the steps from LVQ can be described as
follows:
1. Define:
a. Initial weights (W
kj
) from input variable j that
falls into class k, where k is class 1 to K and j
is variables 1 through M.
b. Maximum epoch (maxEpoch) or maximum
iteration.
c. Learning rate value (α).
d. Reduction value of learning rate (decα).
e. The minimum value of learning rate that is
tolerated(minα).
2. Enter:
a. Data input (X
ij
), where i is data 1 through N
and j is atribute 1 through M.
b. Class or target or expected output value (T
i
)
of each input data (X
ij
), where i is data
through N.
3. Set the initial conditions of epoch = 0.
a. Data input (neuron input): Xij, dimana i
adalah data 1 sampai N dan j adalah variabel
1 sampai M.
b. Kelas atau Target atau nilai ouput harapan
dari masing-masing data input (Xij): Ti,
dimana i adalah data 1 sampai N.
4. Repeat the following steps if epoch epoch <=
maksEpoch dan alfa >= minAlfa:
a. Epoch value plus 1
b. Repeat the following steps from i = 1 to N:
i. Determine the value of J
k
obtained
from the calculation of distance
between X
ij
and
W
kj
(Jk = || Xij-
Wkj||), where k is class 1 to K.
ii. Determine the output value (Ci),
which contains the class of initial
weights (W
kj
) which has the smallest
or minimum J (Ci = minimum J
k
).
iii. Update the initial weight (W
kj
) with
the following provisions:
If Ti =Ci, then
)(
kjijkjkj
WXalfaWW
(6)
If Ti <> Ci, then
)(
kjijkjkj
WXalfaWW
(7)
Hybrid of Wavelet Feature Extraction and LVQ Neural Network to Recognize Patchouli Variety using Leaf Images
25
c. Reduce the α value, by means of α = α - (α
* decα) or α = α -decα
After the training process, the final weights
(W
kj
) are obtained and the values are used to
perform the testing.
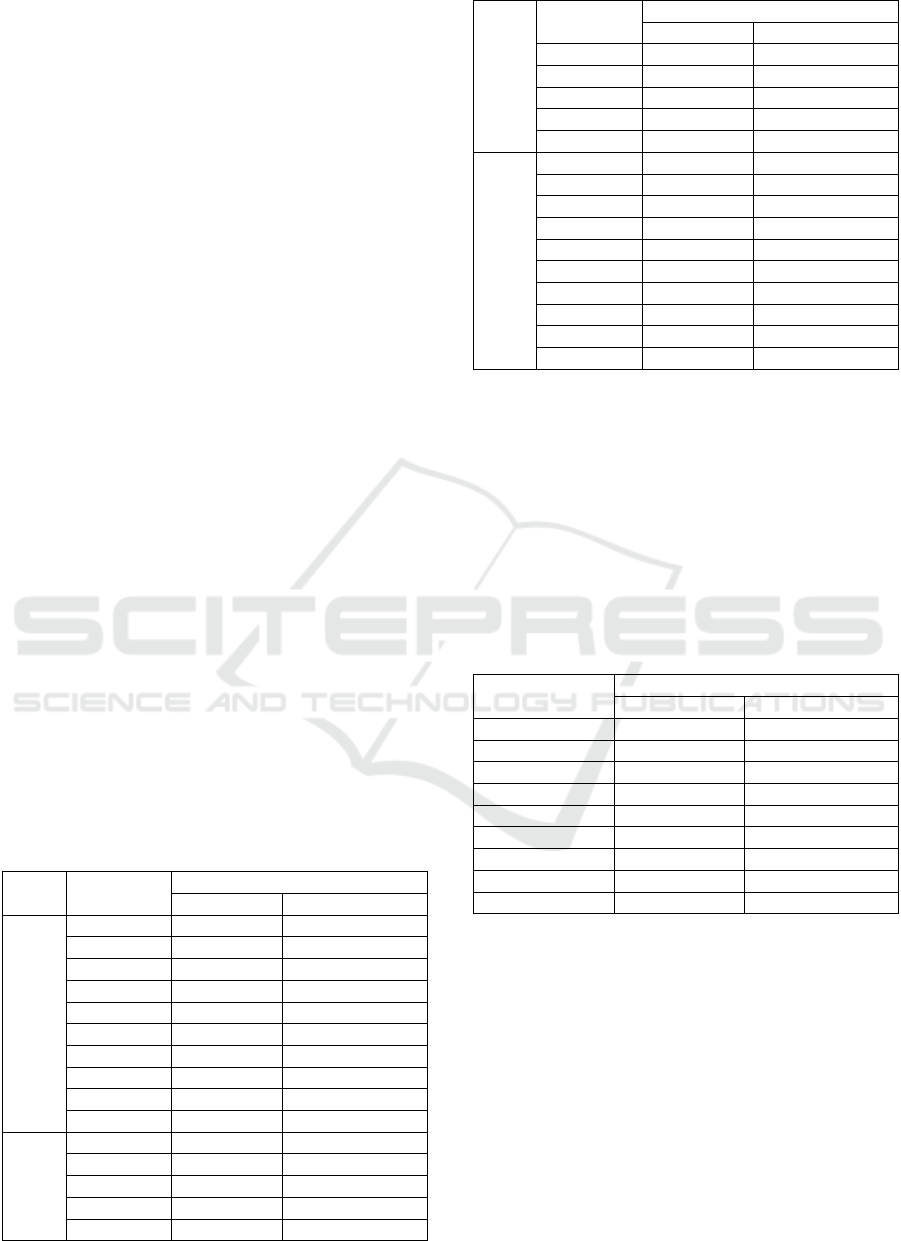
3 RESULT AND DISCUSSION
The training phase with training data is carried out to
get optimal parameters both for Wavelet parameters
and LVQ parameters. The Wavelet parameters tested
were doubechies coefficient (db coefficient) and
doubechies level (db level), while the LVQ
parameters tested were learning rate and learning rate
reduction. The results of testing these parameters are
shown in Table 1, Table 2 and Table 3. The training
processes was carried out with an LVQ iteration of
1000. Furthermore, the LVQ weight obtained in the
training process was used to conduct the test on the
training data and test data.
3.1 The Experiment of Doubechies Level
and Coefficient
The db coefficient and db level tests were performed
at a learning rate of 0.1 and a reduction in learning
rate of 0.1. The db level tested were 1, 2 and 3, while
the db coefficient tested ranged from 1 to 10.
The test results at Table 1 show the best db level
was 3 and the best db coefficient was 2, 3, 4 and 10.
Both training and test data produces the same
accuracy value of 83.33%.
Table 1: The result of db level and db coefficient test.
db
Level
db
Coefficient
Accuracy (%)
Train data Test data
1 1 70,8 58,3
2 75 66,7
3 75 66,7
4 75 66,7
5 79,2 66,7
6 79,2 66,7
7 75 66,7
8 75 66,7
9 70,8 66,7
10 75 66,7
2
1 79,2 75
2 83,3 66,7
3 83,3 66,7
4 83,3 66,7
5 79,2 75
db
Level
db
Coefficient
Accuracy (%)
Train data Test data
6 79,2 66,7
7 79,2 66,7
8 75 66,7
9 75 66,7
10 79,2 66,7
3 1 83,33 75
2 83,33 83,33
3 83,33 83,33
4 83,33 83,33
5 83,33 75
6 79,2 75
7 79,2 75
8 79,2 75
9 79,2 75
10 83,33 83,33
3.2 The Experiment of Learning Rate
The best parameter values of Wavelet obtained from
the test are then used as a reference in testing the LVQ
parameters. The learning rate test was performed at
db level 3, db coefficient 3 and the learning rate
reduction is 0.1. This test is carried out at learning rate
ranging from 0.1 to 0.9. The result of the learning rate
test is shown in Table 2.
Table 2: The result of learning rate test.
Learning
rate
Accuracy (%)
Train data Test data
0,1 83,33 83,33
0,2 83,33 75
0,3 83,33 75
0,4 83,33 75
0,5 83,33 75
0,6 83,33 75
0,7 87,5 75
0,8 45,8 41,7
0,9 41,7 33,3
The test results show the best accuracy for training
data is 87.5% at learning rate 0.7 and for testing data
was 83.33% for testing data at leaning rate 0.1.
However, the most optimal accuracy for both training
data and test data that was equal to 83.33% at leaning
rate 0.1.
3.2 The Experiment of Learning Rate
Reduction
The learning rate reduction test uses level db 3,
coefficient db 3 and the learning rate value 0.1. The
result of the learning reduction test is shown in Table
3. The test results show that the best learning rate
ICEO 2019 - 2nd International Conference of Essential Oil Indonesia
26

reduction is 0.2, and 0.4 with an accuracy value of test
data is 83.33% (Table 3).
Table 3: The result of learning rate reduction test.
Learning rate
reduction
Accuracy (%)
Train data Test data
0,1 83,33 83,33
0,2 87,5 83,33
0,3 87,5 75
0,4 87,5 83,33
0,5 83,33 83,33
0,6 79,2 83,33
0,7 75 83,3
0,8 75 83,3
0,9 70,8 83,3
4 CONCLUSIONS
This study carried out the identification of patchouli
plant varieties using the image of patchouli leaves.
This process combines the ability of the wavelet
method to extract texture features and LVQ for the
classification of patchouli varieties. The process of
identifying patchouli varieties begins with the
training to get the optimum wavelet parameters (db
level and db coefficient) and LVQ parameters
(constant of learning rate and learning rate reduction)
to find out the optimal method performance. Test
results at db level 3, db coefficient 2, 3 and 4, learning
rate 0.1 and the reduction of leaning rates 0.2 and 0.4
obtained the highest accuracy is 83.33%. The results
obtained are quite good, but further research needs to
be done especially by increasing the amount of data
and adding patchouli varieties.
ACKNOWLEDGEMENTS
We would like to thank to Faculty of Computer
Science, University of Brawijaya for the funding of
this research.
REFERENCES
Aakif, A., Faisal Khan, M., 2015. Automatic Classification
of Plants Based on Their Leaves. Biosystems
Engineering. 139, 66–75.
Abdolmaleki, M., Tabaei, M., Fathianpour, N., Gorte, B.
G.H., 2017. Selecting Optimum Base Wavelet For
Extracting Spectral Alteration Features Associated
With Porphyry Copper Mineralization Using
Hyperspectral Image. International Journal of Applied
Earth Observation and Geoinformation, 58, 134-144.
Bakhshipour, B., Jafari, A., Nassiri, S. M., Zare, D., 2017.
Weed Segmentation using Texture Features Extracted
from Wavelet Sub-Images. Biosystems Engineering,
157, 1-12.
Zhao, C., Chan, S.S.F., Cham, W.K., Chu, L.M., 2015.
Plant Identification using Leaf Shapes—A Pattern
Counting Approach. Pattern Recognition. 48, 10,
3203–3215
Dewi, C, Krisnanti, G.W., Cholissodin, I., Basuki, A., 2016.
Identifying Quality of Patchouli Leaves through Its
Leave Image Using Learning Vector Quantization. The
6
th
Annual Basic Science International Conference,
March 2016, Malang, Indonesia.
Dewi, C., Umam, M. S., Cholissodin, I., 2016.
Identification of Disease on Leaf Soybean Image Using
Learning Vector Quantization. International Congress
on Engineering and Information, May 2016, Osaka,
Japan.
Imtiaz, H., Fattah, S. A., 2013. A Wavelet -Based
Dominant Feature Extraction Algorithm for Palm-Print
Recognition. Digital Signal Processing, 23(1), 244-
258.
Jamil, N., Aslina, N., Hussin, C., Awang, K., 2015.
Automatic Plant Identification: Is Shape the Key
Feature?. Procedia Computer Science, 76, 2015, 436-
442.
Lakshmi, B.V., Mohan, F., 2016. Kernel-Based PSO and
FRVM: An Automatic Plant Leaf Type Detection using
Texture, Shape, and Color Features. Computers and
Electronics in Agriculture, 125, 99–112.
Liu, N., Kan, J-M., 2016. Improved Deep Belief Networks
and Multi-Feature Fusion for Leaf Identification.
Neurocomputing, 216, 460–467.
Laga, H., Kurtek, S., Srivastava, A., Miklavcic, S.J., 2014.
Landmark-Free Statistical Analysis of the Shape of
Plant Leaves. Journal of Theoretical Biology, 363, 41–
52.
Murguía, J.S., Vergara, A., Vargas-Olmos, C., Wong, T. J.,
Fonollosa, J., Huerta, R., 2013. Two-dimensional
Wavelet Transform Feature Extraction for Porous
Silicon Chemical Sensors. Analytica Chimica
Acta, 785, 1-15.
Neto, J. C., Meyer, G.E., Jones, D.D., Samal, A.K., 2006.
Plant Species Identification using Elliptic Fourier Leaf
Shape Analysis. Computers and Electronics in
Agriculture. 50(2), 121–134.
Pahikkala, T., Kari, K., Mattila, H., Lepisto,
A., Teuhola, J., Nevalainen, O.S., Tyystjärvi, E., 2015.
Classification of Plant Species from Images of
Overlapping Leaves. Computers and Electronics in
Agriculture, 118, 186–192.
Singh, A., Dutta, M. K., Sarathi, M.P., Uher, V., Burget, R.,
2016. Image processing Based Automatic Diagnosis of
Glaucoma using Wavelet Features of Segmented Optic
Disc from Fundus Image. Computer Methods and
Programs in Biomedicine, 124, 108-120.
Zhang, L., Weckler, P., Wang, N., Xiao, D., Chai, X.,
2016. Individual Leaf Identification from Horticultural
Hybrid of Wavelet Feature Extraction and LVQ Neural Network to Recognize Patchouli Variety using Leaf Images
27

Crop Images Based on the Leaf Skeleton. Computers
and Electronics in Agriculture, 127, 184–196.
Zhao, Z.-Q., Ma, L.H., Cheung, Y.M, Wu, X., Tang, Y.,
Chen, C.L.P., 2015. ApLeaf: An Efficient Android-
Based Plant Leaf Identification System.
Neurocomputing, 151(3), 1112–1119.
Haryudin, W., Suhesti, S., 2014. Karakteristik Morfologi,
Produksi dan Mutu 15 Aksesi Nilam (Morphological
characteristics, production and quality of 15 patchouli
accessions). Bul. Littro, 25(1).
ICEO 2019 - 2nd International Conference of Essential Oil Indonesia
28
