
UX in Platform Use Behavior based on Perceived Ease of Use and
Perceived Usefulness in Mutual Fund Investment Behavioral Intention
Dina Fitria Murad
1
, Nora Fitriawati
1
, Imanuel Revelino Murmanto
1
, Dwi Rahmania Noviani
1
and
Sudido
1
1
Information Systems Department, BINUS Online Learning, Bina Nusantara University, Jakarta, Indonesia
Keywords:
perceived ease of use, perceived usefulness, user experience (UX), user interface (UI), technology acceptance
model (TAM)
Abstract:
Moduit is present as one of the mutual fund investment platforms, which also animates the online investment
platform. However, the number of customers who make transactions in Moduit is only 4236% of customers
who have completed their registration, and this indicates a mistake in the system’s acceptance of the user. This
study aims to determine the factors that influence the approval of the Moduit platform. This study developed an
expanded model based on the technology acceptance model (TAM). This model was tested by an online survey
sample using SPSS. To achieve this study’s goal, we propose UI models and designs on Moduit. The results
show that the user’s intention to use Moduit is influenced primarily by perceived ease of use and perceived
usefulness. Perceived ease of use also affects indirectly through perceived usefulness to behavioral intentions.
1 INTRODUCTION
Fintech is a commercial industry composed of com-
panies that use new technology to provide more ef-
ficient financial services. Financial technology inte-
grates various types of financial services into the day
to day lives of customers (Moon and Kim, 2016)(Fer-
nando et al., 2018). Millennials, as well as the gener-
ation coming up behind the ages coming up behind
them, are used to technology and want to manage
their money easily and quickly, instead of walking to
physically branches to perform transactions and other
operations (Kim et al., 2015) . It uses mobile-centered
information technology to raise the efficiency of the
financial system (Surendran, 2012).
Among the new Fintech services, Moduit presents
a new investment platform for mutual fund and
change every process of mutual fund investment from
traditional to be digital to help users invest as easy as
online shopping. However, Moduit is a relatively new
player of the Mutual Fund Investment Platform, and
its market is still growing and unstable. Because in
January 2019, Moduit only has 42% of 36% verified
users that already do the transaction.
The goal of this research is to find and understand-
ing of the factors that influence Moduit user experi-
ence acceptance. To achieve the purpose of this re-
search, this research aims to propose a model and UI
design of Moduit by developing an extended model
based on the TAM (technology acceptance model).
Thereby the research proposes that:
H1. Perceived ease of use will have a positive in-
fluence on behavioral intentions to use Moduit.
H2. Perceived usefulness will have a positive in-
fluence on behavioral intentions to use Moduit.
H3. Perceived ease of use will have a positive in-
fluence to perceived usefulness.
2 LITERATURE REVIEW
Technology Acceptance Model has been developed
by Davis (1989) is one of the most popular research
models to predict the use and acceptance of infor-
mation systems and technology by individual users.
TAM has been widely studied and verified by differ-
ent studies that examine individual technology accep-
tance behavior in various information systems con-
structs.
In the TAM model, there are two factors perceived
usefulness, and perceived ease of use is relevant in
computer use behaviors. Davis defines perceived use-
fulness as the prospective user’s subjective probabil-
ity that using a specific application system will en-
hance his or her job or live performance. Perceived
Murad, D., Fitriawati, N., Murmanto, I., Noviani, D. and Sudido, .
UX in Platform Use Behavior based on Perceived Ease of Use and Perceived Usefulness in Mutual Fund Investment Behavioral Intention.
DOI: 10.5220/0009909402990304
In Proceedings of the International Conferences on Information System and Technology (CONRIST 2019), pages 299-304
ISBN: 978-989-758-453-4
Copyright
c
2020 by SCITEPRESS – Science and Technology Publications, Lda. All rights reserved
299
ease of use (PEOU) can be defined as the degree to
which the prospective user expects the target system
to be free of effort. The development of TAM dis-
cusses how to create a foundation that can predict and
explains events that drive technological development
(Nguyen and Huynh, 2018). And approval of accep-
tance and publication of integration technology in or-
ganizational concepts (Juliandi et al., 2018).
The more difficult a technology is to use, the lower
the interest of individuals to use it, and the slower in-
dividuals and community groups will adopt it. Mod-
eling Venkatesh and Alomary firmly state that PU
influences BI. The existence of PU directly affects
the behavioral intention to use. Furthermore, from
the results of Ducey’s research, it is known that the
user’s intention to adopt new technology is more de-
termined by one’s attitude, such as perceived ease of
use and perceived usefulness (Nguyen and Huynh,
2018)(Chuang et al., 2016).
3 RESULT AND DISCUSSION
In this study, primary data have been collected from
the actual Moduit users. These respondents belong
to a Moduit verified and prospect client, and the
questionnaires are obtained from an online survey
site, and 97 respondents complete the survey. Likert
five-point scale ranging from “strongly disagree” and
“strongly agree” were used, and all questions were
measured through self-reporting. The demographic
details of the respondents are as follows 51% are
prospect clients means they have not completed the
registration and 49% are verified client means they
already complete the record but have not tried trans-
action. Measurement items used in the study are de-
veloped based on a series of experimental stages. In
the first step, every detail in the model is borrowed
from the related studies to get initial face validity.
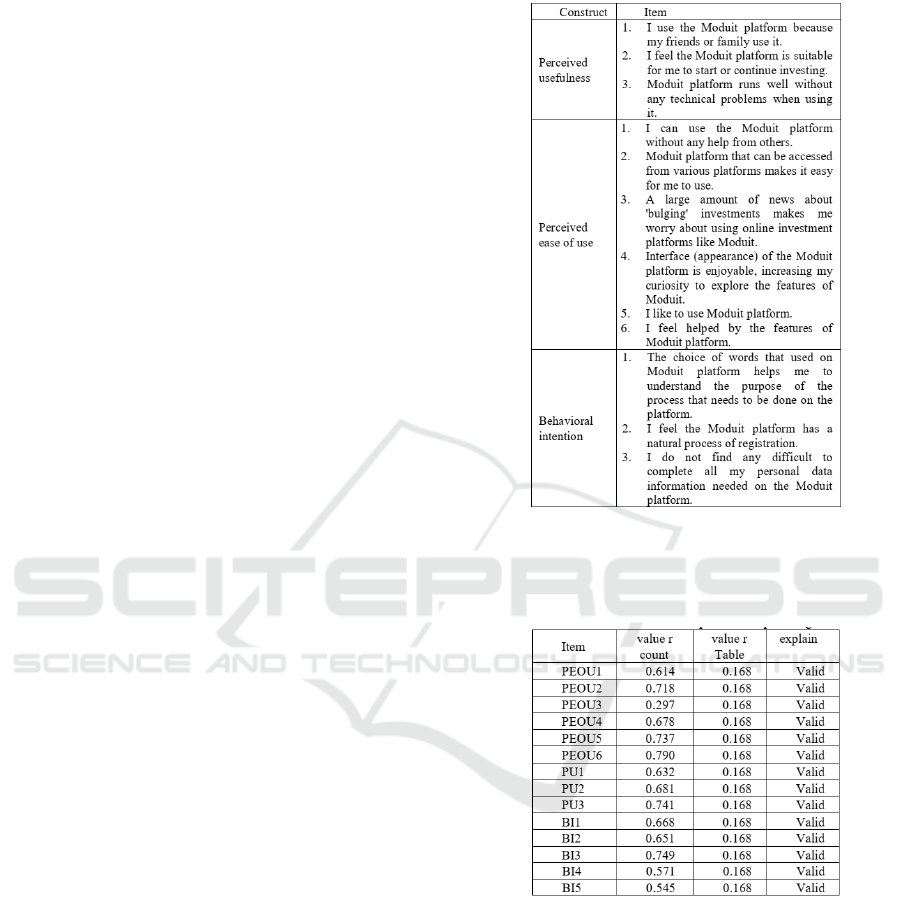
And, all constructs used in this study (Figure 1)
adopt the Venkatesh & Bala theory.
space
Figure 1: construct and item that we used.
In the second step, it is required to test the validity,
reliability, and correlation of the constructs to perform
the path diagram (Figure 2).
Figure 2: The constructs to perform the path diagram.
All variable and sub variable are valid, based on
the observation of the total score of each sub variable
are higher than r table value; which is 0.168 (Bryman
and Cramer, 2005).
CONRIST 2019 - International Conferences on Information System and Technology
300
space
Figure 3: Validity test.
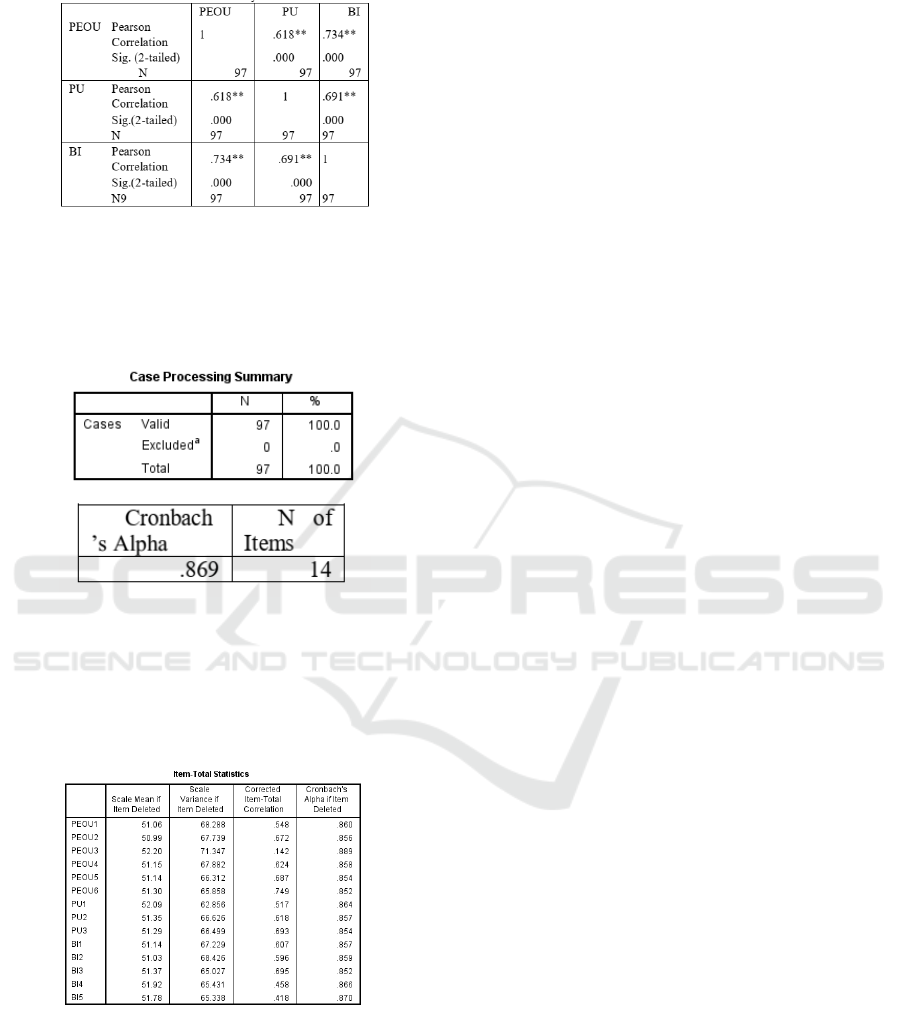
The third step carried out reliability testing. The
reliability of measures is tested by calculating Cron-
bach’s alpha. These scores are found to be satisfac-
tory enough.
Figure 4: Reliability test.
There are 14 items with a Cronbach Alpha value
of 0.869 greater than a minimum Cronbach alpha 0.6,
and it can be concluded that the research instrument
used to measure service variables can be said to be
reliable or reliable.
Figure 5: item-Total Statistic.
The following table provides an overview of the
statistical values for the 14 item questionnaire state-
ments. Cronbach’s Alpha value if they are Deleted
known¿ 0.6, it can be concluded that the 14 items of
this questionnaire statement are reliable.
In the fourth step, a correlation test is performed.
Correlation analysis is a study of the discussion of the
degree of closeness of the relationship between vari-
ables expressed by the correlation coefficient. The re-
lationship between these variables can be both posi-
tive and negative. In correlation analysis, there are no
terms independent variable (X) and dependent vari-
able (Y). Because the relationship between the inde-
pendent variable with the dependent variable will be
the same meaning as the relationship between the de-
pendent variable and the independent variable.
Based on the output table above, conclusions can
be drawn by referring to the three basic decision mak-
ing in Pearson’s bivariate correlation analysis above:
1. Variable PEOU (Perceived Ease of Use) is sig-
nificantly correlated with variable BI (Behavioral
Intention), based on the observation that Pearson
correlation score, which is 0.734, is more signifi-
cant than r table value; which is 0.168. As an al-
ternative observation: Sig. (2- tailed) the correla-
tion score value of variable PEOU over BI, which
is 0.000, is less than 0.05 as an alpha value.
2. Variable PU (Perceived Usefulness) is signifi-
cantly correlated with variable BI (Behavioral In-
tention), based on the observation that Pearson
correlation score, which is 0.691, is more signif-
icant than r table value; which is 0.168. As an
alternative observation: Sig. (2- tailed) the corre-
lation score value of variable PU over IU, which
is 0.000, is less than 0.05 as an alpha value.
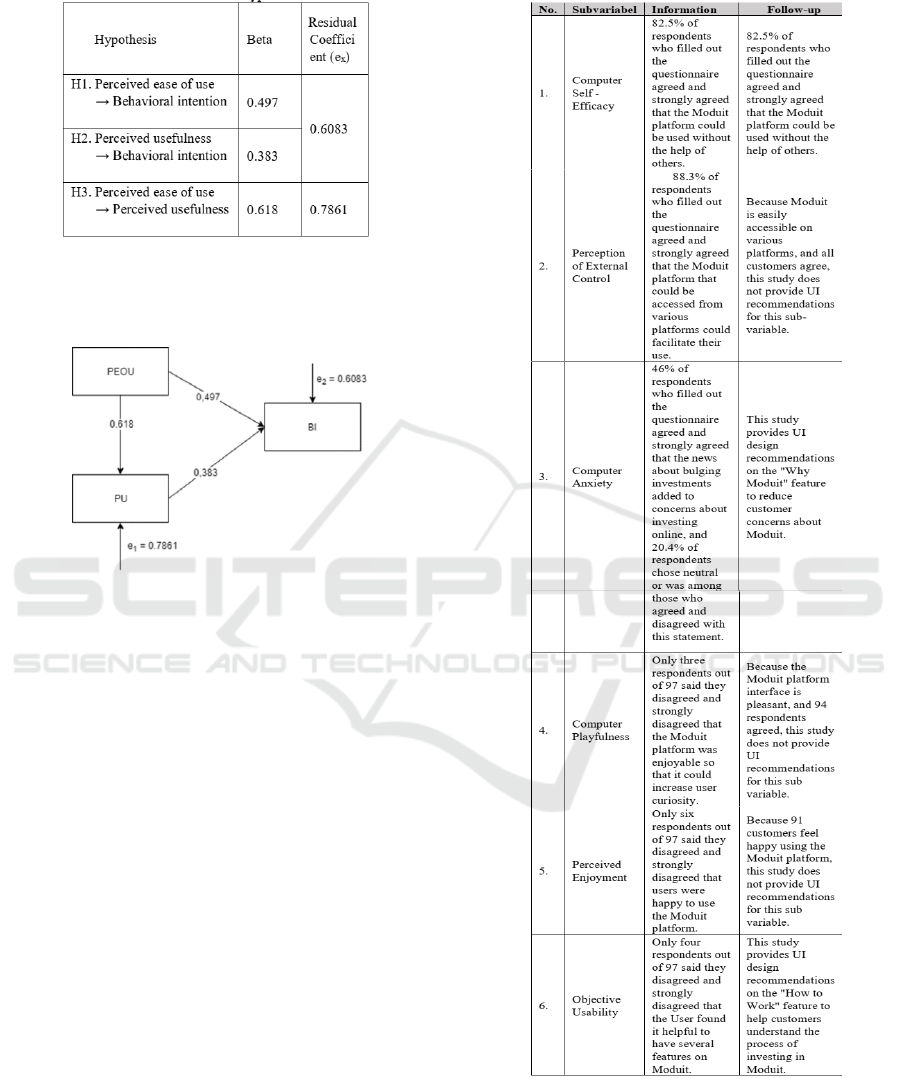
3. To test the hypothesized relationships between
constructs, the path diagram model is used. Path
analysis aims to provide quantitative estimates of
the causal connections between sets of variables.
The connections process in one direction and are
viewed as making up distinct paths. These ideas
can best be explained concerning the central fea-
ture of a path analysis - the path diagram. The
path diagram makes explicit the possible causal
connections between variables 0. According to
the model summary test results, an examination of
R2 value (perceived usefulness=0.382, behavioral
intention=0.630) demonstrates that the proposed
model shows a substantial amount of the variance.
According to the test result, every hypothesis ex-
cept H3 is accepted. Perceived usefulness and
perceived usefulness give influence to behavioral
intention directly. However, the indirect relation-
ship between perceived ease of use and behavioral
intention is not supported.
UX in Platform Use Behavior based on Perceived Ease of Use and Perceived Usefulness in Mutual Fund Investment Behavioral Intention
301
space
Figure 6: Result of hypothesis.
Figure 6results are then used to produce the path
diagram as shown in Figure 7
Figure 7: Path Diagram Model
Based on the results of the hypothesis test and the
results of the correlation test (table 7), the variable
Perceived Ease of Use (PEOU) most influences
user intentions. So, this study provides several UI
design recommendations that emphasize increasing
Perceived Ease of Use (PEOU) which is expected
to increase user interest in accessing the Moduit
platform.
space
Figure 8: Previous Research.
According to the test result, perceived ease of use
is the most correlated variable with behavioral inten-
tion. This study will recommend a new UI design for
Moduit platform based on the outcome.
CONRIST 2019 - International Conferences on Information System and Technology
302
space
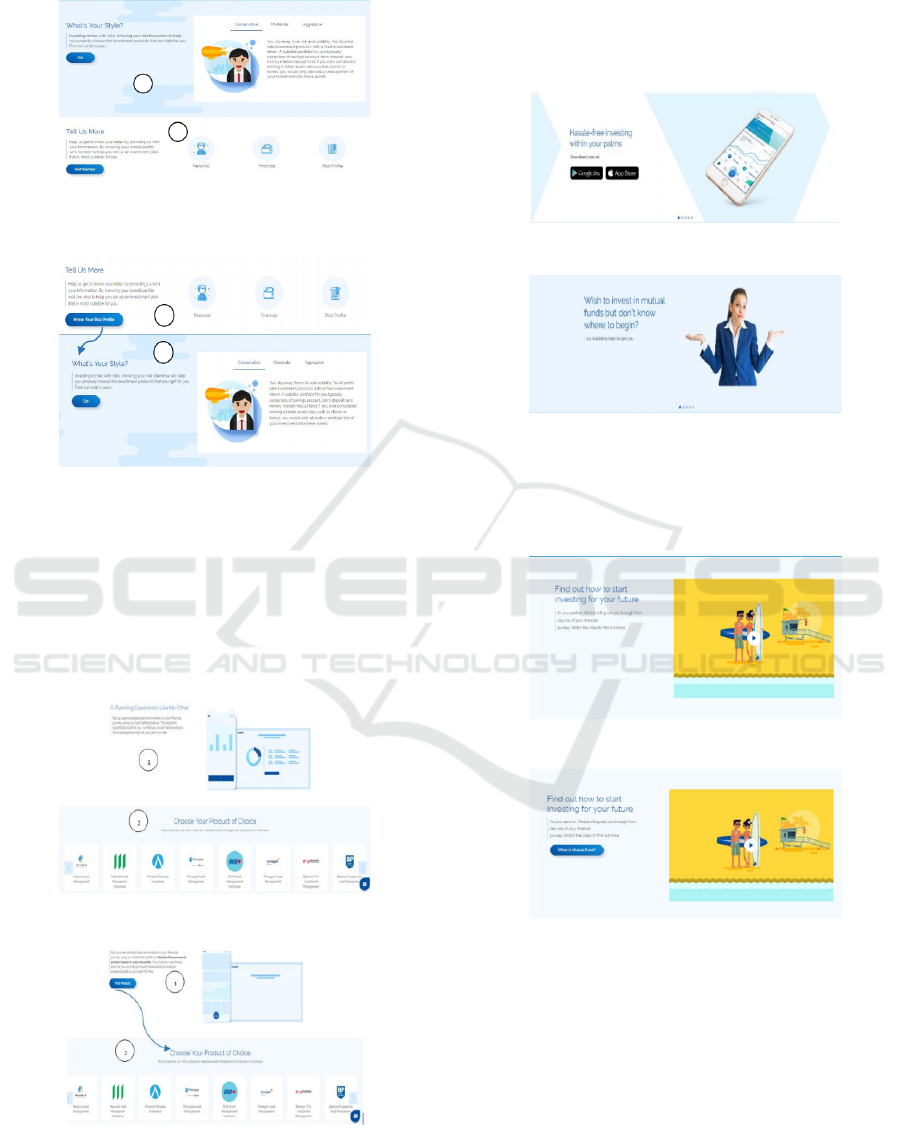
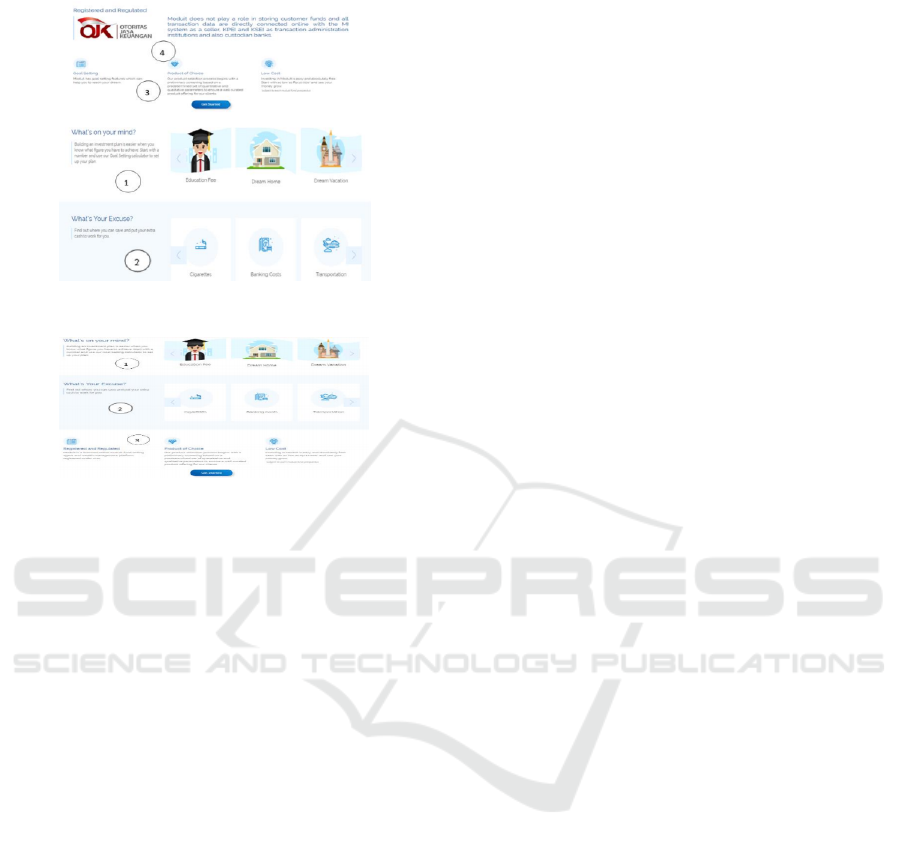
Figure 9: ”How it Works” Page – Before (source:
https://www.moduit.id/id/how-it-works/)
Figure 10: ”How it Works” Page – After
According to the picture, the structure of this page
is a little bit change by switch section 1 to be sec-
tion 2 and section 2 to be section 1. This change
aims to restructure based on the actual process, which
users have to register first as a prospect client, then
they able to know what is their risk profile type, make
users quickly understand how the process to invest in
Moduit.
Figure 11: ”How it Works” Page – Before (2)
Figure 12: ”How it Works” Page – After (2)
After changing the structure of the “How it
Works” page, the next section of this page modified
by adding a sentence too describes clearly about goal
setting features will help Moduit to help users find the
product which matches with user’s risk profile. The
new button will bring into the next section to see all
of Moduit’s products.
Figure 13: ”Home” Page – Before
Figure 14: ”Home” Page - After
The first image slider of “Home” Page is changed
because the new picture is more describing Moduit
services. It will make users quickly understand what
is Moduit when they open the Moduit website.
Figure 15: ”Home” Page – Before (2)
Figure 16: ”Home” Page – After (2)
The second part of “Home Page,” which changed,
is a new button beside the video. To help users to
know more about mutual fund investment, they can
click that button, and it will bring them to Moduit
“Level Up” Page, which has much information re-
garding Mutual Fund Investment.
UX in Platform Use Behavior based on Perceived Ease of Use and Perceived Usefulness in Mutual Fund Investment Behavioral Intention
303
space
Figure 17: ”Why Moduit” Page – Before (2)
Figure 18: ”Why Moduit” Page – After (2)
Before Section 1, the new section is added to ex-
plain more about why invest in Moduit is save? It
will help the user to understand and increase their be-
liever to Moduit. Chapter 1 and Section to is switch,
it aims to help user understand first about good things
of Moduit.
4 CONCLUSIONS
This paper makes a contribution to the Fintech litera-
ture by providing an understanding of the factors that
affect Moduit acceptance. Considering the relatively
recent development of Moduit and the lack of rele-
vant studies, this study offers value as an early study.
The result hint that perceived ease of use and recog-
nized usefulness factor is a critical factor influencing
the Moduit acceptance. This research finds that per-
ceived ease of use factor’s indirect influence on inten-
tion is not significant but only affects directly. Ac-
cording to the result, this research also gives some UI
design recommendations to Moduit. However, this
research has some improvements in the future. First,
the researcher can add trust factors. Second, the re-
searcher can retest new design of system maintenance
that Moduit has done in the future.
REFERENCES
Bryman, A. and Cramer, D. (2005). Quantitative data anal-
ysis with SPSS 12 and 13: A guide for social scientists.
Psychology Press.
Chuang, L.-M., Liu, C.-C., and Kao, H.-K. (2016). The
adoption of fintech service: Tam perspective. Inter-
national Journal of Management and Administrative
Sciences, 3(7):1–15.
Fernando, E., Condrobimo, A. R., Murad, D. F., Tirtamulia,
L. M., Savina, G., Listyo, P., et al. (2018). User be-
havior adopt utilizing fin tech services on online trans-
portation in indonesia (scale validation and developed
instrument). In 2018 International Conference on In-
formation Management and Technology (ICIMTech),
pages 114–118. IEEE.
Juliandi, A., Manurung, S., Satriawan, B., et al. (2018).
Mengolah Data Penelitian Bisnis Dengan SPSS. Lem-
baga Penelitian dan Penulisan Ilmiah AQLI.
Kim, Y., Park, Y.-J., Choi, J., and Yeon, J. (2015). An em-
pirical study on the adoption of “fintech” service: Fo-
cused on mobile payment services. Advanced Science
and Technology Letters, 114(26):136–140.
Moon, W. Y. and Kim, S. D. (2016). A payment mediation
platform for heterogeneous fintech schemes. In 2016
IEEE Advanced Information Management, Communi-
cates, Electronic and Automation Control Conference
(IMCEC), pages 511–516. IEEE.
Nguyen, T. D. and Huynh, P. A. (2018). The roles of per-
ceived risk and trust on e–payment adoption. In Inter-
national Econometric Conference of Vietnam, pages
926–940. Springer.
Surendran, P. (2012). Technology acceptance model: A sur-
vey of literature. International Journal of Business
and Social Research (IJBSR), 2(4):175–178.
CONRIST 2019 - International Conferences on Information System and Technology
304
