
Neural Network with Principal Component Analysis for Malware
Detection using Network Traffic Features
Ventje Jeremias Lewi Engel
1
, Mychael Maoeretz Engel
2
and Evan Joshua
3
1
Department of Computer Engineering, Institut Teknologi Harapan Bangsa, Dipatiukur Street, Bandung, Indonesia
2
Department of Informatics, Universitas Ciputra, Citraland CBD Boulevard, Surabaya, Indonesia
3
Department of Informatics, Institut Teknologi Harapan Bangsa, Dipatiukur Street, Bandung, Indonesia
Keywords:
Malware Detection, Neural Network, Network Traffic Features, Principal Component Analysis, Features Set
Abstract:
Network traffic acts as a medium for sending information used by hackers to communicate with malware on
the victim’s device. Malware analyzed in this study will be divided into three classes, namely adware, general
malware, and benign. Malware classification will use 79 features extracted from network traffic flow, and
analysis of these features will use Neural Network and Principal Component Analysis (PCA). The total flow
of network traffic used is 442,240 data. The evaluation of malware detection is based on Fmeasure rather
than traditional accuracy metric. The literature features set (15 features) produces an Fmeasure of 0.6404,
the researcher features set (12 features) produces an F-measure of 0.6660, and the PCA features (23 features)
produces an F-measure of 0.7389. This result concludes that PCA can generate features that have better
results for malware detection with Neural Network algorithm. Aside from the PCA result, it is shown that
more features used does not mean that the accuracy of malware detection will also increase. The drawback
of using PCA is the loss of interpretability. Further research is needed on the analysis of the combination of
network traffic features besides using PCA.
1 INTRODUCTION
With the increasing adoption of information technol-
ogy, the use of IoT (Internet of Things) devices and
smartphones is growing. Security threats on IoT de-
vices and smartphones also increased. Cyberattacks,
such as taking access rights, data destruction, and the
theft of important personal information, can be car-
ried out on IoT devices and smartphones (Kaspersky,
2015). This cyber-attack is mostly entered through
malicious software or malware that was successfully
planted on IoT devices and smartphones.
Malware is an application that has a harmful pur-
pose, such as corrupting data, stealing valuable in-
formation, disrupting device performance, and tak-
ing over the system (Kaspersky, 2015). This threat
continues to increase every year, even in 2017 found
around 3.5 million new malware only on Android
smartphone devices (Lueg, 2017). One of the sus-
picious activities or suspicious activity of malware is
the use of network traffic or network traffic. The use
of network traffic can be a medium for sending con-
fidential information in the form of PINs, bank ac-
count information, personal messages, and passwords
to the perpetrators of the malware maker (Zhou and
Jiang, 2012). Malware can also use network traffic as
a backdoor for other malware to enter.
Network traffic on IoT devices and smartphones
has the same basis as network traffic in general, which
contains packets that have a header and data section
(Forouzan, 2010). Data is obtained and processed at
the application layer, while headers are added at each
layer. Each data and header has a size that varies
with the specified limits. The data included in the
packet contains what you want to send from source
to destination. The header consists of the destination
IP address, sender’s IP address, source port, destina-
tion port, and so on. Most network traffic features are
time-series data. In general, malware detection clas-
sifies applications into adware, general malware, and
benign (Lashkari et al., 2017). Adware force displays
advertisements on top of the running software. Ad-
ware aims to increase revenue for software developers
so that the advertised company will pay. Every kind of
general malware can be sure to have bad goals, such
as corrupting or stealing data. Benign is a regular type
of application that does not have dangerous goals and
runs according to what the application developer has
266
Engel, V., Engel, M. and Joshua, E.
Neural Network with Principal Component Analysis for Malware Detection using Network Traffic Features.
DOI: 10.5220/0009908902660271
In Proceedings of the International Conferences on Information System and Technology (CONRIST 2019), pages 266-271
ISBN: 978-989-758-453-4
Copyright
c
2020 by SCITEPRESS – Science and Technology Publications, Lda. All rights reserved

written in the documentation section.
Efforts to detect mobile malware have been car-
ried out with various approaches. A behaviorbased
method that uses permissions and system calls as fea-
tures produced accuracy that is still relatively low,
with an average of 60% (Kaushik and Jain, 2015).
The result was 65.29% using Simple Logistic Regres-
sion, 65.29% using Naive Bayes, 70.31% using SMO,
and 54.79% using Random Tree (Kaushik and Jain,
2015). Other research using the Neural Network (NN)
method with network traffic features to detect mal-
ware on smartphones had successfully identified mal-
ware botnets with a precision level of around 88.3%
(Stevanovic and Pedersen, 2015). This result is much
higher compared to the naive Bayes and logistic re-
gression methods, each of which has a value of 7%
and 32% (Stevanovic and Pedersen, 2015). Besides,
the neural network method successfully outperformed
the Support Vector Machine (SVM) method in clas-
sifying network traffic (Zhang et al., 2012). Detect-
ing malware through network traffic analysis which
is time-series data is suitable for the neural network
method.
The weakness of that research was the NN is per-
formed on all network traffic features. Some network
features have significantly more roles than other net-
work traffic features. For example, the network des-
tination port is more important than the length of the
header contents. Second, using all network traffic fea-
tures means increasing the internal errors carried in
the data. Third, features with large values will auto-
matically weigh higher; for example, the port num-
ber commonly used will be much smaller when com-
pared to the amount of data flow across the network
(Lashkari et al., 2017). On the other hand, there is
a Principal Component Analysis (PCA) method for
feature extraction. Research showed that in network
traffic classification, PCA had faster speed, higher ac-
curacy, and more stable than the Naive Bayes estima-
tion method (Yan and Liu, 2014).
The differences between this study and previous
research are the network traffic dataset, the combina-
tion of features, and the NN configuration iteration
used. The dataset was from the Canadian Institute
for Cybersecurity, University of New Brunswick (for
Cybersecurity, 2017) combined with sample data col-
lected in Harapan Bangsa computer laboratory. The
set of features will be carried out based on PCA com-
pared with features obtained from literature studies
and features chosen by researchers. The iteration of
the NN configuration is done by programming that
pays attention to learning rate, epoch, and parameter
evaluation. The purpose of this study is to investigate
the combination of network traffic features that can
produce high precision, recall, and F-measure.
2 METHOD
2.1 Research Framework
This part outlines the framework of thought, namely
indicators, proposed methods, objectives, and mea-
surements. The indicator explains the factors that af-
fect the results of the objective. The number of pack-
ets of datasets analyzed is the first factor. Secondly,
the number of features and features names will be
used in the training and testing process. Third, neural
network hyperparameters include the number of hid-
den neurons, the epochs, and learning rate. Then in
the proposed method, there is a dataset source. Then
enter the feature selection stage. The feature will then
be selected by analyzing it first. Then, after obtain-
ing features from the results of the previous analysis,
training will be conducted using the neural network
method and continued with the testing phase. The test
results processed to produce the objectives in the form
of precision, recall, and Fmeasure.
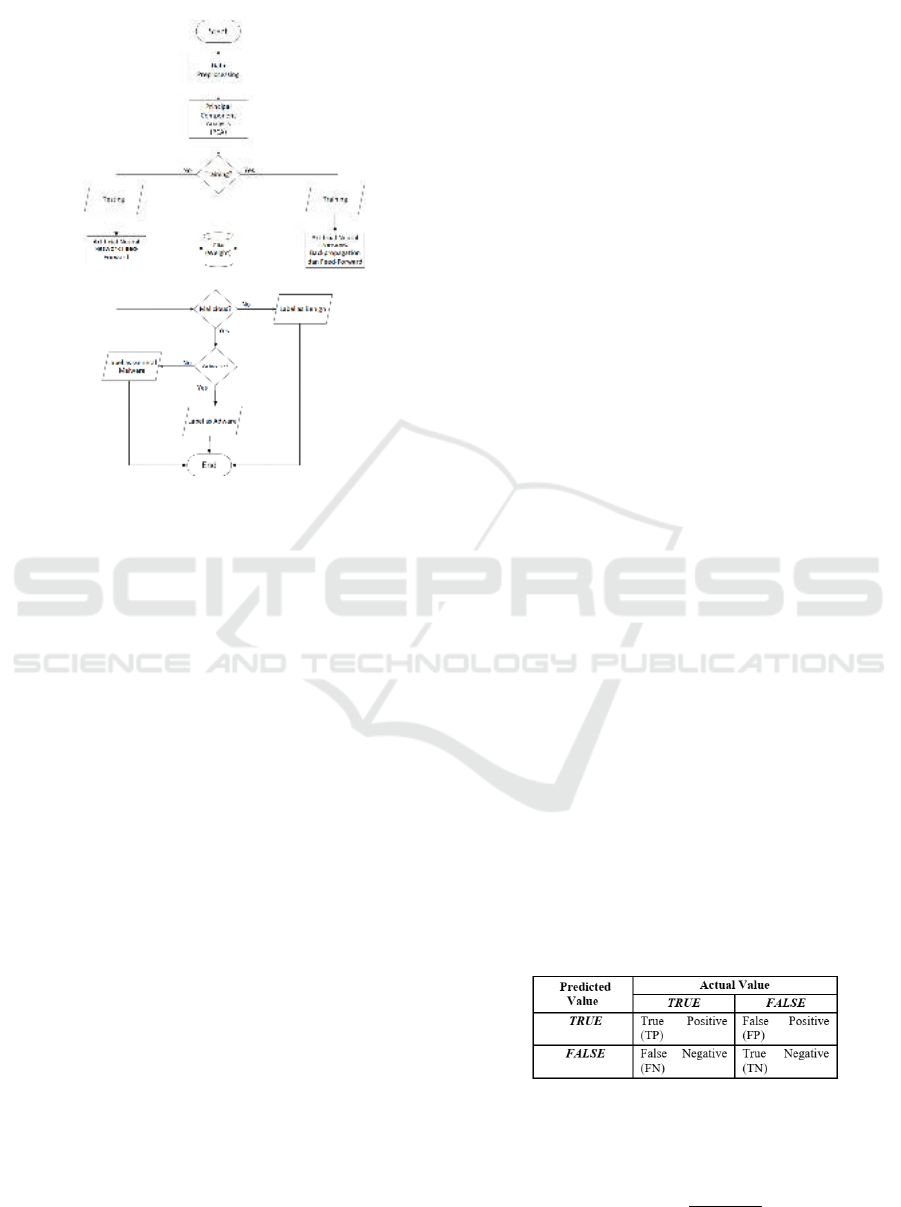
2.2 Flowchart
The steps of this research were arranged in the form
of a flowchart that begins with preprocessing. Prepro-
cessing is the normalization of the features by divid-
ing it by the maximum value of each feature, minimiz-
ing features so as not to dominate other features. Then
the learning stage used the neural network method
with backpropagation algorithm, and the testing stage
used feed-forward. In the initial phase, the weight
will be random according to the previous provisions
and stored in a weight file. Learning outcomes would
give a new weight value used in the test phase. The
test output was divided into three, namely benign type
network traffic, adware, or general malware. The
flowchart can be seen at Figure 1.
Neural Network with Principal Component Analysis for Malware Detection using Network Traffic Features
267
space
Figure 1: Research flowchart.
2.3 Neural Network Architecture
Neural network is one of machine learning tech-
niques. Neural networks is a supervised learning with
the resulting model in the form of weight (Rashid,
2016). There are three main layers in the neural net-
work, namely the input layer, hidden layer and output
layer.
In this research, three layers will be used, namely
the input layer, hidden layer, and output layer. The
input layer has several neurons according to the num-
ber of features used. In the hidden layer, only one
layer will be used with the number of neurons tested,
namely 4, 5, 6, and 12. The output layer will pro-
duce output in the form of 3 classes, namely benign,
adware, and general malware. The test will apply sev-
eral combinations of Neural Network parameters such
as learning rate, hidden neurons, and the number of
epochs. The learning rate tested is 0.1, 0.05, and 0.01,
with the number of epoch 100, 200, and 300.
2.4 Dataset
The dataset is a pcap (packet capture) file that con-
tains network traffic packets with a total of 79 fea-
tures. The pcap file was taken from a total of 1900
android applications with a percentage of 20% mal-
ware and 80% benign. The dataset is divided into
three groups, sourced from 250 adware applications,
150 general malware applications, and 1500 benign
applications. In the training data, there are 2,312 net-
work flow traffic from general malware, 149,871 for
adware, and 201,609 for benign. In the testing data,
there are 1,626 general malware flow, 24,271 adware
flow, and 62,551 benign flow. The total flow of net-
work traffic used is 442,240 data. The pcap file is
converted to CSV file by using CICFlowMeter appli-
cation, so one flow means one row of data.
2.5 Principal Component Analysis
Principal component analysis or PCA is useful for re-
ducing high dimensions but does not eliminate the
essence of the information. PCA transforms some
related variables into several new variables that are
not interconnected. Each variable will be checked for
connectedness with other variables and will be sorted
according to the most significant relationship. Math-
ematically, PCA looks for a linear transformation T
that maximizes the equation 1
T
t
Cov
x− ¯x
T (1)
Cov
x− ¯x
is the covariance matrix of data X with
zero average. This linear mapping can be formed with
the principal eigenvectors of the covariance matrix.
Therefore, PCA solves eigenproblem in equation 2.
Cov
x− ¯x
v = λv(x) (2)
2.6 Objectives and Evaluation
F-measure is used instead of accuracy for evaluating
the model because of the class imbalance between
data labeled as malware versus benign. One fifth of
the data is labeled as malware and the rest of the
data is labeled as benign. F-measure is used to help
in drawing conclusions in which Neural Network pa-
rameters are the best. The advantage of using the F-
measure for evaluation is it combines precision and
recall into a single unit. Figure 2 shows the confu-
sion matrix used to obtain the values of True Positive,
False Positive, True Negative, and False Negative.
Figure 2: Confusion matrix.
Equation (3), (4), and (5) are the equations to cal-
culate precision, recall, and F-measure.
Presisi =
T P
T P + FP
(3)
CONRIST 2019 - International Conferences on Information System and Technology
268
Recall =
T P
T P + FP
(4)
F − measure = 2x
PrecisionxRecall
Precision + Recall
(5)
3 RESULT AND DISCUSSION
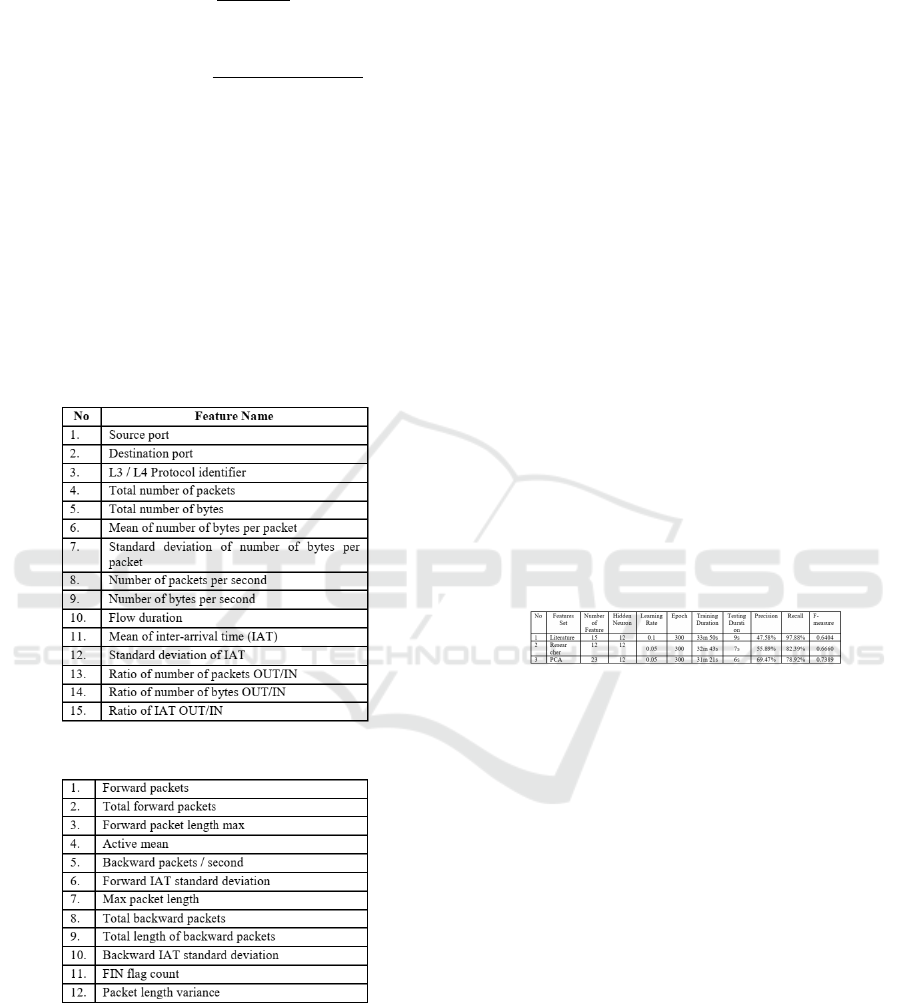
3.1 Features Combination
There are 3 sets of features combination. First, from
the literature review, there are 15 features as seen in
Figure 3. Second, the researcher chose 12 features
from the researcher’s understanding of malware be-
havior as seen in Figure 4. Third, from PCA, there
are 23 features derived from 79 features originally.
Figure 3: Literature review features.
Figure 4: Researcher features.
3.2 Discussion
The implementation and testing environment is car-
ried out in cloud computing because the CSV data
that must be processed is quite large, both for training
and testing. The weight configuration on the Neural
Network was generated randomly for the first train-
ing, then the weight is updated. The training was re-
run until the epoch was finished. Then the testing was
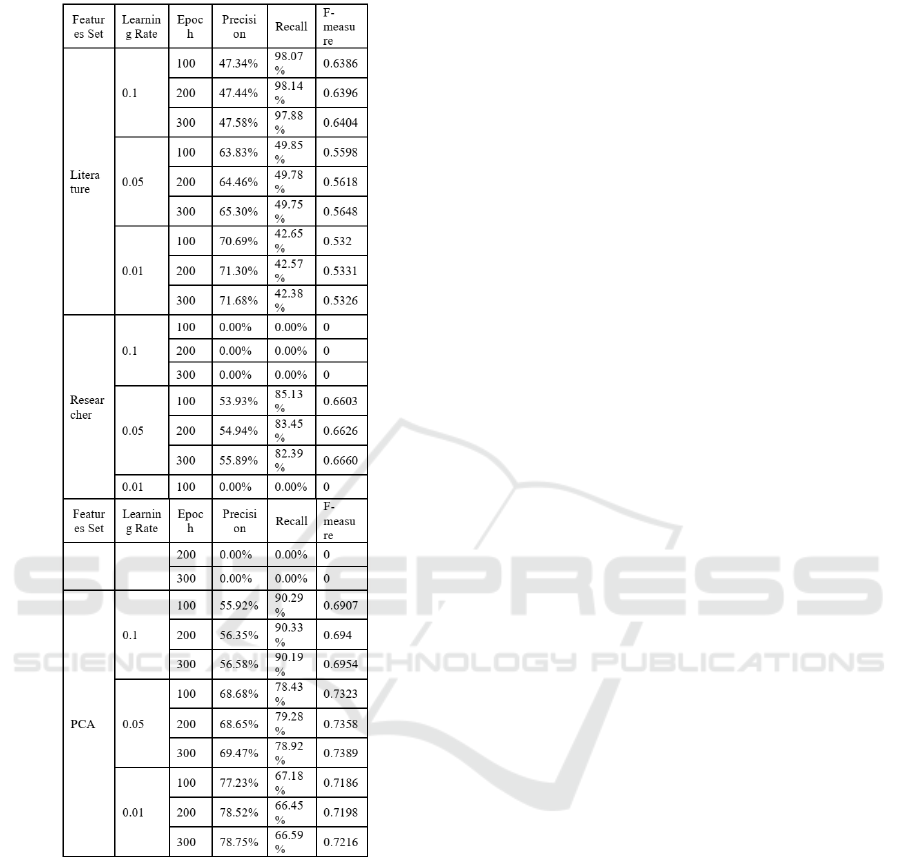
run with feed-forward algorithm. Figure 5 shows a
comparison of Neural Network results with literature
review features, researcher features, and PCA. Com-
plete test results for each set of features are given in
the supplement of this article.
The highest F-measure was achieved for hid-
den neurons equal 12. These results are consistent
with Stevanovich’s research (Stevanovic and Peder-
sen, 2014) (Stevanovic and Pedersen, 2015), which
stated that the more hidden neurons used, the per-
formance of Neural Networks tends to be better until
finding a saturation point. The highest F-measure also
achieved for epoch equals 300, the maximum config-
uration. These results are different for the learning
rate.
Increasing learning rate does not guarantee that
the results of the F-measure will also be better. In
researcher features and PCA features, the best results
are achieved when the learning rate is 0.05 only. The
comparison of learning rate and epoch for the combi-
nation of each feature set in hidden neurons 12 can be
seen in Figure 6. The literature features achieve the
best results with the maximum configuration of Neu-
ral Network parameters (learning rate = 0.1 and epoch
= 300).
Figure 5: Neural Network results.
Learning rate is how much change given to the
weight based on the error value, while epoch shows
the number of iterations performed by the computer.
A learning rate that is too big or small can make the
new weight more distant than the expected results.
From Figure 6, it appears that for the combination
of researcher features, some learning processes pro-
duce a value of 0 for precision, recall, and Fmeasure.
This happened because the model created with these
parameters is underfitting when the learning rate is
0.01 and 0.1.
Neural Network with Principal Component Analysis for Malware Detection using Network Traffic Features
269
space
Figure 6: Comparison of Neural Network result of features
set in hidden neuron = 12.
PCA features set gives the best result (F-measure
= 0.7389). This result is significantly higher than the
other two sets. The nature of PCA calculating the
covariance between feature, generates set of features
with the highest F-measure. Interestingly, the training
duration only took 31 minutes and 21 seconds, the
lowest between the three sets, even though the num-
ber of features is the highest (23 features). The PCA
features seemingly make the algorithm running more
efficient or the results converging faster.
Another worth mentioning result is the Fmeasure
of 12 researcher features, which is higher than the 15
literature features (0.6660> 0.6404). This shows that
using more features does not necessarily increase the
accuracy of malware detection with the Neural Net-
work. It appears that the two sets of feature combi-
nations do not intersect but have slightly different F-
measure values. This phenomenon happened because
the more features used, the more internal errors are
involved in the learning process. Each feature has in-
ternal errors, such as errors due to measurement or
errors due to rounding values (Lim et al., 2015). An-
other factor is that each feature has its contribution to
malware detection, and the features which are com-
bined may have the effect of eliminating each other
so that the detection accuracy decreases (Celik et al.,
2015).
4 CONCLUSIONS
Detection of cyber malware based on network traf-
fic features using Neural Network results in different
Fmeasure values for various combinations of features.
The literature features set (15 features) produces an
F-measure of 0.6404, the researcher features set (12
features) produces an F-measure of 0.6660, and the
PCA features (23 features) produces an F-measure of
0.7389. This concludes that PCA can generate fea-
tures that have better results for malware detection
with Neural Network algorithm. Aside from the PCA
result, it is shown that more features used do not mean
that the accuracy of malware detection will also in-
crease.
This research used a dataset with a total of
442,240 data, which is a combination of existing
datasets and the results of laboratory experiments. It
is recommended that the Neural Network model result
can be used for real-time malware detection on IoT
devices and smartphones. Also, further research is
needed on the analysis of the combination of network
traffic features besides using PCA. The drawback of
using PCA is the loss of interpretability. Without do-
main expertise and a lot of guessing, it is difficult to
know the meaning of features derived from the PCA
method.
ACKNOWLEDGEMENTS
This research is partially funded by Ministry of Re-
search, Technology and Higher Education of Repub-
lic of Indonesia.
CONRIST 2019 - International Conferences on Information System and Technology
270

REFERENCES
Celik, Z. B., Walls, R. J., McDaniel, P., and Swami, A.
(2015). Malware traffic detection using tamper resis-
tant features. In MILCOM 2015-2015 IEEE Military
Communications Conference, pages 330–335. IEEE.
for Cybersecurity, C. I. (2017). Android adware and general
malware dataset.
Forouzan, B. A. (2010). Tcp/ip protocol suite. copyright©
2010 by the mcgraw-hill companies.
Kaspersky (2015). Mobile malware.
Kaushik, P. and Jain, A. (2015). Malware detection tech-
niques in android. International Journal of Computer
Applications, 122(17).
Lashkari, A. H., Kadir, A. F. A., Gonzalez, H., Mbah, K. F.,
and Ghorbani, A. A. (2017). Towards a network-
based framework for android malware detection and
characterization. In 2017 15th Annual Conference on
Privacy, Security and Trust (PST), pages 233–23309.
IEEE.
Lim, H., Yamaguchi, Y., Shimada, H., and Takakura, H.
(2015). Malware classification method based on se-
quence of traffic flow. In 2015 International Con-
ference on Information Systems Security and Privacy
(ICISSP), pages 1–8. IEEE.
Lueg, C. (2017). 8,400 new android malware samples every
day, april 2017.
Rashid, T. (2016). Make your own neural network. Cre-
ateSpace Independent Publishing Platform.
Stevanovic, M. and Pedersen, J. M. (2014). An efficient
flow-based botnet detection using supervised machine
learning. In 2014 international conference on comput-
ing, networking and communications (ICNC), pages
797–801. IEEE.
Stevanovic, M. and Pedersen, J. M. (2015). An analy-
sis of network traffic classification for botnet detec-
tion. In 2015 International Conference on Cyber Sit-
uational Awareness, Data Analytics and Assessment
(CyberSA), pages 1–8. IEEE.
Yan, R. and Liu, R. (2014). Principal component analysis
based network traffic classification. Journal of com-
puters, 9(5):1234–1240.
Zhang, J., Xiang, Y., Wang, Y., Zhou, W., Xiang, Y., and
Guan, Y. (2012). Network traffic classification using
correlation information. IEEE Transactions on Paral-
lel and Distributed systems, 24(1):104–117.
Zhou, Y. and Jiang, X. (2012). Dissecting android malware:
Characterization and evolution. In 2012 IEEE sympo-
sium on security and privacy, pages 95–109. IEEE.
Neural Network with Principal Component Analysis for Malware Detection using Network Traffic Features
271
