
How is the Application of Analytical Hierarchy Process in Supplier
Performance Assessment?
Iren Sukmawati R.
1
, Umi Rochayati
1
and Muhammad Imron Romadhon
1
1
Electronic and Informatics Engineering Education Study Program, Universitas Negeri Yogyakarta, Yogyakarta, Indonesia
Keywords:
Decision Support System, Analytical Hierarchical Process, Supply Chain Operation Reference, Performance
Assessment, Supplier.
Abstract:
This study aims to measure supplier performance more accurately using the Analytical Hierarchical Process
(AHP) method. The AHP method does the weighing and measurement of each evaluation criterion in the
Performance Assessment of Decision Support System (DSS). This study took twenty suppliers samples con-
sisting of ten local suppliers and ten national sample suppliers at Karsa Utama Lestari Ltd Gorontalo. This
study is quantitative. We use the interview method to collect data. Besides, data analysis techniques use ana-
lytical descriptions. The results showed that the assessment using the AHP method had five main criteria, 16
sub-criteria, and 37 sub-criteria. Five main measures were taken in the process of the Supply Chain Operation
Reference (SCOR) approach, such as reliability, responsiveness, coast, flexibility, and assets. Therefore, this
method produces better performance measurements compared to conventional performance appraisal models
because the results of supplier performance assessment can be observed quickly and precisely interpreted in a
diagram on a computer.
1 INTRODUCTION
Suppliers are a crucial part of the supply chain. Sup-
pliers also affect the activeness of a company. The
accuracy in choosing suppliers can reduce purchasing
costs, increase market competitiveness and increase
product end-user satisfaction (
¨
On
¨
ut et al., 2009).
A Trial is conducted on suppliers related to the
information function between suppliers and compa-
nies (Hald and Ellegaard, 2011). Suppliers must con-
tinue to be monitored to have cooperation with the
company and are always tracked at all times (Sell-
berf and Broman, 2000). According to Cousins et
al. (2008), the method of Analyzing the Hierarchical
Process (AHP) not only in terms of communication
and operations but in terms of price and business can
be used as a supplier or supplier assessment.
Karsa Utama Lestari Ltd has approximately 500
suppliers spread across parts of Indonesia. A large
number of suppliers cause several problems to pri-
oritize demand for certain goods. These problems
are difficulties with significant demand for products,
limited supply of goods from suppliers, and slow re-
sponse from suppliers. This problem has a profound
impact on company stability. Therefore, companies
need a performance measurement system for suppli-
ers. This system uses the Supply Chain Operations
Reference model (SCOR). The SCOR approach is the
main cafeteria at the company Karsa Utama Lestari
Ltd. The SCOR approach aims to determine crite-
ria and sub-criteria that are suitable for the company
when the company selects the criteria for evaluating
performance against suppliers.
The results of the performance measurement ap-
proach are measured based on criteria using the AHP
(Analytical Hierarchy Process method) method. The
function of this method is to determine the weights for
each supplier’s performance criteria and indicators.
We developed a DSS system using the AHP method
to measure the performance of each supplier more ef-
ficiently and to supervise suppliers who collaborate
with the company. Besides, the company can control
the amount of stock of goods if suppliers make delays
in the supply of goods.
SCOR is effectively applied for evaluating sup-
plier performance because SCOR has performance at-
tributes (Team, 2006). Performance attributes are cell
attributes that are used to assess supply chain pro-
cesses from a variety of different perspectives. The
SCOR method has five attributes to evaluate supply
chain performance. Multiple metrics can be used as
performance measurement metrics in one attribute.
Sukmawati R., I., Rochayati, U. and Romadhon, M.
How is the Application of Analytical Hierarchy Process in Supplier Performance Assessment?.
DOI: 10.5220/0009908202190226
In Proceedings of the International Conferences on Information System and Technology (CONRIST 2019), pages 219-226
ISBN: 978-989-758-453-4
Copyright
c
2020 by SCITEPRESS – Science and Technology Publications, Lda. All rights reserved
219
Based on (Karjalainen, 2012), performance im-
provement from suppliers requires a framework. AHP
is used as an international supplier selection as a
domain strategy model. Assessment criteria on the
supplier’s performance can be obtained based on the
problems in the company. Supplier performance eval-
uation is very important for the sustainability of a
company (Domier, 1998), and the concept of supply
chain management (SCM) can overcome global com-
petition between companies (Ahmad and Yuliawati,
2013). A standardized company is a company that can
meet all market needs, meet the needs of each of its
customers, incur low enough costs to stock products,
manage industries more flexible.
The AHP model has several criteria, including
quality, endurance test (Zahir, 2014). Other mea-
sures are a delivery process, price, response, busi-
ness and stability, information about process devel-
opment, technical capability, and excellent and stable
background. In short, there are three criteria for the
best suppliers to produce decisions in the selection of
suppliers who can cooperate with the company. Ac-
cording to (Baily et al., 2005), an excellent supplier
must deliver goods on time, remains consistent with
the quality of an item, provides a much lower price
or the best price, and has a stable background. Be-
sides, the supplier must give after-sales service good,
provide services to good inventory, conduct what will
be done, and provide information on developments to
consumers or companies.
This study uses the SCOR approach to decide the
category and sub-category appropriating for the com-
pany. Besides, this study also uses the DSS method.
DSS is an AHP method to measure the performance
of suppliers results from the way to be used. Then the
results can be seen to measure supplier performance.
In this study, the main criteria used are those that are
in the SCOR approach. The SCOR approach crite-
ria are reliability, responsiveness, flexibility, coast, as-
sets. Sub criteria are taken from the SCOR approach
based on the main criteria located at PT. Karsa Utama
Lestari. Besides, this study only reached the comple-
tion of level 1- Top-level (a type of process), because
in this study only defines one of the five core manage-
ment processes of the SCOR model, which is called
source.
2 THEORY STUDY
2.1 Supplier
(Chopra and Meindl, 2007) suggested that the supply
chain is a general description of how to manage an
organization in terms of distributors, manufacturers,
and consumers. The goal of the supply chain is to
meet the needs and generate consumer profits. A per-
formance attribute is a cell attribute to evaluate supply
chain processes from a variety of different perspec-
tives. Five attributes to assess supply chain perfor-
mance are the use of performance attributes from the
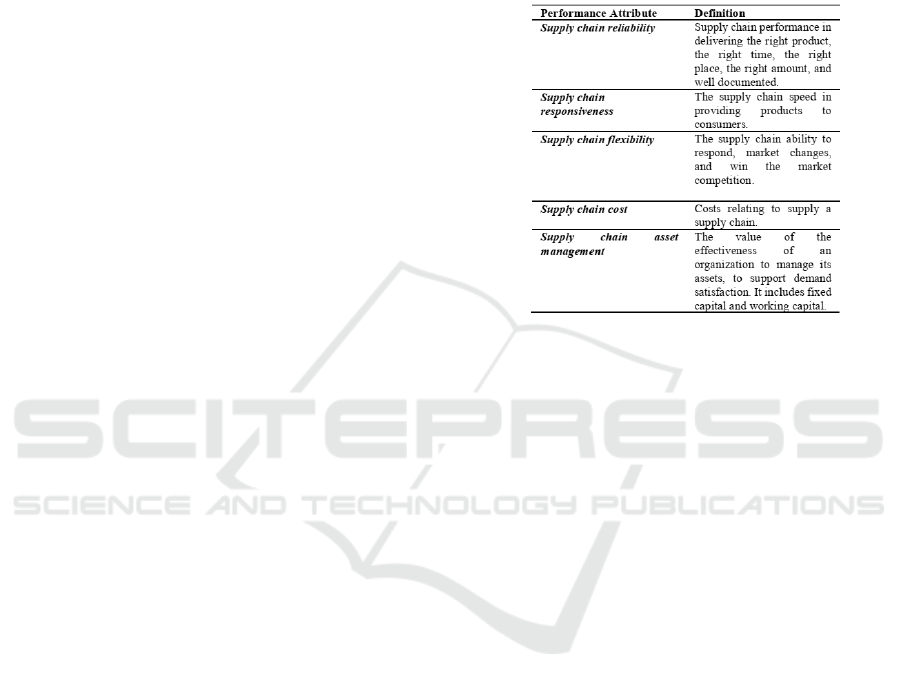
Supply Chain Operation Reference (SCOR).
Figure 1: Performance attributes.
2.2 Decision Support System
DSS was known in the early 1970s by Michael S.
Scott, as the Management Decision System. DSS was
a computer-based system to helps decision making by
utilizing data and models to solve unstructured prob-
lems (Turban et al., 2005).
2.3 Analytical Hierarchy Process (AHP)
This method is used to decided effective decisions on
complex problems. It began to simplify and speed up
the decision making process by solving the problem
into its parts, arranging variables in a hierarchical ar-
rangement, giving a numerical value. To subjective
considerations of the importance of each variable and
synthesize is to consider and determine which vari-
able has the highest priority and act to influence the
outcome of the situation.
The AHP process can solve the problem in an or-
ganized frame of mind so that it can be expressed to
make effective decisions on the problem. (Marimin,
2004). AHP method has ten advantages proposed by
(Marimin, 2004), namely: (1). The AHP method has
the advantage of dealing with a significant and un-
structured problem into a model that is more flexible
and easier to understand. (2) AHP is very complex,
and this method overcomes very complex problems
by using a system approach and integration by deduc-
tion. (3) influence each other, and this method is able
CONRIST 2019 - International Conferences on Information System and Technology
220
to be used on elements. It consists of free and do
not require linear relationships. (4) hierarchical ar-
rangement, in this method, is a representative of nat-
ural thinking, tending to group more system elements
at different levels from each level that has the con-
tents of similar elements. (5) having measurements,
this method has an alternative measurement scale and
methods for getting priority. (6) Consistent, the AHP
method firmly maintains what is called logical consis-
tency in carrying out assessments used to determine
priorities. (7) Synthesis, AHP leads to overall think-
ing about what some of the alternatives want. (8) Bar-
gaining, the purpose of bargaining in this method is
that AHP takes priority seriously so that other people
can choose the best alternative to achieve what they
have designed. (9) Assessment and Consensus, this
method does not require the presence of a counselor,
but in this method, how to combine the results of dif-
ferent assessments. (10) Repetition of the process,
the intention can make people able to filter the under-
standing of one problem and develop an assessment
and understanding through the process of repetition.
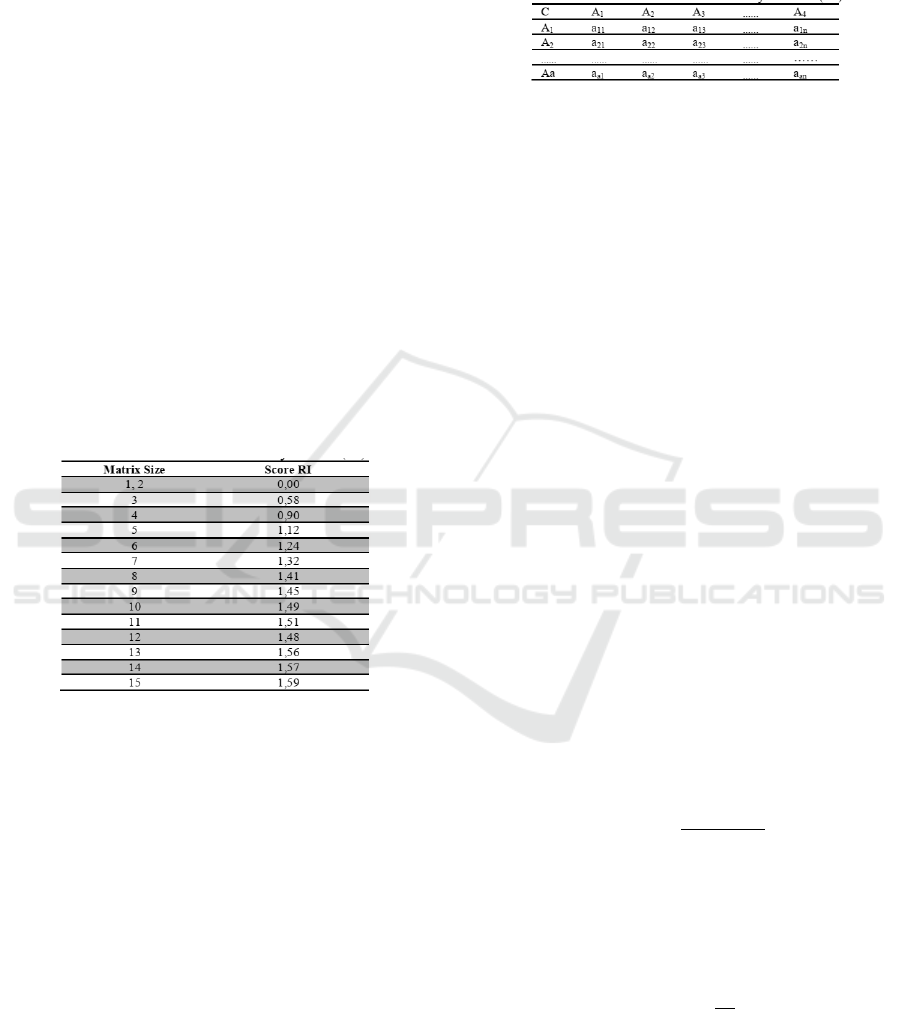
List of random consistency index (IR) can be seen
in the following table:
Figure 2: Performance attributes.
2.4 Steps of the AHP Method
The steps in the AHP method include (Kusrini, 2007)
as follows:
1. Define the problem and determine the desired so-
lution, then arrange the hierarchy of the prob-
lem at hand. The hierarchy arranges to set goals,
which are the overall system goals at a limited
level.
2. Determine the priority of the element
(a) The first step is to make a paired comparison,
i.e., comparing the elements in pairs according
to the given criteria.
(b) Paired comparison matrices are filled using
numbers to represent the relative importance of
one element to the other elements.
The comparison matrix can be seen in Figure 3,
where this matrix explains the relative contribu-
tion or something that influences each element of
the objectives or criteria.
Figure 3: List of Random Consistency Indices (IR) Source:
(Saaty, 1980).
3. Synthesis
Considerations of pairwise comparisons are syn-
thesized to obtain overall priority. The things
done in this step are:
(a) Add up the values of each column in the matrix
(b) Divide each value from the column by the total
column in question to obtain matrix normaliza-
tion.
(c) Add up the values of each row and divide by the
number of elements to get the average value.
4. Measure consistency
In making decisions, it is essential to know how
the right consistency is because we do not want
decisions based on considerations with low con-
sistency. Things are done in this step:
(a) Multiply each value in the first column by the
relative priority of the second element, and so
on.
(b) Add up each row
(c) The results of the row addition are divided by
the relative priority element in question.
(d) The number of quotient above with the number
of elements available, the result is called max.
5. Calculate consistency index (CI) with the for-
mula:
CI =
λmaks − n
n − 1
(1)
Where:
n = Number of elements
6. Calculate the consistency ratio (CR) with the for-
mula:
CR =
CI
IR
(2)
Where:
CR = Consistency ratio
CI = Consistency index
IR = Index random consistency
How is the Application of Analytical Hierarchy Process in Supplier Performance Assessment?
221
7. Checking is the same as hierarchical consistency.
If the value is more than 10%, then the judgment
data must be improved. However, if the consis-
tency ratio (CI / IR) is less or equal to 0.1, then
the calculation results can be declared correct. A
list of consistency random index (IR) can be seen
in table 2.
3 METHOD
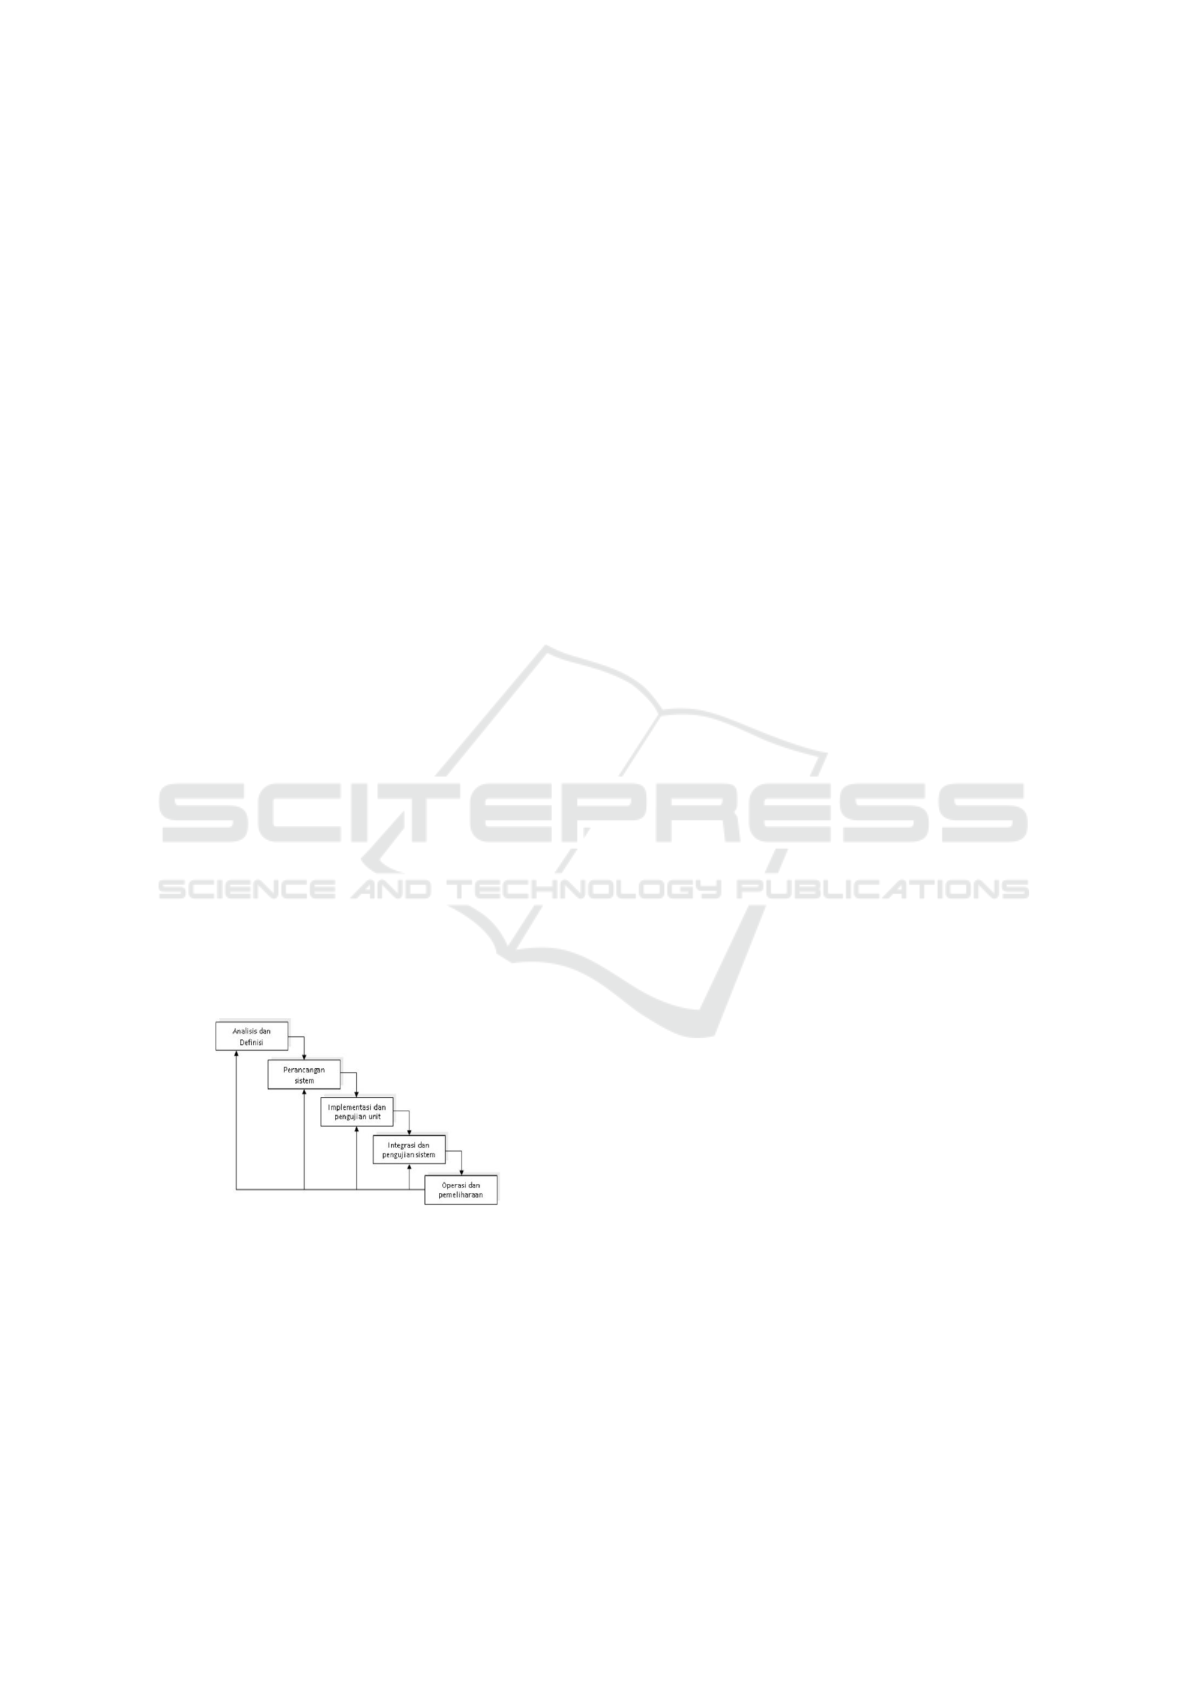
This study uses the Waterfall system development
method (based on the waterfall stage in (Arbani et al.,
2011)). The advantages of the waterfall include the
process is easy to understand and clear and to man-
age the project. Besides, the document is generated
in every phase; a phase is run after the previous pe-
riod is complete; the system structure is transpar-
ent; user needs are well understood; the possibility
of changes in user needs is slight. The sample of the
study is twenty suppliers samples consisting of ten
local suppliers and ten national sample suppliers at
Karsa Utama Lestari Ltd Gorontalo.
3.1 Analysis and Definition
This stage carries out the process of analyzing the val-
uation model previously at Karsa Utama Lestari Ltd.
After we decided on the subsequent analysis stage,
We conducted a literature study and literature study.
We make observations and interviews to obtain infor-
mation and data needed in this study. Data referred to
as the number of suppliers who have partnered with
the company.
Figure 4: The stages in the waterfall
3.2 System Planning
The stages of system design are intended to design
an information system design. The assessment pro-
cess using AHP will be entered into a performance
appraisal information system. Where at this stage, the
application design will be made, and database design.
3.3 Unit Implementation and Testing
This stage will be carried out in the testing process.
The system will be tested using black-box testing; the
coding or program will be written before we translate
the system process design into a language that is rec-
ognized by the computer. The programmer’s tip does
this stage, in which the programmer will explain the
needs desired by a user into the form of a program.
3.4 System Integrity and Testing
This stage is the final stage in the application of the
AHP method in a performance appraisal system. This
stage will also make improvements if problems or de-
ficiencies are found in the performance appraisal sys-
tem.
3.5 Operation and Maintenance
Operation and maintenance is the last stage in the wa-
terfall model because the maintenance process of the
system used, and it has been applied to the decision
support system (DSS) method.
4 RESULTS
The result showed that supplier performance appraisal
is still less than optimal in terms of quality and time.
Karsa Utama Lestari Gorontalo Ltd conducted to as-
sess supplier performance every six months. The as-
sessment result showed that the lack of optimality
and effectively in terms of time because the supplier’s
performance evaluation uses the observation method
without having detailed documentation.
The aimed of assessing the performance of suppli-
ers is to get suppliers that have good quality, respon-
sibility and can meet the needs of the company. The
results of the data collection showed that the top 10
local and national suppliers could be seen in Figure 5.
Data inputted on the system implementation is tested
using manual calculations on Excel. The results dis-
played on the system implementation are the same
as manual calculations so that the application created
can view the results of supplier performance measure-
ments using the AHP method appropriately. The as-
sessment process of local suppliers and national sup-
pliers on Karsa Utama Lestari Gorontalo Ltd still uses
the observation evaluation model.
The traditional model does not have detailed doc-
umentation in the performance appraisal process of
each supplier. The DDS method is the Analytical Hi-
erarchy Process (AHP) method, which consists of 5
CONRIST 2019 - International Conferences on Information System and Technology
222
chief criteria, 16 sub-criteria, and 37 sub-criteria. The
results of the assessment used the assessment method
of AHP, which was made into two suppliers, local and
national suppliers:
Figure 5: Local and national suppliers (Source: Interview
with Director of Karsa Utama Lestari Gorontalo, 2015).
4.1 Analysis of the Calculation Process
using the AHP Method
In the analysis of this process, the authors use the
AHP method in completing calculations to measure
supplier performance. All data, subcriteria, and sub-
criteria are used to get the final result of this process.
After obtaining the input data needed, the next step is
to perform calculations using the AHP method. Some
steps that must be done are:
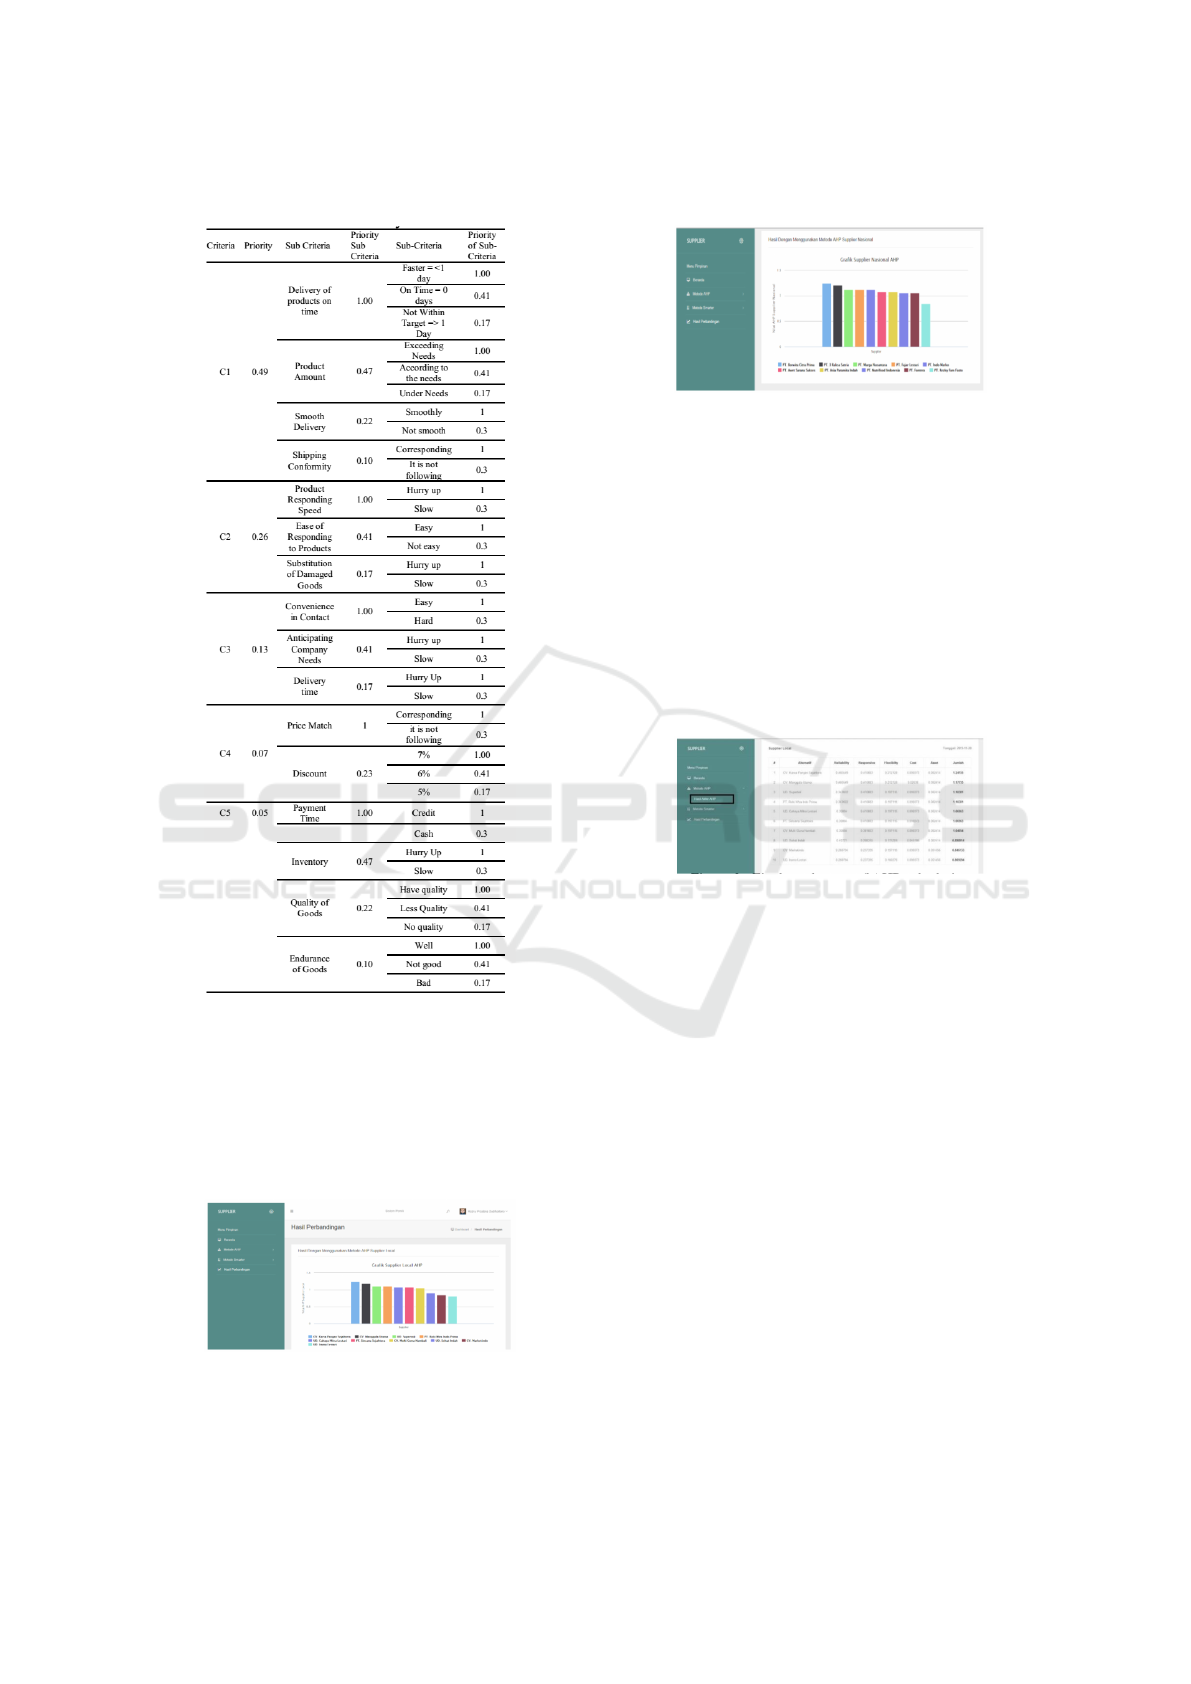
4.1.1 Determine the Types of Criteria
In this study, the authors conducted studyat Karsa
Utama Lestari Gorontalo Ltd in measuring sup-
plier performance in determining supplier ranking,
which will become a partner at Karsa Utama Lestari
Gorontalo Ltd. The criteria that will be used in the
assessment consist of 5 main criteria based on the
SCORE approach. The 5 criteria are:
C1 = Reliability
C2 = Responsive
C3 = Flexibility
C4 = Coast
C5 = Asset
4.1.2 Make a Pairwise Comparison Matrix
A comparison between one criterion and another will
be assessed at this stage. The upper triangle matrix
element is input. A comparison of one criterion and
other criteria will also be evaluated. The results of the
assessment can be seen in Figure 6.
space
Figure 6: Pairwise comparison matrix table.
We use the formula to get the value of the lower
triangular matrix element:
a[ j,i] =
1
a[i, f ]
unuki 6= j (3)
The results add up the values of each column in
the matrix. The results can be seen in Figure 7.
Figure 7: Matrix tables of pairwise comparison values.
In column (C1 row C2) is the result of an interme-
diate calculation ((value in column C1 row C1 = 1)
/ (value in column C2 row C1 = 2)) gets a result of
0.33. While the total value is obtained from the sum
of each column, for example the value of the num-
ber of columns C1 = 1.79 is obtained from the sum of
column values C1 (1 + 0.33 + 0.20 + 0.14 + 0.11).
After getting the paired comparison matrix value,
the next step is to divide the value of each element by
the number of each column in table 6, namely (row
value column = = value in table 6 column C1 row C1
= 1) / (sum of each column = 1.79) Then for the other
values obtained from the same calculation, for more
clearly the results can be seen in Figure 8 below.
Figure 8: Table of the criteria value matrix.
The results of the sum column in Figure 8 are ob-
tained from the sum of each row, for example: value
= 2.51 is obtained from the sum (0.56 + 0.64 + 0.52
+ 0.43 + 0.36), for the next row is obtained from the
same calculation results.
As for the value in the priority column obtained
from (the value of the number of columns) / (number
How is the Application of Analytical Hierarchy Process in Supplier Performance Assessment?
223
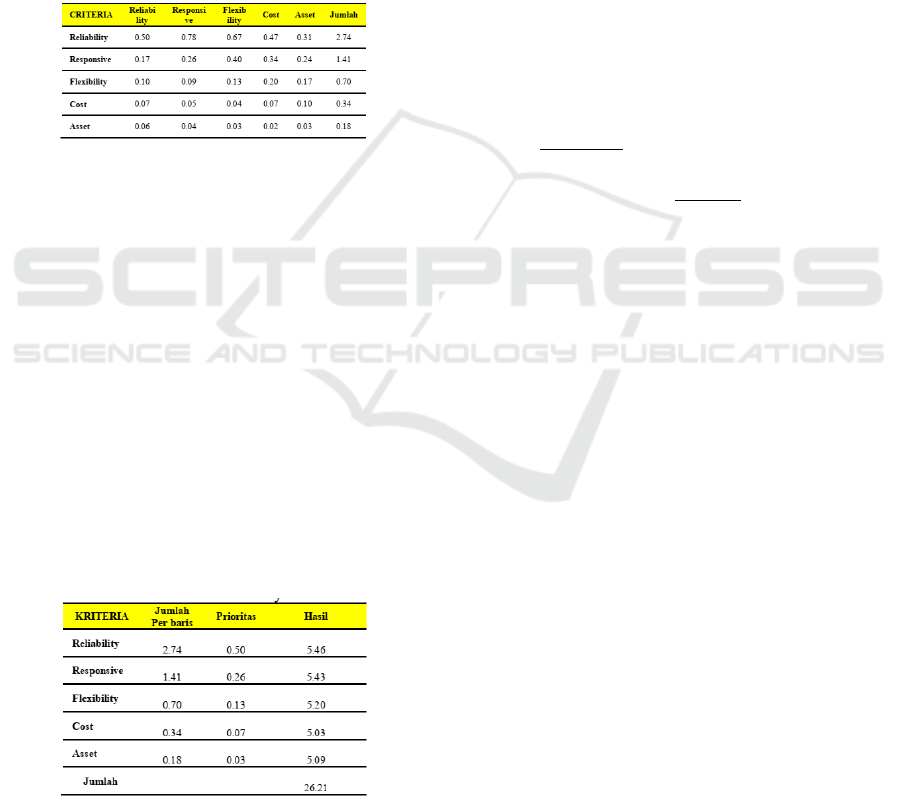
of criteria), which is five criteria. For example, for the
priority value of line C1 = 0.50 obtained from (value
of the number of rows C1 = 2.51) / (number of criteria
= 5), the same steps are carried out in the previous
rows.
4.1.3 Make an Addition Matrix for Each Line
To make the addition matrix for each row in this way,
(value of priority in table 7) * (pairwise comparison
matrix in table 6). For example, (C1 priority value in
table 7 = 0.50) * (C1 row C1 in table 6 = 1) = 0.50.
The other values are obtained in the same way; the
results can be seen in Figure 9 viz.
Figure 9: Table of the criteria value matrix.
After multiplying each element by the priority
value, then add each row from the obtained matrix.
For example for line elements C1 = 2.74 is the sum
of (0.50 + 0.78 + 0.67 + 0.47 + 0.31), then the other
rows are carried out with the same calculation process
up to C5.
4.1.4 Calculate Consistency Ratio
The value calculation of the consistency ratio aims
to see the value of the consistency ratio (CR). If the
value of CR <= 0.1 then the calculation can be ac-
cepted or valuable. Whereas if the CR value is more
significant than 0.1, then the pairwise comparison ma-
trix must be corrected so that it is declared to be in-
appropriate. To calculate the value of the consistency
ratio can be seen in Figure 10 below.
Figure 10: Consistency ratio table.
The value in the sum column of each row is ob-
tained from the value of the sum column in table 8,
while the priority column value is obtained from the
priority column value in Figure 8. For the result, col-
umn values are obtained from the sum of the sum val-
ues for each row with priority. For example the value
of 5.46 results from (column number in row C1 =
2.74) / (priority column in row C1 = 0.50) = 5.46 and
so on until row C5. After obtaining the value of the
results of each row, then the next is to add all the val-
ues in the results column so that the results obtained
are 26.2.
After obtaining the total value of 26.21, the next
step is to calculate the value of λmax. The value of
λ max is obtained from the value of number = 26.21
/ number of criteria = 5. In this study, the number of
criteria is five criteria, so the λmax value is 5.26.
4.1.5 Calculate the Consistency Index
Calculating the consistency index (CI) using the fol-
lowing formula:
CI =
λmaks − n
n − 1
CI =
5.26 − 5
5 − 1
CI = 0.26/4
CI = 0.06 (4)
4.1.6 Calculate Consistency Ratio
The value of the consistency ratio (CR) is obtained
using the formula below:
CR = CI/IR
CR = 0.06/1.12
CR = 0.05 (5)
Where the value of 0.05 is obtained from the
calculation of the consistency index in the previous
stage, while the value of IR (Random Index) is taken
from the rules of the random index predetermined ac-
cording to the matrix size of the elements, where the
IR value rules have been displayed in table 2 so that
the results of CR are = 0.05, therefore CR ¡= 0.1,
the consistency ratio from the calculation can be ac-
cepted.
The same steps are carried out in the calculation of
sub-criteria and calculation of sub-criteria, the same
calculation in the previous stage determines the prior-
ity of sub-criteria and priority of subcriteria using the
AHP method. In order to obtain the values of each
element in the sub-criteria and sub-criteria, as shown
in Figure 11 below.
CONRIST 2019 - International Conferences on Information System and Technology
224
space
Figure 11: Consistency ratio table
4.2 Solving Results using the AHP
Method
This display is a display of the results of local and
national supplier assessments using the AHP method.
Figure 12: Comparison results page of local AHP method
space
Figure 13: Comparison results page of the national AHP
method
In this research, the problem that has been ex-
plained above is resolved by the application made,
namely Measuring Supplier Performance, with the
SCOR approach using the AHP method, which can
be accessed through the website. How is the Applica-
tion of the Analytical Hierarchy Process in Supplier
Performance Assessment? In this study, it can be
seen that the application of the AHP method in perfor-
mance appraisal provides more structured and stored
results in a database. The several displays that show
information about the measurement results using the
AHP method can be chosen in Figure 14.
Figure 14: Final result page of AHP calculation
5 CONCLUSIONS
The study explained that how to solve a problem
with a measuring supplier performance that is less ef-
fective in measuring supplier performance to deter-
mine which suppliers can be maintained as partners
in Karsa Utama Lestari Gorontalo Ltd. The supplier
performance appraisal process still uses the conven-
tional appraisal process without supporting data, and
there is no decision support system in measuring sup-
plier performance to determine which suppliers will
be partners with Karsa Utama Lestari Ltd.
The supplier performance evaluation system is a
system to assess the performance of suppliers who are
at Karsa Utama Lestari Gorontalo Ltd. The method
is used DSS, which is called the Analytical Hierar-
chy Process (AHP). The AHP method consists of five
studies at criteria, 16 sub-criteria, and 37 sub-criteria.
We used five main criteria in the supply chain op-
eration reference (SCOR) approach. They are reli-
ability, responsiveness, flexibility, coast, and assets.
How is the Application of Analytical Hierarchy Process in Supplier Performance Assessment?
225

The DSS method used in the supplier performance
evaluation process, the Analytical Hierarchy Process
(AHP) method, is significantly better than the conven-
tional assessment process.
The results showed that the evaluation of the fi-
nal results using the method is the company can see
which suppliers can be used as partners in the com-
pany.
The process of applying the AHP method begins
by making a pairwise comparison matrix, making a
sum matrix for each row, calculating the consistency
ratio, calculating the consistency index, and calculat-
ing the consistency ratio. Furthermore, the values ob-
tained in the priority criteria, priority sub-criteria, and
priority sub -sub-criteria will be used in the process
of evaluating the performance of local suppliers and
national suppliers. In contrast, the previous method
did not have a valuation model because it was still
conventional.
The result of the calculation process carried out by
the AHP method with the calculation of the assess-
ment done manually will undoubtedly produce differ-
ent values.
The applying of the AHP method used priority
values on sub-criteria. The product delivery subcri-
teria on time and sub-criteria are faster, more timely,
and not on target, as well as other subcriteria and sub-
criteria obtained by the AHP method. In contrast,
the company does not use the assessment model as
above. While the assessment process carried out be-
tween AHP methods has different values and results
at local and national suppliers.
The AHP modeling, the weighting process, uses
interests based on guidelines on the decision support
system (DSS). The benefits entered in the triangle
matrix are the results that have been agreed by the
company, where reliability is more important than all
the main criteria. So, the analytical hierarchy pro-
cess method can help to determine company perfor-
mance. The results are shown in the previous dis-
cussion, where the conventional assessment process
is a subjective assessment. With the application of the
AHP method of supplier performance appraisal in the
company to get results following the quality of each
company.
6 SUGGESTIONS
The result of the study is the development of a mea-
suring supplier performance system. However, sup-
pliers cannot see the results of the assessments given
by the company. For this reason, this future study is
expected to be developed to produce an information
system, and suppliers can see the results of the assess-
ment provided by the company. Suppliers can access
the system, for example, getting their logins from the
relevant agencies.
REFERENCES
Ahmad, N. H. and Yuliawati, E. (2013). Analisa penguku-
ran dan perbaikan kinerja supply chain di pt. xyz.
Teknologi, 6.
Arbani, M. et al. (2011). Pengembangan sistem informasi
sekolah berbasis web: studi kasus mi an-nizhomiyah
depok.
Baily, P., Farmer, D., and Jessop, D. (2005). Purchasing
principles and management. Pearson Education.
Chopra, S. and Meindl, P. (2007). Supply chain man-
agement. strategy, planning & operation. In Das
summa summarum des management, pages 265–275.
Springer.
Hald, K. S. and Ellegaard, C. (2011). Supplier evaluation
processes: the shaping and reshaping of supplier per-
formance. International Journal of Operations & Pro-
duction Management.
Karjalainen, M. (2012). Framework for supplier perfor-
mance measurement system.
Kusrini, K. (2007). Aplikasi sistem pendukung keputusan.
Yogyakarta: Andi.
¨
On
¨
ut, S., Kara, S. S., and Is¸ik, E. (2009). Long term supplier
selection using a combined fuzzy mcdm approach: A
case study for a telecommunication company. Expert
systems with applications, 36(2):3887–3895.
Saaty, T. (1980). The analytic process: planning, priority
setting, resources allocation. McGraw, New York.
Saaty, T. L. (2001). Decision making for leaders the analyt-
ical hierarchy process. University of Pittsburgh, USA.
Team, S.-C. C. (2006). Supply chain operation reference
model version 8.0. Supply Chain Council, inc.
Turban, E., Liang, T.-P., and Aronson, J. E. (2005).
Decision Support Systems and Intelligent Sys-
tems:(International Edition). Pearson Prentice Hall.
Zahir, S. M. (2014). Evaluasi pemasok dengan metode an-
alythic hierarchi process.
CONRIST 2019 - International Conferences on Information System and Technology
226
