
Model Development of Smart Transportation using the Performance
Measurement of Smart City Result with It Balance Scorecard and IPA
Matrix: Jakarta Case
Ratna Sari
1,2
, Firman Anindra
2,3
, Raymond Kosala
2
, Benny Ranti
2
and Suhono Harso Supangkat
2,4
1
Information Systems Department, School of Information Systems, Bina Nusantara University, Jakarta 11480, Indonesia
2
Computer Science Department, BINUS Graduate Program-Doctor of Computer Science, Bina Nusantara University,
Jakarta 11480, Indonesia
3
Department of Informatics and Communication Universitas Nasional, Jakarta, Indonesia 12520
4
Sekolah Teknik Elektro dan Informatika, Institut Teknologi Bandung, Bandung, Indonesia
Keywords:
Transportation, Smart Transportation, IPA Matrix, Balance Scorecard, Model, Development
Abstract:
The purpose of this research is to carry out evaluations and measurements related to the application of smart
cities Jakarta which will continue propose a smart transportation model. The methodology used in the evalua-
tion is using the IT Governance approach with the IT Balance Scorecard and IPA Matrix with 200 respondents
from Jakarta residents. The results of this paper show there are three major problems that need to be addressed
immediately: Deliver Value; Manage operational service performance; Deliver successful IT projects, and the
solution purposed is creating smart transportation model, as a form of improvement.
1 INTRODUCTION
The population growth has increased to 29.43% from
2017 to 2050, reaching 9.772 billion people (of Eco-
nomic and Affairs, 2017). The result of this condition
is increasing complex in one of big cities problems,
but transportation also being one problem in large
cities. Good transportation facilities just avoid con-
gestion are always the main points, but beside that the
needs to be considered is provoding safe and comfort-
able transportation being a real thing faced in the city
today. Based on land transportation statistics from In-
donesian Central Bureau of Statistics, it is known that
the level of accidents is still high even the death is
quite high.
The high mobility of people and goods in Jakarta
still not in accordence with safety and comfortable
public transportation. The current trend is designing
smart transportation related to smart alternatives to
control private vehicles and reduce congestion (Pin-
darwati and Wijayanto, 2015) Previously, the simi-
lar development had been carried out, not only us-
ing transportation system management but also using
RFID as part of its development (Wen, 2010).
In Indonesia especially Jakarta City, many imple-
mentation proposals have been made, but for some
people, application of the technology is the main
point, but conversely transportation is not only about
avoiding congestion but also how to create safe trans-
portation. The level of accidents related to transporta-
tion still not good and become a story, we can say, it
happend without stopping.
In this paper will conduct an assessment in ad-
vance related to the implementation of smart city
that has been applied before and propose the design
of transportation system framework specifically in
Jakarta to provide smart and safe transportation solu-
tions. This study is based on literature and the data
used are land transportation statistics from the Na-
tional Statistics Agency.
2 RELATED RESEARCH
Previously, the research started with reference search
related to smart transportation previous research
which would be used as references:
Sari, R., Anindra, F., Kosala, R., Ranti, B. and Supangkat, S.
Model Development of Smart Transportation using the Performance Measurement of Smart City Result with It Balance Scorecard and IPA Matrix: Jakarta Case.
DOI: 10.5220/0009907901990205
In Proceedings of the International Conferences on Information System and Technology (CONRIST 2019), pages 199-205
ISBN: 978-989-758-453-4
Copyright
c
2020 by SCITEPRESS – Science and Technology Publications, Lda. All rights reserved
199

Table 1: Previous Research Comparison of Smart Trans-
portation Model
Author Literatur Result
(Pindarwati
and Wi-
jayanto,
2015)
Measuring
performance
level of smart
transportation
system in
big cities of
Indonesia
Presented
a compre-
hensive
framework
for bench-
marking
smart trans-
port cities,
which was
illustrated
using the data
of 5 large city
in Indonesia
(Dirgahayani,
2013)
Environmental
co-benefits
of public
transportation
improvement
initiative:
the case of
Trans-Jogja
bus system in
Yogyakarta,
Indonesia
This paper
examined the
environmen-
tal co-benefit
of public
transport
improvement
programme
by taking the
introducting
of Trans-jogja
bus system
in Greater
Yogyakarta,
Indonesia
as the case
study.
(Wibowo and
Suryanegara,
2016)
On develop-
ing the model
of Smart
Logistic
Transport in
Indonesia
Proposed
the business
model of
smart logistic
transport in
Indonesia
(Effendi et al.,
2016)
Smart city
Nusantara
development
through the
application of
Penta Helix
model
This paper
presented the
framework
for smartcity
nusantara
with penta
helix model
collaboration.
(Purnomo
et al., 2016)
Smart city in-
dicators: A
systematic lit-
erature review
This paper
conducted
research of
generating
the developer
trend in the
Smart City,
especially
on indicators
which are
generally
regarded as
the main
factors in
deciding the
development
of the city
Previous studies focused more on building models
without conducting an assessment process and also
prior evaluation. This research will start with evalua-
tion and also continue with assessment process related
to the application of smart city will be carried out us-
ing the BSC IT approach which the approach is used
not only ttake measurements but also as an assess-
ment of IT management systems and in detail con-
ducting assessments related to 4 perspectives namely:
(1) Corporate Contribution; (2) Stakeholders; (3) Op-
erational Excellence; (4) Future Orientation (Grem-
bergen, 2005)
3 THEORETICAL BACKGROUND
3.1 Smart Transportation Definition
Smart Transportation can be defined as transportation
model that utilizes wireless technology automatically
so as to facilitate and increase comfort for passen-
gers and drivers in their mobilization activities. In-
creased safety and efficiency factors are concern in an
intelligent transportation system (Pindarwati and Wi-
jayanto, 2015).
Previous research has proposed a framework for
intelligent transportation needs. There are 3 layers
needed for intelligent transportation, namely (1)input
layer, (2)storage layer, (3)analysis layer and commu-
nication layer (Shukla et al., 2016).
This is to answer transportation problems that are
common in big cities, such as: congestion, difficulties
in parking locations, length of travel due to conges-
tion, inadequate public transportation and disruption
of distribution (Pedersen, 2016).
Previous challenges emerged in the development
of smart transportation such as the availability of good
CONRIST 2019 - International Conferences on Information System and Technology
200

communication / data lines, the provision of accurate
information and adequate electronic devices began to
be overcome with the development of IoT and Cloud
Computing (Yang et al., 2016)
3.2 Smart Transportation Measurement
Smart Transportation Measurement The model of
smart transportation calculation uses an analysis of
the availability of transportation services to provide
solutions to transportation problems. There are 6 cat-
egories with each of the 3 domains analyzed (Pindar-
wati and Wijayanto, 2015) (Debnath et al., 2014) :
a Categories: Process and control, heal, prevent,
Sense, Predict, Communicate
b Domain: Public, Private, Commercial and Emer-
gency
Another concept mentions, the need for the fol-
lowing factors as important things that need to be
measured in assessing smart transportation systems
in a city, namely: (1)mobile services, (2)the creation
of operational efficiency of transportation services,
(3)availability of information for users, and diversity
payment model. Other supporting factors that also
need to be addressed are (1)the availability of park-
ing systems, (2)lighting systems, (3)car services and
(4)electricity-based refueling and (5)management of
transportation assets (Pedersen, 2016).
3.3 Jakarta Transportation Systems
Jakarta has an area of 740.28 square kilometers with
a population of around 10.27 million people in early
of 2018, on these working days this number has in-
creased due to the arrival of workers from other cities
such as Bekasi, Tangerang, Bogor and Depok. This
growth has resulted changes in land use often not
in accordance with urban planning and lack of pub-
lic services for urban infrastructure needs (Katadata,
2018) Along with the improvement of road infras-
tructure, economic growth and people’s income, the
number of vehicles has increased (of Economic and
Affairs, 2017). Based on data from the Jakarta Trans-
portation Agency, the ratio number of private vehicles
and public ransport vehicles is 98% and 2%. Various
efforts have been made by the provincial government
of DKI Jakarta to deal with the problems of the cap-
ital city of Indonesia such as: the provision of public
transportation (TransJakarta Bus, LRT, MRT), traffic
engineering (regulation of odd-even vehicle numbers,
restrictions on vehicle types).
3.4 Smart City Definition
Many definitions of smart city have emerged, pre-
vious research defines Smart city as a city with the
ability to monitor, integrate the conditions of in-
frastructure including roads, land transportation, sea
transportation, communications, electricity, water and
buildings including buildings so that resources be-
come more optimal includes monitoring security as-
pects as part of the maximum service to citizens
(Madakam, 2016). As part of implementation and
realization of Smart city, there are 6 characteristics
need to be available in the city, namely: Smart Econ-
omy, Smart Environment, Smart Governance, Smart
Living, Smart Mobility and Smart People (Purnomo
et al., 2016).
3.5 IT Balance Scorecard Definition
The IT Balance Scorecard governance was developed
to assess how well the organization carries out IT
governance. IT Balance Scorecard governance is not
only done as a measurement system for IT governance
processes, but also can show a cause and effect rela-
tionship between perspectives (Jairak and Praneetpol-
grang, 2013).
The framework from IT Balance Scorecard can
describe in figure 1 while, first the corporate contri-
bution perspective measures the performance of IT
governance processes for ensuring that business can
achieve maximum profit from IT while reducing risk
at a reasonable point. Second, the stakeholder per-
spective are to measure stakeholder satisfaction, man-
agement of stakeholder needs, and legal/ethical com-
pliance. Third, the operation excellence perspective
identifies the maturity of IT governance structures and
processes. Lastly, the future orientation perspective is
designed to measure the foundations of skills, knowl-
edge, and IT/business partnership for IT governance
delivery (Van Grembergen and De Haes, 2005).
Figure 1: IT Balance Scorecard (Van Grembergen and
De Haes, 2005)
4 METHODOLOGY
The method used in this paper is a literature review,
as well as making measurements using the IT Bal-
Model Development of Smart Transportation using the Performance Measurement of Smart City Result with It Balance Scorecard and IPA
Matrix: Jakarta Case
201
ance Scorecard and intensive literature comparison
conducted in Indonesia which is specifically carried
out in other big cities to see the characteristics of the
region, transportation infrastructure and types of ve-
hicles to suit the conditions of the city of Jakarta .
The initial stage done by providing data and infor-
mation about the area, transportation, accident rates
etc. Then transportation intelligence is valued from
all cities and then compared. Intelligence indicators
were adapted from a journal published by (Debnath
et al., 2014) which is the basis for research prepara-
tion as well as a benchmarking framework and better
development related to a smart and safe transportation
system. Data, transportation and infrastructure areas
were obtained from the Indonesian Central Bureau of
Statistics.
Data collection given to 200 respondents to
Jakarta community which assessment using a Likert
scale and also self-measurement using matrix impor-
tant approaches and performance analysis by (Mar-
tilla and James, 1977) which measurements focus on
how important and the level of achievement related to
implementation.
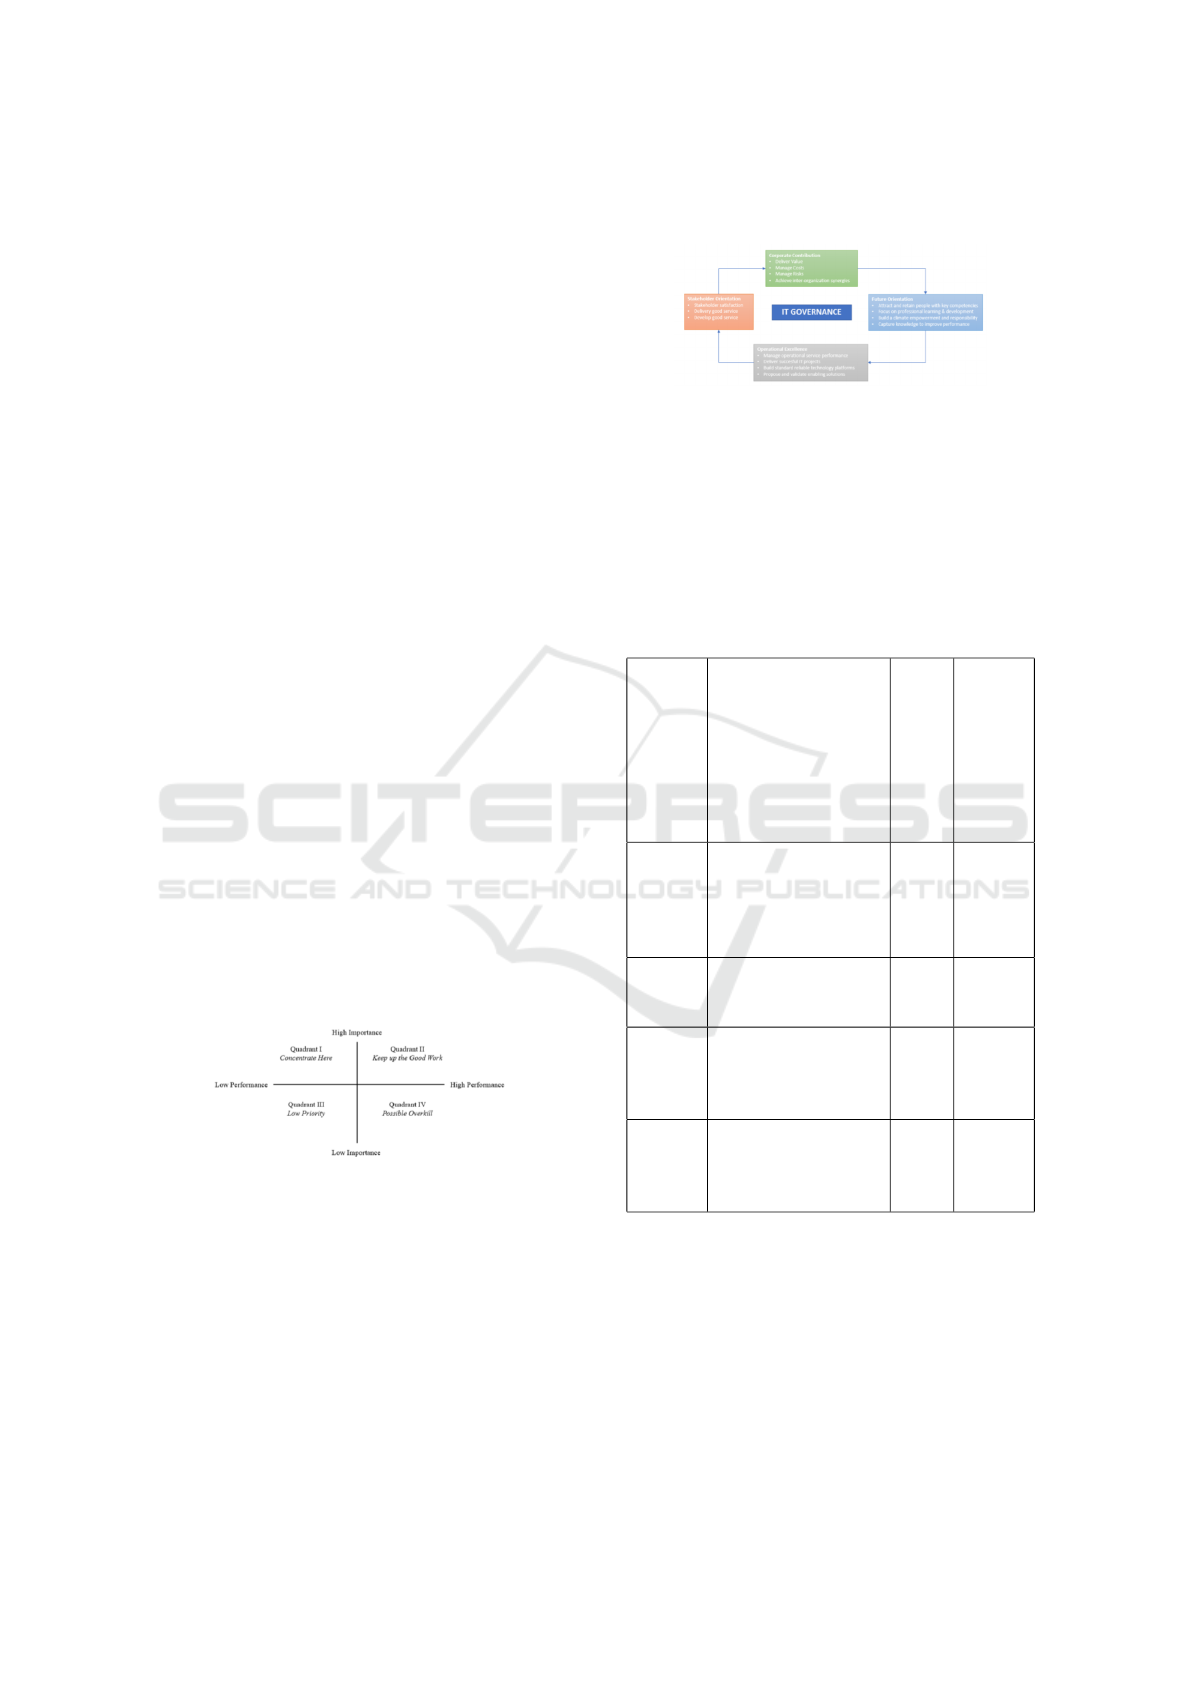
In figure 2, Quadrant I is ”concentrate here”, the
valuation of this attribute is an important part but
low performance is identified, the improvement ef-
fort must be focused on this quadrant. Quadrant II
is ”Keep up the Good Work”, valuation which means
very important and indicates that achievement has
been very good, which has been well implemented
and the organization is able to maintain its perfor-
mance. Quadrant III is labeled ”low priority”, where
the assessment in this quadrant is considered as a low
or not important enough interest. Quadrant IV is la-
beled ”possible overkill”, in this quadrant it is not too
interested but has a relatively high performance.
Figure 2: Important and Performance Analysis (Martilla
and James, 1977)
Likert scale to measure the importance of starting
from a scale of 1 to 3, namely: 1 = not important; 2 =
important; 3 = very important, while measuring per-
formance starts from a scale of 1 to 3, namely: 1 = not
monitoring; 2 = monitoring; 3 = always monitoring.
In this study, the authors used an instrument
adopted in (Abu-Musa, 2007) study where out of the
23 instruments in this study only used 15 instruments
which were divided into 4 BSC IT perspectives where
the authors considered according to the conditions of
smart city implementation in Jakarta as present in fig.
3.
Figure 3: The Instruments of Measurement of IT BSC
(Abu-Musa, 2007)
5 DATA ANALYSIS & RESULTS
The next study continued with evaluating using the IT
BSC on the implementation of smart cities where the
evaluation results are as follows:
Table 2: Cronbrach Reliability Scale
Const
ruct
Item Cronb
ach’s
a
(Im-
por-
tant
as-
pect)
Cronb
ach’s a
(Per-
for-
mance
aspect)
Corpor
ate
Con-
tribu-
tion
CC1;CC2;CC3;CC4 0.811 0.902
Future
Orien-
tation
FO1;FO2;FO3;FO4 0.765 0.873
Stakeho
lder
Orien-
tation
SO1;SO2;SO3 0.881 0.852
Operati
onal
Excel-
lence
OE1;OE2;OE3;OE4 0.745 0.872
The T test done by check the reliability of each
item of each construct. In table 2 the results of the test
show that Cronbach test results show a value above
0.70 where it can be concluded that the items tested
have a reliable value.
The next test result is to identify significantly be-
tween importance and performance. In figure 3, the
test results show that the respondent’s results show
the distribution in each quadrant. The Importance and
CONRIST 2019 - International Conferences on Information System and Technology
202
Performance Matrix shows that: quadrant I shows at-
tributes that need to be improved; quadrant II informs
the point that the organization has worked well and
needs to maintain its quality; quadrant III shows low
priority priorities and organizations usually limit re-
sources in quadrant III; quadrant IV focuses on opti-
mal use of resources including the re-establishment of
policies in an organization.
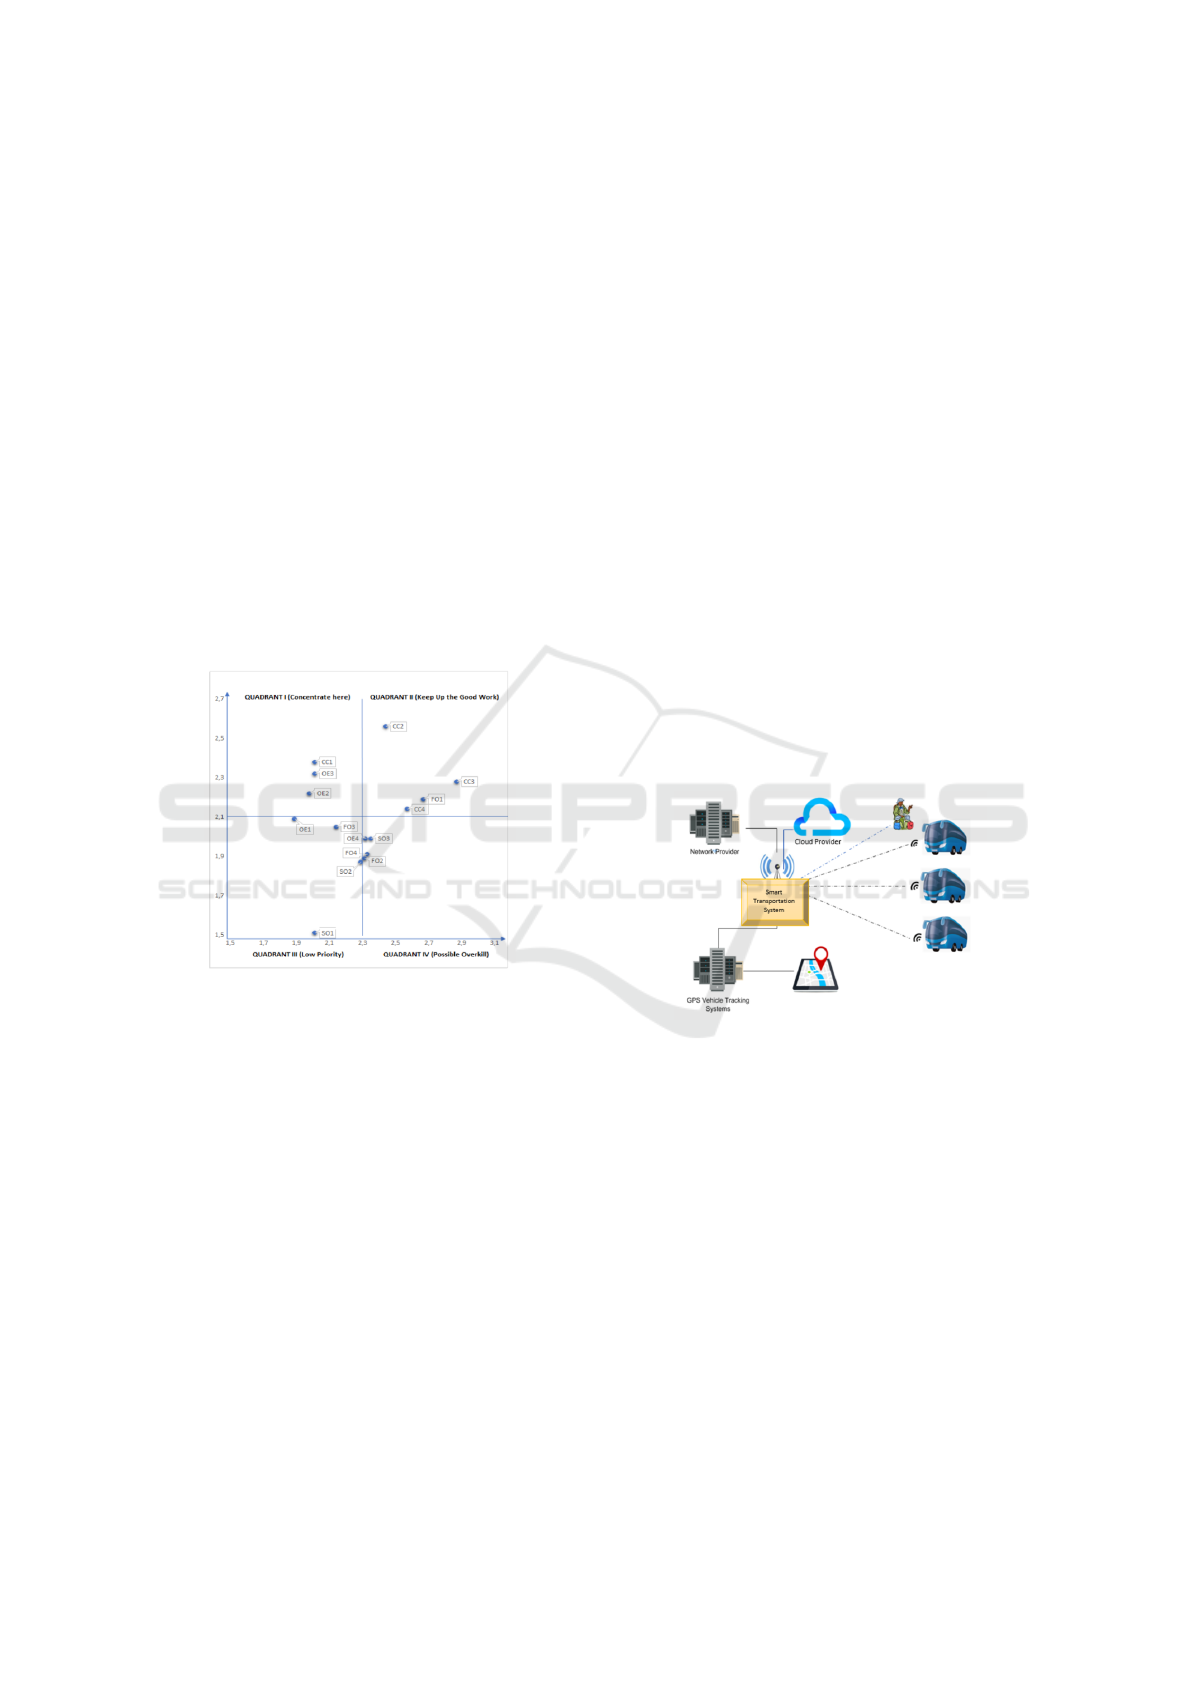
The next test result is identify significantly be-
tween importance and performance. In figure 4, the
test results show that the respondent’s results show
the distribution in each quadrant. The Importance and
Performance Matrix shows that: quadrant I shows at-
tributes that need to be improved; quadrant II informs
the point that the organization has worked well and
needs to maintain its quality; quadrant III shows low
priority priorities and organizations usually limit re-
sources in quadrant III; quadrant IV focuses on opti-
mal use of resources including the reestablishment of
policies in an organization.
Figure 4: Result of IT BSC based on Important and Perfor-
mance Analysis Matrix
In Quadrant I, there are 3 instruments namely
Deliver Value; Manage operational service perfor-
mance; Deliver successful IT projects. This indicates
that performance measurement has not yet been car-
ried out properly, especially in the 3 instruments. In
Quadrant II there are 4 instruments, namely Man-
age Costs; Manage Risks; Attract and retain peo-
ple with key competencies; Achieve interorganization
synergies are in good performance but quality must
be maintained to be even better. In Quadrant III
there are 6 instruments, namely Manage operational
service performance; Build a climate empowerment
and responsibility; Propose and validate enabling so-
lutions; Capture knowledge to improve performance;
Delivery good service; Stakeholder satisfaction which
is included in the ”low priority” category where the
organization will usually limit resources to maintain
the quadrant, further a brief interview with respon-
dents is informed that if this is possible if the instru-
ments in quadrant I are carried out in good condi-
tion then all quadrant III instruments will be automati-
cally has good results even with minimal supervision.
In Quadrant IV there are 2 instruments, namely de-
velop good service and focus on professional learning
& development where in this quadrant it is indicated
that there is a need for further policies or improve-
ment of policies, as well as more optimal use of hu-
man resources.
6 PROPOSED MODEL OF SMART
TRANSPORTATION
Based on analytical data from the Central Statistics
Agency, it is known that in Jakarta specifically there
is a transport fleet with a total of around 45,902 whose
growth decreased 2.08% over the previous year. And
based on the results of the Balance Scorecard IT test
related to the implementation of smart city where the
main focus on the instrument in quadrant I is: Deliver
Value; Manage operational service performance; De-
liver successful IT projects proposed the smart trans-
portation model as follows:
Figure 5: Smart Transportation Purposed Model
Sukhla’s (2016) research has proposed a Smart
Transportation system architecture, which consists of
four layers, namely the input layer, storage layer,
analysis layer and the last communication layer. The
model, we propose is a further development of the
architecture. As illustrated in Figure 5, the process
starts from the first layer which is the basic part that
collects all the information entered through several in-
put devices such as: CCTV, RFID, and GPS Vehicle
Tracking System. All of the following input data will
be collected into storage media and processed through
database. The results obtained from this analysis pro-
cess is information according to the needs of the pas-
sengers and the bus managers including the drivers
inside. Intensive communication in the form of infor-
mation requests from buses that operate into data stor-
age, makes this model continue to grow in informa-
Model Development of Smart Transportation using the Performance Measurement of Smart City Result with It Balance Scorecard and IPA
Matrix: Jakarta Case
203

tion and data processing. And in the end the system
can be smart to answer each question or request infor-
mation with accurate data in real time. The commu-
nication media used utilize the network provided by
the network providers in the area, so as to reduce the
investment costs of the implementation of this model.
The use of cloud computing technology and big ana-
lytic data is needed especially in the data storage and
processing.
In detail, to clarify the model proposed, figure 6
illustrates the use case of the main functions that ex-
ist in the proposed smart transportation model. The
first activity is carried out by the system admin who
fills out the initial data in the form of: Daily route
transportation, route tracking, position tracking, sta-
tus checking. Notifications will be sent automatically
when data changes occur. Passenger and driver can
request information such as transportation tracking,
status trip updates, daily route and vehicle condition
information especially for drivers. Every incoming
data is processed by the system, so that if a danger-
ous condition occurs, it can be avoided, because the
system has given a warning / notification first.
Figure 6: Use Case of Smart Transportation Function
7 CONCLUSIONS
According to the development of the Smart City con-
cept that is increasing, transportation problems are
also become a special concern. Based on the re-
sults of data analysis from 200 respondents, using the
IT Balance Scored Card and Importance and Perfor-
mance Analysis matrix approaches it is known that
there are three major problems that need to be ad-
dressed immediately, namely: Deliver Value; Manage
operational service performance; Deliver successful
IT projects. If this problem can be handled prop-
erly, then the problems in other quadrants can also
increase. The purposed smart transportation model,
as a form of improvement in quadrant one, has been
adjusted to the availability of infrastructure and avail-
ability of facilities in the city of Jakarta. With limited
coverage in this study specializing in public trans-
portation facilities in the city of Jakarta, further re-
search can be done by adding data from private trans-
portation modes and other types of vehicles, as well
as adding data from other cities. Application devel-
opment from this model can also be used as further
research, so that it can be directly useful to reduce the
number of accidents.
REFERENCES
Abu-Musa, A. A. (2007). Exploring information technol-
ogy governance (itg) in developing countries: an em-
pirical study. The International Journal of Digital Ac-
counting Research, 7(13):71–117.
Debnath, A. K., Chin, H. C., Haque, M. M., and Yuen, B.
(2014). A methodological framework for benchmark-
ing smart transport cities. Cities, 37:47–56.
Dirgahayani, P. (2013). Environmental co-benefits of pub-
lic transportation improvement initiative: the case of
trans-jogja bus system in yogyakarta, indonesia. Jour-
nal of cleaner production, 58:74–81.
Effendi, D., Syukri, F., Subiyanto, A. F., and Utdityasan,
R. N. (2016). Smart city nusantara development
through the application of penta helix model (a prac-
tical study to develop smart city based on local wis-
dom). In 2016 international conference on ICT for
Smart Society (ICISS), pages 80–85. IEEE.
Jairak, K. and Praneetpolgrang, P. (2013). Applying
it governance balanced scorecard and importance-
performance analysis for providing it governance
strategy in university. Information Management &
Computer Security.
Katadata (2018). Jumlah penduduk di jakarta.
Madakam, S. (2016). Smart cities ( egovernance* smart
governance).
Martilla, J. A. and James, J. C. (1977). Importance-
performance analysis. Journal of marketing,
41(1):77–79.
of Economic, U. N. D. and Affairs, S. (2017). World popu-
lation prospects: The 2017 revision, key findings and
advance table.
Pedersen, N. (2016). Smart transportation in a smart city.
Pindarwati, A. and Wijayanto, A. W. (2015). Measuring
performance level of smart transportation system in
big cities of indonesia comparative study: Jakarta,
bandung, medan, surabaya, and makassar. In 2015
International Conference on Information Technology
Systems and Innovation (ICITSI), pages 1–6. IEEE.
Purnomo, F., Prabowo, H., et al. (2016). Smart city in-
dicators: A systematic literature review. Journal of
Telecommunication, Electronic and Computer Engi-
neering (JTEC), 8(3):161–164.
Shukla, S., Balachandran, K., and Sumitha, V. (2016). A
framework for smart transportation using big data. In
CONRIST 2019 - International Conferences on Information System and Technology
204

2016 International Conference on ICT in Business In-
dustry & Government (ICTBIG), pages 1–3. IEEE.
Van Grembergen, W. and De Haes, S. (2005). Measur-
ing and improving it governance through the bal-
anced scorecard. Information systems control Journal,
2(1):35–42.
Wen, W. (2010). An intelligent traffic management expert
system with rfid technology. Expert Systems with Ap-
plications, 37(4):3024–3035.
Wibowo, A. A. and Suryanegara, M. (2016). On developing
the model of smart logistic transport in indonesia. In
2016 IEEE International Conference on Management
of Innovation and Technology (ICMIT), pages 99–104.
IEEE.
Yang, J., Xu, R., Cui, J., and Ding, Z. (2016). Robust vi-
sual tracking using adaptive local appearance model
for smart transportation. Multimedia Tools and Appli-
cations, 75(24):17487–17500.
Model Development of Smart Transportation using the Performance Measurement of Smart City Result with It Balance Scorecard and IPA
Matrix: Jakarta Case
205
