
Forecasting Medicine Purchase Budget using Multiple Linear Regression
Method: Case Study - For Ende Regency Health Office
Marianus Angelo Dasi Muda
1
, Achmad Affandi
1
and Yoyon Kusnendar Suprapto
1
1
Department of Electrical Engineering Institut Teknologi Sepuluh Nopember
Keywords:
planning, budgeting, forecasting, medicine, multiple linear regression, public health center, R square,
Adjusted R Square, MAD, MSE, MAPE.
Abstract:
In planning and budgeting for medicine purchases for the Ende regency health office, the pattern used is the
pattern of medicine consumption and epidemiological patterns, which are supported by the existing budget
and based on the medicine needs plan. This research focuses on forecasting the medicine budget based on the
real use of medicines in 24 Ende regency public health centers. The use of multiple linear regression methods
has a significant impact because there are other variables that also influence the budget. The 24 public health
centers are divided into 3 categories namely for public health center city category, the results of the correlation
R, R square and Adjusted R Square are 0.941, 0.886 and 0.871, MAD is 2560360, MSE is 10157921086788,
MAPE is 5.73%, public health center outside the city and mountainous regions category, the results of the
correlation R, R square and Adjusted R Square values are 0.793, 0.630 and 0.582, MAD is 5756562, MSE
is 54447250606455, MAPE is 6.84% and public health center outside the city and coastal areas categories,
the results of the correlation R, R square and Adjusted R Square values are 0.873, 0.762 and 0.731, MAD is
5315655, MSE is 61576610175327, MAPE is 9.16%.
1 INTRODUCTION
The existence of health facilities is one of the de-
terminants of the health status of a country. Health
care facilities are one of the tools and / or places
that are used to carry out health service efforts ei-
ther promotive, preventive, curative or rehabilitation
carried out by the central government, regional gov-
ernment and / or the community. The Public health
center is a health service facility that organizes the
first level of Public Health and Health Efforts, pri-
oritizing promotive and preventive efforts to achieve
the highest degree of public health in its working area
in order to support the realization of healthy districts.
One of the main programs at the Public health center
is a treatment or curative program. In fulfilling the
health status of the people served by the public health
center, medicines are one of the irreplaceable com-
ponents. Access to medicines, especially essential
medicines, is one of the human rights. The availabil-
ity of medicines in the health services unit greatly af-
fects the quality of health services. Therefore it is nec-
essary to have good medicine management that aims
to ensure the continuity and affordability of medicine
services that are efficient, effective and rational. The
process of medicine management consists of several
stages, namely the planning stage, the procurement
phase, the distribution phase and the use phase
Discussion of existing papers that are the refer-
ences of scientific writing : Analysis of medicine
needs in the Medicine Requirement Plan based on
the Use Report and Medicine Request Sheet , bud-
get. The result can reduce the average medicine sup-
ply to 93%(Rumbay, 2015) as well as representa-
tive and accountable studies (Anumerta and Mahen-
drawati, 2013).
The method for estimating the medicine needs
is the consumption method and epidemiological
method, based on the data sheet for the procure-
ment of medicines (Safriantini et al., 2011) and uses
SDLC systems development method (System Devel-
opment Live Cycle)(Rahmawatie and Santosa, 2015).
This study uses independent variables of research,
namely doctors, pharmacists and patients. The value
sought is the availability of medicines. By using
linear regression. R2 and F Test results are 0.971
and 293,447(Prabowo and Satibi, 2016). A combi-
nation of artificial neural networks and multivariable
linear regression analysis can show reasonable pre-
dictive accuracy for accurate electricity consumption
186
Muda, M., Affandi, A. and Suprapto, Y.
Forecasting Medicine Purchase Budget using Multiple Linear Regression Method: Case Study - For Ende Regency Health Office.
DOI: 10.5220/0009880501860192
In Proceedings of the 2nd International Conference on Applied Science, Engineering and Social Sciences (ICASESS 2019), pages 186-192
ISBN: 978-989-758-452-7
Copyright
c
2020 by SCITEPRESS – Science and Technology Publications, Lda. All rights reserved

and minimum costs for electricity generation in In-
donesia(Jaisumroum and Teeravaraprug, 2017).This
paper writes about utilizing a multi-variable linear re-
gression analysis method to evaluate the level of use
of IoT based on evaluating the quality of IoT expe-
riences with 90% accuracy(Li et al., 2015). This pa-
per describes the use of a multi-variable regression
liner method to analyze the use of electric loads for
24 hours (a day) in the dry and rainy season in South
Sulawesi, this analysis reaches the MAPE analysis,
with the MAPE in the dry season which is 3, 52%,
the MAPE in the rainy season is 4.34% by displaying
each curve.(Amral et al., 2007). This paper explains
the important points in estimating gold prices with
multiple linear regression methods, This research was
continued by obtaining a predictive value with RMSE
of 53,583, using a confidence level of 95% or α =
0,05(Sekar et al., 2017). This paper describes the
use of a multiple linear regression method to build a
QSAR linear peptide model with leave-one-out cross-
ing validation. The result of the discussion is the
multiple correlation coefficient (R2) which is 0.991
and RMSE value for the estimated error is 0.062(Yin,
2011).
Therefore, in this paper discusses medicine bud-
get forecasting using multiple linear regression meth-
ods with new features namely prescription, type
medicine, total medicine, population density with a
high accuracy of 95% or 5% error, which are divided
into three categories of public health center in Ende
regency : 1. City public health center category, 2.
Public health centers outside the city and mountain-
ous regions category, and 3. Public health centers
outside the city and coastal areas categories. This
research uses data mining for 24 public health cen-
ter, 54 auxiliary public health center (pustu), 73 vil-
lage health posts (poskesdes) and 75 village delivery
posts (polindes). The prescription describes patients
who get health services in the form of medicines from
pharmacies, the type of medicine describes the aver-
age medicine used in the three categories of health
centers. Total medicine usage describes the over-
all medicine used and population density is obtained
from the average total population divided by the area
in the three categories. The number of residents is re-
lated to the budget for medicine per person and the
area in relation to the range of services available. By
getting a correlation between the four independent
variables and other statistical tests, it can be deter-
mined the predicted value of medicine purchases for
the ende regency health office.
2 FUNDAMENTAL THEORY
Ende Regency has 21 districts and 24 public health
centers, of which those 24 Public health centers are
divided into three (3) categories, namely the city cat-
egory, outside the city and mountainous regions and
outside the city and coastal areas :
City public health center category : It is located
in the regency capital area with a high average pop-
ulation and population density, heterogeneous in all
aspects (education, economic, religious level), with
coverage to adequate health facilities. They are ende
city, kotaratu, onekore, rewarangga and rukunlima.
Public health centers outside the city and mountain-
ous regions category : It is located in areas outside
the city and on mountains with a population which is
not too much and the reach to health facilities is very
limited, public health centers are near the market, the
average height is 500 -1500 meters above sea level
and temperature on average is 10
◦
C - 20
◦
C. They are
located in detusoko, kelimutu, kotabaru, ndetundora,
peibenga, riaraja, roga, saga, watuneso, watunggere,
welamosa, wolojita and wolowaru. Public health cen-
ters outside the city and coastal areas categories: It
is in areas outside the city and coastal areas and low-
lands with a population that is not too much and the
reach to health facilities is very limited, public health
centers are near the market, the average height is 0 -
500 meters above sea level and the average tempera-
ture is 22
◦
C - 30
◦
C. Those are included in this cat-
egory are ahmad yani, maubasa, maukaro, maurole,
nangapanda and ngalupolo.
Based on the initial data mining used for depen-
dent variables and independent variables namely : Y
value : public health center medicine budget : a total
of medicine data based on medicine use and medicine
prices, X1: prescription: the total prescription data
originating from the concerned pharmacy clinic, X2:
total average type of medicine used, X3: total cumu-
lative value of medicine use, X4: population density
data,
Forecasting Medicine Purchase Budget using Multiple Linear Regression Method: Case Study - For Ende Regency Health Office
187
The initial data mining for the category of city
public health center in the city category can be seen
in Figure 1.
Figure 1: City area data correlation variables.
3 METHODOLOGY
The discussion in chapter 3 is divided into two (2)
important parts, namely the flow of research and the
formulation of multiple linear regression.
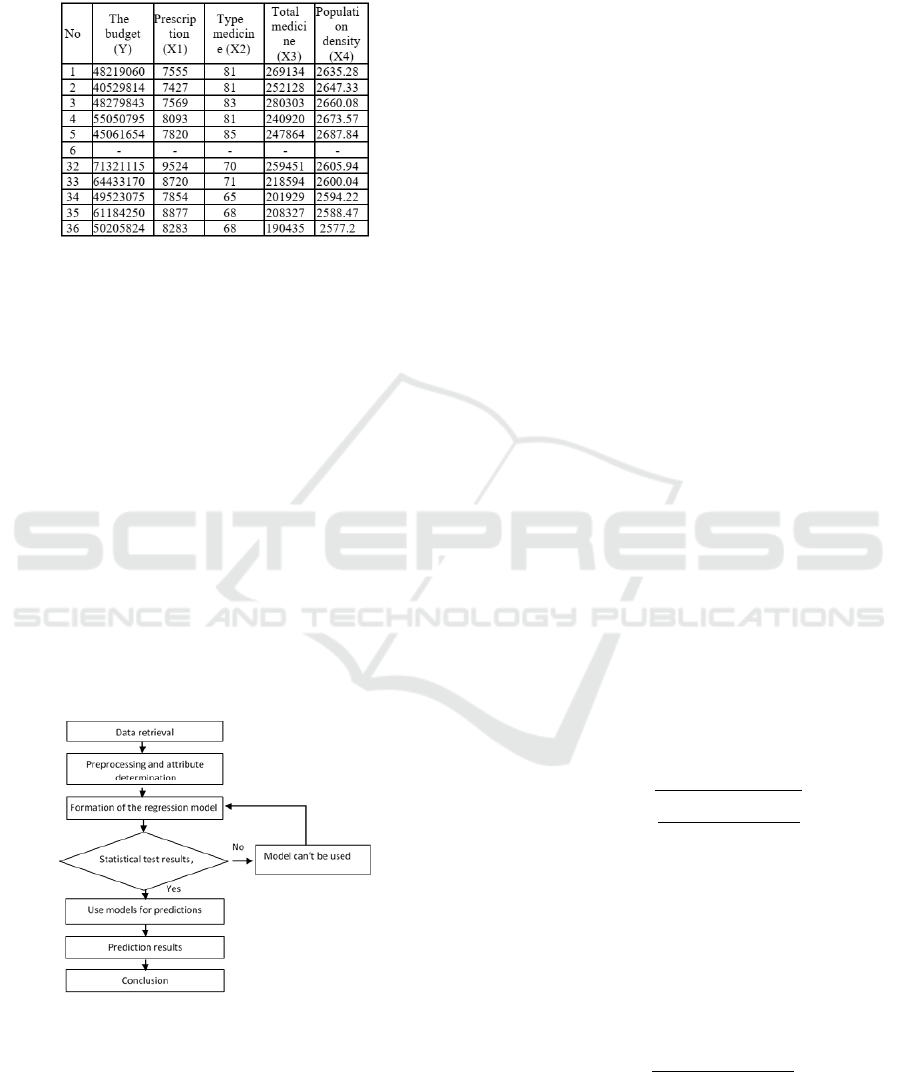
3.1 Flow of Research
This study was divided into several stages, namely
data retrieval, preprocessing, weighting, classifica-
tion, evaluation and representation in the form of
real data on medicine use, prescriptions, types of
medicines, medicine prices per usage, and population
density, which formed the variables used in multiple
linear regression. The research methodological flow
chart can be seen in Figure 2.
Figure 2: Research flow.
• Data retrieval stage. Retrieving raw data for
medicines and prescriptions on 24 Public health
centers in the Ende regency.
• Preprocessing and attribute determination stage..
• Formation of the regression model stage.
• Statistical test results and analysis stage. Stages
are carried out in accordance with statistical rules
with a confidence level of 95% or α = 0.05 cor-
relation test, T test, F test, correlation coefficient
test, multi collinearity test (VIF), autocorrelation
test (Durbin-Watson test), make the best equation
for multiple linear regression.
• Use models for predictions. Perform R test, R
Square, Adjusted R Square, MAPE
3.2 Multiple Linear Regression
Multiple linear regression is a regression analysis that
explains the relationship between dependent variables
and factors that affect more than one independent
variable (free). The purpose of multiple linear regres-
sion analysis is to measure the intensity of the rela-
tionship between two or more variables, contain pre-
dictions of the value of Y based on the value of X.
Stages in multiple linear regression :
a The form of the regression equation, can be seen
in equations (1) to look for projection or predic-
tive values according to the coefficients that refer
to equations (2).
Y = β
0
+ β
1
X
1
+ β
2
X
2
+ ... + β
n
X
n
+ ε (1)
matrix form y = x β
Y
−
= β
0
+ β
1
X
1
+ β
2
X
2
+ ... + β
n
X
n
(2)
b Correlation coefficient
Correlation is a term used to measure the strength
of relationships between variables, the equation
can be seen in equation (3)
R =
s
β1Σx1y + β2Σx2y
Σy2
(3)
c Coefficient of Determination
Multiple regression testing which includes more
than two variables to find out the proportion of to-
tal diversity in the independent variable Y can be
explained by dependents (X) which are in multi-
ple regression equation models together and can
be seen in the equation (4).
R
2
=
β1Σx1y + β2Σx2y
Σy2
(4)
d Partially and Multiple Regression Test
The t test is used to partially test each variable.
The t test refers to equation (5)
ICASESS 2019 - International Conference on Applied Science, Engineering and Social Science
188
T =
r
√
n −2
√
1 −r
2
(5)
The f test multiple regression needs to be done
to find out whether a group of independent vari-
ables simultaneously have an influence on depen-
dent variables. f statistics is used and can be seen
in equation (6).
F =
r
2
(n −m −1)
m(1 −r
2
)
(6)
e Multycollenirity and autocorrelation test.
Multicollinearity test and autocorrelation test can
be seen in the equation (7) and (8).
V IF =
1
1 −R
2
i
(7)
D =
Σ
n
t=2
(e
t
−e
(t−1)
)
2
Σ
n
t=1
et
2
(8)
f Performance criteria
Mean Absolute Deviation (MAD), Mean Square
Error (MSE), Mean Absolute Percentage Error
(MAPE), in comparing the optimal performance
of a prediction can be calculated based on equa-
tion (9), (10),(11),
MAD =
Σ
n
k=1
(yr −y f )
2
n
(9)
MSE =
1
n
Σ
n
k=1
(yr −y f )
2
(10)
MAPE = 100x
Σ
n
k=1
|
yr−y f
yr
|
n
(11)
Where : y,y1,y2,yn are dependent variables. β
0
, β
1
, β
n
, β
m
are the intercept parameter and the
independent variable regression coefficient. X1 ,
X2, Xn are dependent variables.
ε is an error variable. Y
−
, Y1
−
, Y2
−
, Yn
−
are the
predicted value of the dependent variables sought.
n, k are amount of data, m is number of variables,
yr is experiment value, yf is predictive value.
4 RESULT AND DISCUSSION
By using the forecasting method using multiple linear
regression, OLS (Ordinary Least Square) enter with
the Simple Seasonal, Winters’ Additive, Arima the
model that meets the statistical requirements is ob-
tained.:
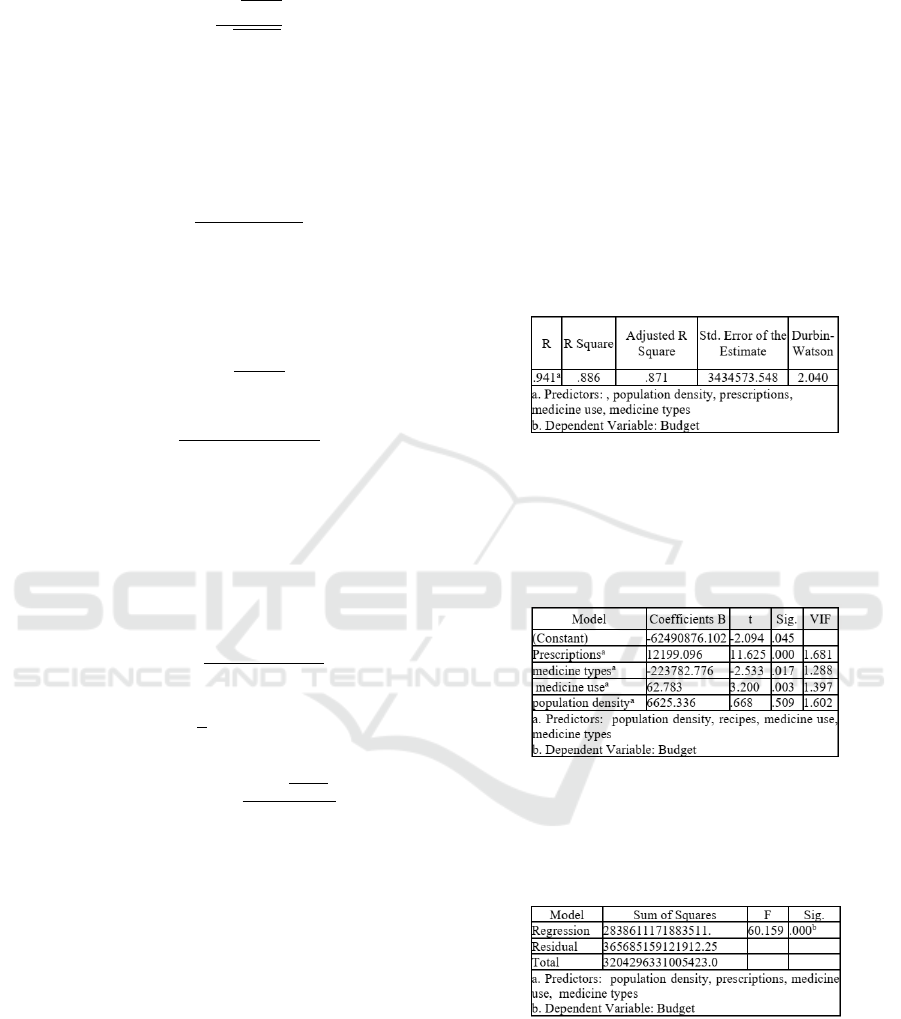
4.1 Public Health Center City Category
• Value R, R Square, adjusted R Square, Durbin
Watson. Correlation (R) simultaneously (to-
gether) between prescription variables (X1),
medicine types (X2), medicine use (X3) and
population density (X4) on medicine budget (Y)
of 0.941 and correlation coefficient (R square)
amounting to 88.6 % and free autocorrelation test
because the value of Dubin Watson 2.040 meets
the existing conditions, where D > dl and 4-D
> du, dl = 1.2953. du = 1.65387, then 2,040 >
1.2953 and 1.96 > 1.65387, can be seen in the
Figure 3.
Figure 3: Value of simultan correlation.
• The value of the regression constant, the standard
error, the value of t > t table (2.04), the sig value
< 0.05, fulfills some of the existing equations and
the collinearity / VIP test is fulfilled because the
VIF value is < 10, it can be seen in Figure 4.
Figure 4: Value of partial correlation.
• Test the value of Value f is fulfilled because the
value of f results > f table (60.159 > 2.67), the
value of sig is fulfilled with a value of 0.000.
There can be seen in Figure 5.
Figure 5: Value of performance criteria.
• The regression equation can be seen in equation
(12), based on the value B in Figure 4.
Y = −62490876.102 + 12199.096.X1−
223782.776.X2 + 62.783.X3+
6625.336.X4 (12)
Forecasting Medicine Purchase Budget using Multiple Linear Regression Method: Case Study - For Ende Regency Health Office
189
• The results of values on forecasting meet the ex-
isting standard equations : MAD is 2560360,
MSE is 10157921086788 and MAPE is 5.73%.
They based on the calculation of the comparison
formula of real values and predictive values. Ideal
error value is a small error value or close to zero.
The existing MAD, MSE and MAPE values indi-
cate that the predictive value for the multiple lin-
ear regression equation are ideal, can be seen in
the Figure 6.
Figure 6: Model fit statistics.
• Graphs of observation (y value, budget) and fit
values (predictive value) based on the value of
MAPE 5.73 % for time series data can be seen
in the Figure 7.
Figure 7: Graph of real data real and prediction data
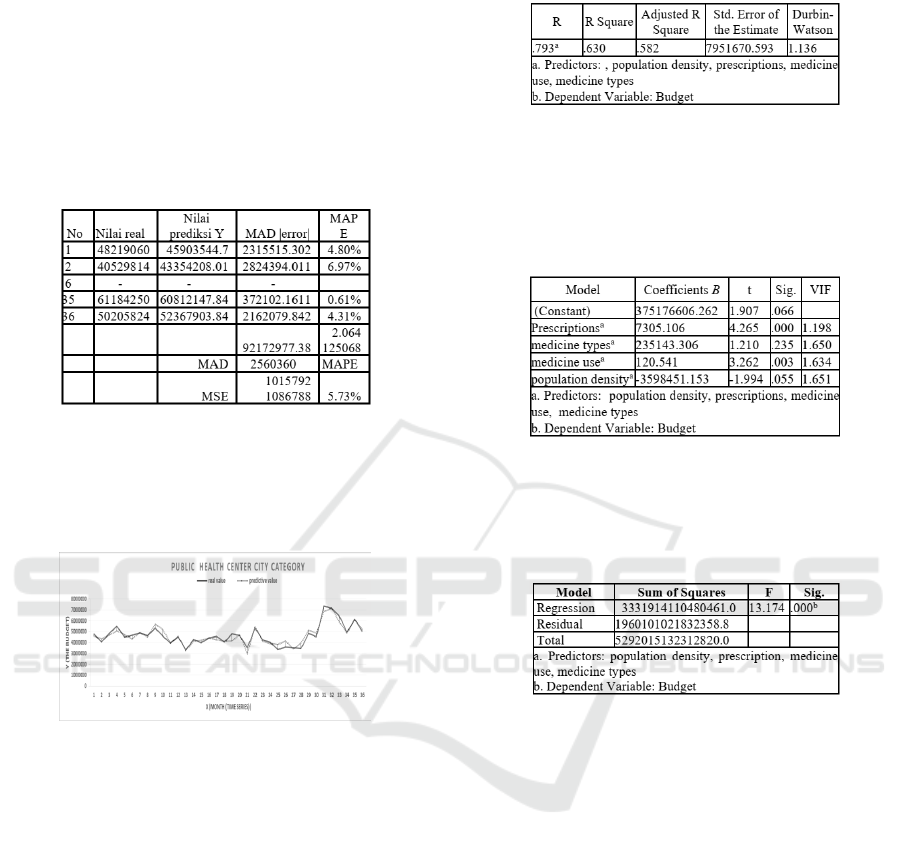
4.2 Public Health Center Outside the
City and Mountainous Regions
Category
• Value R, R Square, adjusted R Square, Durbin
Watson.
Correlation (R) simultaneously (together) be-
tween prescription variables (X1), medicine types
(X2), medicine use (X3) and population density
(X4) on medicine budget (Y) of 0.793 and cor-
relation coefficient (R square) amounting to 63%
and free autocorrelation test because the value of
Dubin Watson 1.136 meets the existing conditions
where D > dl and 4-D > du, dl = 1.2953. du
= 1.65387, then 1.136 < 1.2953 and 2.864 >
1.65387,
can be seen in the Figure 8.
Figure 8: Value of simultan correlation.
• The value of the regression constant, the standard
error, the value of t > t table (2.04), the sig value
< 0.05, fulfills some of the existing equations and
the collinearity / VIP test is fulfilled because the
VIF value is < 10, it can be seen in Figure 9.
Figure 9: Value of partial correlation.
• Test the value of Value f is fulfilled because the
value of f results > f table (13.174 > 2.67), the
value of sig is fulfilled with a value of 0.000.
There can be seen in 10.
Figure 10: Value of performance criteria.
• The regression equation can be seen in equation
(13), based on the value B in Figure 9.
Y = 375176606.262 + 7305.106.X1+
235143.306.X2 +120.541.X3−
3598451.153.X4 (13)
• The results of values on forecasting meet the ex-
isting standard equations : MAD is 5756562,
MSE is 54447250606455 and MAPE is 6.84%.
They based on the calculation of the comparison
formula of real values and predictive values. Ideal
error value is a small error value or close to zero.
ICASESS 2019 - International Conference on Applied Science, Engineering and Social Science
190
The existing MAD, MSE and MAPE values indi-
cate that the predictive value for the multiple lin-
ear regression equation are ideal, can be seen in
the Figure 11.
Figure 11: Model fit statistics.
• Graphs of observation (y value, budget) and fit
values (calculation results /predictive value) based
on the value of MAPE 6.84 % for time series data
can be seen in the Figure 12.
Figure 12: Graph of real data real and prediction data
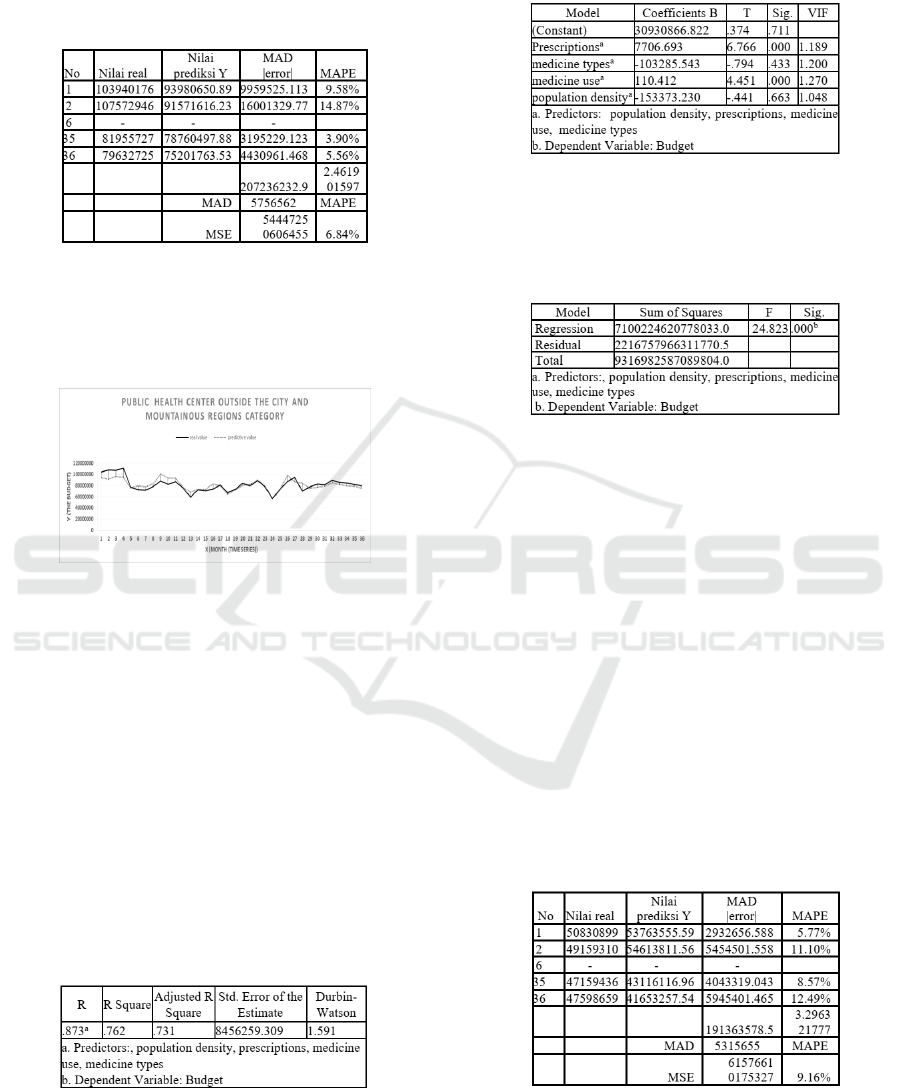
4.3 Public Health Center Outside the
City and Coastal Areas Categories
• Value R, R Square, adjusted R Square, Durbin
Watson.
Correlation (R) simultaneously (together) be-
tween prescription variables (X1), medicine types
(X2), medicine use (X3) and population density
(X4) on medicine budget (Y) of 0.873 and cor-
relation coefficient (R square) amounting to 76.2
% and free autocorrelation test because the value
of Dubin Watson 1.591 meets the existing condi-
tions, where D > dl and 4-D > du, dl = 1.2953.
du = 1.65387, then 1.591 > 1.2953 and 2.409 >
1.65387, can be seen in the Figure 13.
Figure 13: Value of simultan correlation.
• The value of the regression constant, the standard
error, the value of t > t table (2.04), the sig value
< 0.05, fulfills some of the existing equations and
the collinearity / VIP test is fulfilled because the
VIF value is< 10, can be seen in Figure 14.
Figure 14: Value of partial correlation.
• Test the value of Value f is fulfilled because the
value of f results > f table (24.823 > 2.67), the
value of sig is fulfilled with a value of 0.000.
There can be seen in Figure 15.
Figure 15: Value of performance criteria.
• The regression equation can be seen in equation
(14), based on the value B in Figure 14.
Y = 30930866.822 + 7706.693.X1−
103285.543.X2 +110.412.X3−
153373.230.X4 (14)
• The results of values on forecasting meet the ex-
isting standard equations : MAD is 5315655,
MSE is 61576610175327 and MAPE is 9.16%.
They based on the calculation of the comparison
formula of real values and predictive values. Ideal
error value is a small error value or close to zero.
The existing MAD, MSE and MAPE values indi-
cate that the predictive value for the multiple lin-
ear regression equation are ideal, can be seen in
the Figure 16.
Figure 16: Model fit statistics.
• Graphs of observation (y value, budget) and fit
values ( results / predictive value) based on the
value of MAPE 9.16 % for time series
Forecasting Medicine Purchase Budget using Multiple Linear Regression Method: Case Study - For Ende Regency Health Office
191
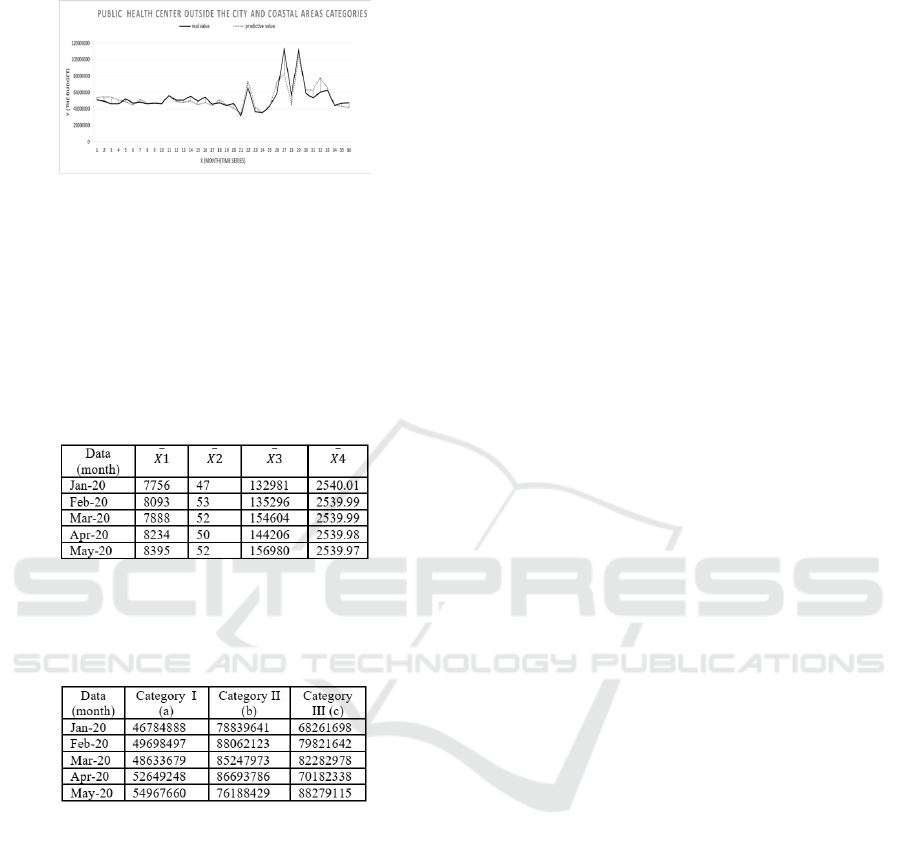
data can be seen in the Figure 17.
Figure 17: Graph of real data real and prediction data
4.4 Forecasting Results for the Public
Health Center Category
• Example forecasting value of x1, x2, x3, x4 public
health city center category can be seen in Table
14, with forecasting value for 5 months in 2020,
based on the MAPE value in Figure 2, Figure 12,
Figure 17, and on equation (12),(13) and (14).
Figure 18: Forecasting values.
• Forecasting budget values for each category can
be seen in Table 15 based on equation (12),(13)
and (14).
Figure 19: Budget forecasting values.
Where : a. Category I is forecasting of medicine
use budget for public health city center category b.
Category II is forecasting of medicine use budget
for public health center outside the city and moun-
tainous regions category c. Category III is fore-
casting of medicine use budget for public health
center outside the city and coastal areas categories
5 CONCLUSIONS
Forecasting the medicine purchase budget with four
variabel independent : X1: prescription, X2: total
average type of medicine used, X3: total cumulative
value of medicine use, X4: population density data
for public health center city category, the results of
the correlation R, R square and Adjusted R Square
are 0.941, 0.886 and 0.871, MAD is 2560360, MSE
is 10157921086788, MAPE is 5.73%, public health
center outside the city and mountainous regions cat-
egory, the results of the correlation R, R square and
Adjusted R Square values are 0.793, 0.630 and 0.582,
MAD is 5756562, MSE is 54447250606455, MAPE
is 6.84% and public health center outside the city and
coastal areas categories, the results of the correla-
tion R, R square and Adjusted R Square values are
0.873, 0.762 and 0.731, MAD is 5315655, MSE is
61576610175327, MAPE is 9.16%.
REFERENCES
Amral, N., Ozveren, C., and King, D. (2007). Short term
load forecasting using multiple linear regression. In
2007 42nd International universities power engineer-
ing conference, pages 1192–1198. IEEE.
Anumerta, L. and Mahendrawati, E. (2013). Pengembangan
sistem manajemen persediaan obat terintegrasi antar
gudang farmasi kesehatan dan puskesmas di kabu-
paten sidoarjo. In Jurnal Posiding Seminar Nasional
Manajemen Teknologi, volume 17.
Jaisumroum, N. and Teeravaraprug, J. (2017). Forecast-
ing uncertainty of thailand’s electricity consumption
compare with using artificial neural network and mul-
tiple linear regression methods. In 2017 12th IEEE
Conference on Industrial Electronics and Applica-
tions (ICIEA), pages 308–313. IEEE.
Li, L., Rong, M., and Zhang, G. (2015). An internet of
things qoe evaluation method based on multiple linear
regression analysis. In 2015 10th International Con-
ference on Computer Science & Education (ICCSE),
pages 925–928. IEEE.
Prabowo, P. and Satibi, P. G. (2016). Analysis of factors
affecting the availability of medicines at the jkn era in
rsud dr, soedono madiun. Journal of Management and
Pharmacy Practice, 6(2):213–218.
Rahmawatie, E. and Santosa, S. (2015). Sistem informasi
perencanaan pengadaan obat di dinas kesehatan kabu-
paten boyolali. Pseudocode, 2(1):45–52.
Rumbay, I. N. (2015). Analisis perencanaan obat di dinas
kesehatan kabupaten minahasa. Jikmu, 5(5).
Safriantini, D., Ainy, A., Mutahar, R., et al. (2011). Analy-
sis planning and procurement of drugs at public health
center (phc) pembina palembang. Jurnal Ilmu Kese-
hatan Masyarakat, 2(1):30–38.
Sekar, K., Srinivasan, M., Ravidiandran, K., and Sethura-
man, J. (2017). Gold price estimation using a multi
variable model. In 2017 International Conference on
Networks & Advances in Computational Technologies
(NetACT), pages 364–369. IEEE.
Yin, J. (2011). Prediction of ace inhibitor tripeptides ac-
tivity based on amino acid descriptors (e) from multi-
ple linear regression model. In 2011 5th International
Conference on Bioinformatics and Biomedical Engi-
neering.
ICASESS 2019 - International Conference on Applied Science, Engineering and Social Science
192
