
Investor Decisions with Pecking Order Theory Method: Strategy of an
Investor to Get Right Issue
I Ketut Mangku
1
, Bambang Jatmiko
2
and Titi Laras
1
1
Economic Faculty of Janabadra University, Jln. Tentara Rakyat Mataram 55-57, Yogyakarta, Indonesia
2
Economic Faculty of Muhammadiyah University, Jln.Brawijaya,Geblagan, Bantul,Yogyakarta,Indonesia
Keywords:
Investor Decision, Pecking Order, Right Issue, Operating cash flow ratio, debt to equity, Return on Assets,
Net Profit Margin, Assets turnover, Price earnings ratio.
Abstract:
The purpose of the study is: (1) to tempt and prove empirically Investor strategy on Operating Cash Flow
Ratioof company before and after right issue; (2) on Debt to Equity Ratio ; (3) on Return on Asset ; (4) on
Net Profit Margin ; (5) on Asset Turnover; (6) to tempt and prove empirically Investor strategy about Price
Earning Ratio . This study method implemented purposive sampling. The results showed : (a) there is no
difference on Operating Cash Flow Ratio between before and after right issueto performance improvement
of Cash Flow Ratio is insignificant; (b) there is no diference onDebt Equity Ratio between before and after
right issue to decreasing Debt Equity Ratio performance is insignificant; (c) there is no difference onReturn
on Asset between before and after right issue to improvement of Return on Asset performance is insignificant;
(d) there is no difference onNet Profit Margin between before and after right issue toinsignificant improved
performance; (e) there is a difference onAsset Turnover between before and after right issue to significant
decrease.
1 INTRODUCTION
Capital Market Law Number 8 Year 1995 has ex-
plained about the mechanism of trading in the capi-
tal market. According to the Decision of the Chair-
man of the Capital Market Supervisory Agency no.
KEP-26 / PM / 2003 describes Rights Issue is an ad-
ditional share capital of a company that has conducted
a Public Offering of shares or Public Company. This
capital increase activity through Preemptive Rights or
Public Offering of Warrants or Conversion Securities.
Investors will be more strategic with pecking order
theory to gain maximum profit.
Pecking Order Theory states that companies tend
to choose funding that comes from internal rather than
external companies (Ghosh, 2011) which explains
that corporate priorities have a main role in choosing
funding. The priority begins with internal funding as
the first option, if internal funding is considered less,
both companies will propose a debt.For the last op-
tion, if the debt is considered less, the company will
issue shares. issuing some shares can be done through
action one of which is a right issue. The last option
is what is the explanation of why the company should
issue a stock back or right issue.
Right issue is a right that is purposed to the current
shareholders to buy shares which will be reissued by
the company (Dewi and Rahyuda, 2014). When in-
vestors buy rights issue shares then the company get
capital for the issuance of their shares. There are sev-
eral important dates around the right issue; 1) Cum
date is the date the investor can register to earn their
right issue, 2) Ex date is the date if an investor is no
longer registered, 3) Rec date is the date of recording
and 4) Distribution date is the date of the right issue
is distributed. This theory can be explained why com-
panies are able to gain high profit with low debt. An
investor who gets the rights to a right issue should
have several options that must be done. There are
three options: (a). Use or exploit the right whereveran
investor will buy them which offered in the right is-
sue by filling out the form or purchasing mechanism
provided by the securities; (b). Sell right issue rights
wherever investors have no more rights to purchase
shares which offered by the company; (c). Investors
should ignore the right to right issue wherever this ac-
tion will result loss of rights after the distribution date
passes.
122
Mangku, I., Jatmiko, B. and Laras, T.
Investor Decisions with Pecking Order Theory Method: Strategy of an Investor to Get Right Issue.
DOI: 10.5220/0009879301220129
In Proceedings of the 2nd International Conference on Applied Science, Engineering and Social Sciences (ICASESS 2019), pages 122-129
ISBN: 978-989-758-452-7
Copyright
c
2020 by SCITEPRESS – Science and Technology Publications, Lda. All rights reserved

2 RESEARCH PROBLEMS
(Wijaya, 2015) explains the company’s financial per-
formance before and after the occurrence of corpo-
rate action by issuing a right issue, through observing
six company financial performance variables, namely:
Operating cash flow ratio (OCR), Debt to equity ratio
(DER), Return on Assets (ROA), Net profit margin
(NPM), Assets turnover (AT), and Price earnings ratio
(PER) on the Indonesia Stock Exchange, are differ-
ent. Of the 12 companies that issued a rights issue in
2011 on the Indonesia Stock Exchange, if described
in a graph of financial performance based on these
six variables, it appears that some fluctuated sharply,
some experienced changes but were not significant,
some were not so influenced by the existence of issue
rights issue.
The strategies alternative for investors in respond-
ing to the issuance of rights issues for new shares are:
(1) using the right issue to buy new shares, or (2) sell-
ing rights on the right issue, or (3) ignoring the rights
on the rights issue. The choice of an alternative strat-
egy depends on whether or not there is an improve-
ment in the company’s financial performance after the
issuance of a rights issue. Based on the results of (Wi-
jaya, 2015) research, the writer is interested in con-
ducting further research with the title ”Investor Deci-
sion with Pecking Order Theory Method: Investor’s
Strategy to Get Rights on Right Issues”
The problem formulations of this study are as fol-
lows: (1) How the Investor’s strategy with the com-
pany’s Operation Cash Flow Ratio performance be-
fore and after the rights issue; (2) How the Investor’s
strategy with the company’s Debt to Equity Ratio per-
formance before and after the rights issue; (3) How
the Investor’s strategy with Return on Asset perfor-
mance before and after the rights issue; (4) How the
Investor’s strategy towards the Net Profit Margin be-
fore and after the rights issue; (5) How the Investor’s
strategy with Asset Turnover performance before and
after the rights issue; (6) How the Investor’s strategy
with Price Earning Ratio performance before and af-
ter the rights issue.
The purposes of the study are : (1) to tempt and to
prove empirically Investor strategy on Operating Cash
Flow Ratioof company before and after right isuue;
(2) to tempt and to prove empirically Investor strat-
egy on Debt to Equity Ratio of a company before and
after right isuue; (3) to tempt and to prove empiri-
cally Investor strategy onReturn on Asset before and
after right issue; (4) to tempt and to prove empirically
Investor strategy on Net Profit Margin before and af-
ter right issue; (5) to tempt and to prove empirically
Investor strategy on Asset Turnover before and after
right issue; (6) to tempt and to prove empirically In-
vestor strategy on Price Earning Ratio before and after
right issue.
3 LITERATURE REVIEW
Pecking Order Theory: The Pecking Order The-
ory was first presented by Modigliani and Miller in
1958 (Sheikh et al., 2012). Pecking Order Theory
states that companies tend to choose funding that
comes from internal rather than external companies
(Ghosh, 2011). In this theory it is explained that there
are corporate priorities in choosing funding. The pri-
ority begins with internal funding as the first option,
then if internal funding is still considered less then the
choice of both companies is debt and the last option if
the debt is still considered less then the company will
issue shares. Issuing shares can be done through cor-
porate action one of which is a right issue. The last
option is what explains why the company is issuing
a stock back or right issue. Pecking Order Theory:
Pecking Order Theory differs from the trade-off the-
ory where in trade-off theory it is explained that com-
panies must achieve their debt targets. Target debt is
a balance target which the benefits can be taken and
debt should be balanced with the costs incurred in the
presence of such debt. One of the benefits of the debt
is to disminish taxes. However, this theory simply ex-
plains the funding needs based on the priority order
only. Therefore, there should be an explanation why
companies can have high profitability with low debt.
Company Performance: Performance is the result
of work in quality and quantity achieved by an em-
ployee in carrying out its duties in accordance with
the responsibilities that have been given (Nazaruddin
and Basuki, 2015). Quality work can be presented in
a narrative or descriptive way. The quantitative work
can be mathematically analyzed. Performance can be
interpreted as a result or output obtained from the ex-
istence of a process. The value of a process can be
seen in the performance of the process itself. Perfor-
mance appraisal requires analysis of a process. Per-
formance is either a result or a process undertaken
by the organization. There are three types of per-
formance that are: (a) Strategic performance as the
result obtained from the strategy made by corporate
managers; (b) Administrative performance relating to
the relationships among work units; (c) The opera-
tional performance of the company is related to the
effectiveness of organization in using the resources.
Performance is the result of the quality and quan-
tity achieved by a person or organization in carrying
out the responsibility given (Mangkunegara and Ha-
Investor Decisions with Pecking Order Theory Method: Strategy of an Investor to Get Right Issue
123

sibuan, 2009). Performance according to the above
definition can be interpreted that performance has two
types, namely: (a) Financial performance related to
the performance of a measurable individual or or-
ganization of economic activities that can be quan-
tified. For example comparison of sales level from
year to year; (b) Non-financial performance relates
to the performance of an individual or organization
that can not be measured by numbers. For example,
customer satisfaction over services provided by em-
ployees. In (Ediningsih and Yacobus, 2009) explained
that the performance of the company is an evaluation
of how the company is considered successful or not
in running its business. In evaluating the financial of
company performance required tool called the ratio.
Subramanyam and (Subramanyam et al., 2010) ex-
plain that there are ratios that can be used to measure
the performance of a company such as liquidity ratio,
capital structure ratio and leverage, investment rate re-
turn ratio, operating performance ratio, asset utiliza-
tion ratio, and size ratio market. Each ratio has its
own usability and interpretation.
4 HYPOTHESIS
4.1 Operating Cash Flow Ratio before
and after Right Issue
Operating cash flow is the cash flow generated from
the core activities of company (Amuzu, 2010). This
ratio shows the cash received by the company from
customers. Cash in operating cash flows is the cash
flow received from customers from the core activi-
ties of company. Each company has different core
activities. Debt payments will increase the value of
the operating cash flow ratio (Amuzu, 2010). Cash
earned from operating cash flows will not be too used
to pay off corporate debt. Operation Cash Flow Ratio
is derived from total operating cash flows divided by
total current liabilities (Subramanyam et al., 2010).
The value of the operating cash flow ratio is derived
from dividing the operating cash flow to current lia-
bilities. If the cash flow is higher, the value will be
higher. (Simanullang and Daljono, 2013) stated that a
company uses the funds obtained from the right issue
in order to reduce their debt level. If current liabili-
ties are less, the value will be high. The data is used
to calculate the cash flow ratio which is obtained in
the financial statements. Information on the operating
cash flow of the company can be obtained in the finan-
cial company statements in the cash flow statement.
Meanwhile, information on current liabilities can be
obtained in the financial of company statements in the
consolidated statements of financial position. If the
cash flow from operating activities increases then the
operating cash flow ratio will be better with a fixed
obligation record. If the right issue is used by the
company to settle the obligation, the amount of cor-
porate liabilities is reduced, the ratio will be better
with the record of operating cash flow remains. Re-
searchers have conducted international and national
online and offline journal surveys, but have not found
any research which using the ratio of cash flow oper-
ations as a measure of the financial performance of a
company doing a right issue. The theory development
of these variables uses theories derived from Subra-
manyam and (Subramanyam et al., 2010), (Amuzu,
2010). Considering the theory described by (Amuzu,
2010) and the logic of thought, hypotheses have one
direction. From the description above, it can be de-
rived hypothesis as follows;
H1: Suspected there are differences in operating
cash flow ratio before and after right issue
4.2 Differences Debt to Equity Ratio
(DERR) before and after
Distribution Date Right Issue
Debt to Equity Ratio (DER) is a ratio that measures
the capital structure of company derived from to-
tal liabilities divided by shareholder equity (Subra-
manyam et al., 2010). This ratio shows the ratio
between liabilities and corporate equity. The assets
owned by the company come from their own capital
and debt or loans. Given the Debt to Equity Ratio
(DER) ratio the proportion between capital and debt
will be seen clearly. Another theory mentions the re-
lationship between debt with the right issue. Research
conducted by (Simanullang and Daljono, 2013) states
that companies tend to use funds obtained from rights
issue activities in order to reduce the level of corpo-
rate debt. However, in practice the company not only
uses the funds from the rights issue to pay off the
debt alone, but also to conduct an expansion or buy
assets. Research conducted by (Ediningsih and Ya-
cobus, 2009) states that there are differences in Debt
to Equity Ratio (DER) before and after the Right Is-
sue. The sample used by the research is as many as
14 companies doing Right Issue. In the research the
significant value for the Debt to Equity Ratio (DER)
variable is 0.023 or below 0.05 alpha level. Research
conducted by (Simanullang and Daljono, 2013) states
that there is no significant difference of Debt to Eq-
uity Ratio (DER) before and after right issue. The
population of the study used a company listed on the
Indonesia Stock Exchange 2008-2010. Research con-
ICASESS 2019 - International Conference on Applied Science, Engineering and Social Science
124

ducted by (Ediningsih and Yacobus, 2009) states that
there is difference of Debt to Equity Ratio (DER) be-
fore and after right issue. This indicates that funds
obtained from the rights issue are used to pay off the
liabilities of company. Debt repayment by the com-
pany will affect the value of Debt to Equity Ratio
(DER). Less debt will increase the proportion of capi-
tal to debt. Therefore, if the company tends to use the
cash earned from the right issue to pay off the debt of
company, the Debt to Equity Ratio (DER) value will
tend to decrease. From the description above, it can
be derived hypothesis as follows;
H2 : Suspected there is difference Debt to Equity
Ratio before and after Right Issue
4.3 The Defferences between Return on
Assets (ROA) before and after Right
Issue
Return on Assets (ROA) is a financial ratios used
tomeasure the relationship between profits and asset
investment needed to generate profit. Companies use
their assets to generate income. They are machines,
buildings, and intangible assets such as brands. Re-
turn on Assets (ROA) is derived from net income di-
vided by the average total assets of the company (Sub-
ramanyam et al., 2010). It will be higher if the value
of denominator (net profit) is greater than the value of
the numerator (average total assets). The informations
are required to calculate the Return on Asset ratio can
be found in the Financial Statements. Net income can
be found in the Income Statement. The value of the
company’s assets can be found in the Financial Posi-
tion Report. Research conducted by (Ediningsih and
Yacobus, 2009) states that the value of Return on As-
sets (ROA) is significantly different between before
and after the right issue. This study uses the company
population listed on the Indonesia Stock Exchange in
2001-2003. From the description above, it can be de-
rived from hypothesis as follows:
H3: Suspected There are difference in Return on
Assets before and after Right Issue
4.4 Differences Net Profit Margin
before and after Right Issue
Net Profit Margin (NPM) is the ratio used to mea-
sure the level of a company’s operating performance
derived from net income divided by sales (Subra-
manyam et al., 2010). This ratio reveals how much net
profit can be generated from the sales / revenue earned
by the company. Research conducted by (Ediningsih
and Yacobus, 2009) states that there is no significant
difference between Net Profit Margin before and after
Right Issue. The population of the research are com-
panies listed on the Indonesia Stock Exchange from
1997 to 2001. Research conducted by (Khajar, 2010)
states that there is no significant difference in the ra-
tio of Net Profit Margin before and after the right is-
sue. Research conducted by (Ediningsih and Yacobus,
2009) states that there is a difference Net Profit Mar-
gin (NPM) before and after right issue. From the de-
scription above, it can be derived hypothesis as fol-
lows.
H4: Suspected There Are Difference Between Net
Profit Margin before and after Right Isuue
4.5 Defferences in Assets Turnover
before and after Right Issue
Asset Turnover (ATO) is the ratio used to measure the
efficiency of companies in using their assets (Hofs-
trand., 2013). It assesses ability of a company in uti-
lizing assett to generate sales. ROA assesses the re-
turn on investment on assets viewed from net income.
ATO is a ratio that shows the activity of the company
obtained from dividing sales by total assets (Khajar,
2010). This ratio is used to measure the level of firms
in utilizing their assets. In addition, this ratio explains
the ability of firms in utilizing their assets to generate
revenue. The research conducted by (Khajar, 2010)
states that there is no significant difference in turnover
assets before and after the company exercises a right
issue. The study examined the differences in the fi-
nancial performance of firms by using two pre- and
postperiods to measure differences. Research con-
ducted by (Ediningsih and Yacobus, 2009) states that
there is no difference in Asset Turnover (ATO) before
and after the right issue. This is because the funds ob-
tained from the rights issue are not invested to buy as-
sets but are used to pay off the liabilities of company.
If the company can effectively utilize its assets to gen-
erate sales then the value of Asset Turnover (ATO)
will improve. Companies with multiple assets may
not necessarily produce decent sales when compared
to their asset holdings. From the description above, it
can be derived hypothesis as follows.
H5: Suspected there is sifference between Assets
Turnover before and after Right Issue
4.6 Differences Price Earnings Ratio
(PER) before and after Right Issue
Price Earning Ratio (PER) shows the stock price that
the investor is willing to pay for the profit of company.
PER is the ratio of the firm’s stock price to earnings
per share of the company. Price Earning Ratio (PER)
Investor Decisions with Pecking Order Theory Method: Strategy of an Investor to Get Right Issue
125
is the ratio used to show the stock performance of a
company obtained from share price divided by earn-
ings per share (Khajar, 2010). The greater the value of
PER then the more expensive the price of a stock. Pre-
vious research conducted by (Khajar, 2010) showed
a significant difference in Price Earning Ratio (PER)
before and after the Right Issue. This shows that there
is a difference in the company’s stock performance. If
the company’s stock price is high while earnings per
share is low, it will produce a high Price Earning Ratio
(PER) value. High Price Earning Ratio (PER) marks
the value of an expensive company’s stock in other
words investors do not like it. If the firm price is low
with high earnings per share, it will result in low Price
Earning Ratio (PER). From the description above, it
can be derived hypothesis as follows:
H6: Suspected there is difference between Price
Earnings Ratio (PER) before and after right issue
5 REAEARCH METHOD
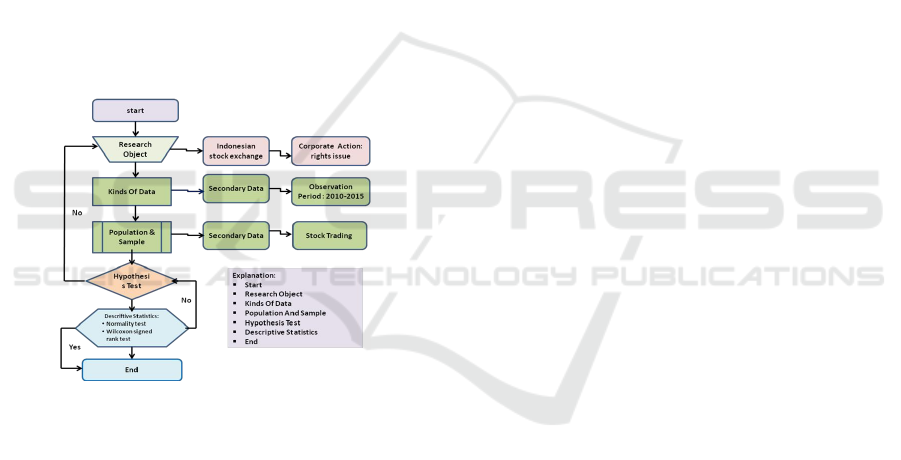
Figure 1: Flowchart Of Research Methods and Processes
The object of this research is all companies listed
on the Indonesia Stock Exchange that carry out corpo-
rate actions issue a rights issue during the observation
period, namely in 2010-2015(Indonesia, 2015). The
type of data used is secondary data about the com-
pany’s financial performance seen from six variables,
namely: Operating Cash Flows Ratio, Debt to Equity
Ratio, Return on Assets, Net Profit Margin, Assets
Turnover, and Price Earnings Ratio. This research is
an Event Study that is by looking at the impact of
corporate action issuing rights issues on stock trad-
ing 25 days before and 25 days after corporate ac-
tion. The analytical method used to prove the hypoth-
esis proposed in this study is the normality test and
the Wilcoxcon signed test. By comparing the value
of each variable before and after the company carries
out a corporate action issue a rights issue. The con-
clusions obtained will also be an alternative strategy
that should be chosen by investors according to the
variables tested.
6 RESEACH RESULTS AND
DISCUSSION
6.1 There is No Difference between
Operting Cash Flow Ratio before
and after Right Issue
Operating Cash Flow Ratio is the ratio used to as-
sess the financial performance of company in paying
off current liabilities by using cash obtained from the
company’s operating activities. Right issue is the is-
suance of stock returns by the company to increase
the company’s capital. Wilcoxon Signed Ranks test
results show that there is no difference in Operating
Cash Flow ratio before and after the right issue with
a non-significant performance increase. This shows
that there is no change in the company’s ability to pay
off current liabilities by using cash obtained from op-
erating activities between before and after the right is-
sue. According to Amuzu (2010) states that corporate
liability payments will increase the value of Operating
Cash Flow Ratio. Therefore, the payment of liabili-
ties has not been done significantly by the company.
The lack of performance difference in Operating Cash
Flow Ratio is caused when the cash obtained from the
right issue has not been used significantly to improve
the company’s operating performance. In addition,
the cash earned from the right issue has not been used
significantly by the company to pay its current liabil-
ities. PT Indoritel Makmur International / DNET is
one of the samples of this study that has not focused
on the right issue proceeds to increase sales. The news
reported on the web britama.com explains that DNET
or PT Indoritel Makmur International uses the right
issue proceeds for investments in several companies
6.2 There is No Difference between
Debt to Equity Ratio before and
after Right Issue
Debt to Equity Ratio (DER) is a ratio that measures
the capital structure of company derived from to-
tal liabilities divided by shareholder equity (Subra-
manyam et al., 2010). This ratio shows the propor-
tion between liabilities and corporate equity. Right
issue is the issuance of stock returns by the com-
pany to increase the capital of company. Wilcoxon
Signed Ranks test results show that there is no dif-
ICASESS 2019 - International Conference on Applied Science, Engineering and Social Science
126

ference of Debt to Equity Ratio before and after right
issue although there is a significant decrease. This
indicates that before and after right issue there is no
change of capital structure of company. The com-
parison between shareholder liabilities and equity did
not change significantly. According to Sunarjanto
in (Simanullang and Daljono, 2013) stated that the
change of Debt to Equity Ratio is not significant due
to the proceeding rights issue funds are not used to
pay off the debt. The results are not conducted by
(Ediningsih and Yacobus, 2009) states that there is
difference on Debt Equity Ratio before and after right
issue. This makes sense because in research of (Edin-
ingsih and Yacobus, 2009) that companies are more
likely to use funds from the rights issue to pay the ma-
tured obligations. However, the results of this study
should support (Fahmi and Saputra, 2013) states that
there is no difference in solvency before and after the
right issue. The absence of a Debt to Equity Ratio
difference is caused when the company does not sig-
nificantly use funds from the rights issue to pay cor-
porate liabilities. Therefore, the composition of lia-
bilities does not change significantly compared to eq-
uity although the composition of equity changes due
to capital increase through right issue.
6.3 There is No Difference between
Return on Assets before and after
Right Issue
Return on Assets (ROA) is the financial ratios used
to measure the asset investment relationship used to
generate profit (Lindo in Diminica et al, 2012). Right
issue is the issuance of stock returns by the company
to increase the company’s capital. Wilcoxon Signed
Ranks test results show that there is no difference
in Return on Assets before and after the right issue
and there is no significant increase in performance.
This shows that before and after right issue there is
no change in the increase in profits resulting from the
use of company assets. The results are not supported
by research conducted by (Ediningsih and Yacobus,
2009) states that there is no difference in ROA before
and after the right issue. This makes sense due to the
research (Ediningsih and Yacobus, 2009) , companies
are more inclined to invest the proceeds of rights issue
to buy company assets such as machinery, buildings
and other equipment to increase the company’s net
profit. The absence of a difference in ROA is caused
when the firm does not significantly use data from a
rights issue to invest in assets. If the company invests
its assets in order to increase the company’s produc-
tivity, its net profit will increase as it is followed by
revenue and production efficiency.
6.4 No Net Profit Margin Differences
before and after Right Issue
Net Profit Margin is a ratio that measures the ratio
of net income to sales. This ratio measures the ef-
fectiveness of the company in generating net income
by minimizing the cost. Right issue is the issuance
of stock returns by the company to increase the com-
pany’s capital. Wilcoxon Signed Ranks test results
showed no difference Net Profit Margin before and af-
ter the right issue significant increase in performance.
This shows that before and after the right issue does
not change the company’s ability to minimize costs.
The results of this study supported research conducted
by (Ediningsih and Yacobus, 2009) which states that
there is no significant difference Net Profit Margin be-
fore and after right issue. The results of this study
also supported research conducted by (Khajar, 2010)
which states that there is no significant difference Net
Profit Margin before and after right issue. The ab-
sence of a difference in Net Profit Margin is due to the
fact that the company does not use the funds obtained
from the rights issue to minimize costs. These costs
represent costs incurred when the company generates
revenue
6.5 Differences in Assets Turnover
before and after Right Issue
Asset Turnover is a ratio that shows the level of abil-
ity of a company to use assets to generate sales (Hof-
strand., 2013). Company assets that are rarely used
or even unused but still recognized are called null as-
sets. Right issue is the issuance of stock returns by the
company to increase the company’s capital. Wilcoxon
Signed Ranks test shows that there is a difference in
Asset Turnover before and after the right issue and a
significant decrease in performance. This shows that
before and after the right issue there is a change in
the company’s ability to use assets to generate sales.
The results of this study are not supported by research
conducted by (Khajar, 2010) which states that there is
no significant difference in asset turnover before and
after right issue. The results of this study are also not
supported by research conducted by (Ediningsih and
Yacobus, 2009) states that there is no difference in
asset turnover before and after the right issue. The
difference in the decrease in Asset Turnover is be-
cause the company has not used the funds from the
right issue to increase sales. The company is still fo-
cusing funds from the rights issue for other things.
PT Indoritel Makmur International is one of the sam-
ples of this study that has not focused the right issue
proceeds to increase sales. The news reported on the
Investor Decisions with Pecking Order Theory Method: Strategy of an Investor to Get Right Issue
127

web britama.com explains that DNET or PT Indori-
tel Makmur International uses the right issue proceeds
for investments in several companies.
6.6 No Price Earnings Ratio Differences
before and after Right Issue
Price Earning Ratio (PER) is the ratio used to show
the stock performance of a company obtained from
the share price divided by earnings per share (Kha-
jar, 2010). Investors tend to choose or buy compa-
nies with low PER Right issue is issuing of shares
re-done by the company to increase the company’s
capital. Wilcoxon Signed Ranks test shows there is
no difference Price Earning Ratio before and after the
right issue increase Price Earning Ratio is insignifi-
cant. This indicates that right issue is not a good in-
dicator for investors to buy shares of the company.
Although the company does a right issue, investors
tend to avoid the stock of the company. The results of
this study are unsupported by previous research con-
ducted by (Khajar, 2010) states that there is no dif-
ference in Price Earning Ratio before and after the
right issue. Differences in results are possible due to
the use of different time periods. The absence of dif-
ferences in Price Earning Ratio is because the mar-
ket does not call the right issue. Therefore investors
will tend to avoid companies doing the right issue.
PT Lipppo Karawaci is one of the company’s samples
of research avoided by investors. The news reported
in Kontan.co.id by (Taqiyyah, 2010) explains that the
related rights issue plan of PT Lippo Karawaci shares
decreased by -16.18% to Rp 570 per share.
7 CONCLUSIONS
Based on this data analysis and testing, the conclu-
sions are:
a There is no difference of Operating Cash Flow
Ratio between before and after right issue with
performance improvement of Operating Cash
Flow Ratio is insignificant; Investor’s strategy
does not use the right to buy shares in a rights is-
sue.
b There is no difference of Debt Equity Ratio be-
tween before and after right issue with decreasing
Debt Equity Ratio performance is insignificant.
Investor’s strategy does not use the right to buy
shares in a rights issue.
c There is no difference of Return on Asset between
before and after right issue with performance in-
crease Return on Asset is insignificant. Investor’s
strategy does not use the right to buy shares in a
rights issue.
d There is no difference in Net Profit Margin be-
tween before and after right issue with insignifi-
cant performance improvement. Investor’s strat-
egy does not use the right to buy shares in a rights
issue.
e There is a difference between the Asset Turnover
before and after the right issue with a significant
decrease. Investor’s strategy does not use the right
to buy shares in a rights issue.
f There is no difference in Price Earning Ratio be-
tween before and after right issue with the in-
crease of Price Earning Ratio is insignificant. In-
vestor’s strategy does not use the right to buy
shares in a rights issue.
REFERENCES
Amuzu, M. S. (2010). Cash flow ratio as a measure of per-
formance of listed companies in emerging economies:
The ghana example. Unpublished PhD dissertation.
Retrieved from http://stclements. edu/grad/gradmaxw.
pdf.
Dewi, A. T. and Rahyuda, H. H. (2014). Studi empiris
abnormal return sebelum dan sesudah pengumuman
right issue pada perusahaan go public di bursa efek
indonesia. E-Jurnal Manajemen, 3(11).
Ediningsih, S. I. and Yacobus, A. (2009). Pengaruh right is-
sue terhadap kinerja keuangan pada perusahaan yang
terdaftar di bursa efek indonesia. In Proceeding
Call For Paper Seminar Hasil-Hasil Penelitian Dosen
dan Seminar Nasional” Peran Inovasi dan Corpo-
rate Culture Guna Meningkatkan Sustainabilitas Bis-
nis Dalam Menghadapi Era Globalisasi” ISBN: 978-
979-3100-28-9, pages 323–341.
Fahmi, I. and Saputra, M. (2013). Analysis of profitabil-
ity ratio in publishing right issue decision at indonesia
stock exchange. International Journal of Business and
social science, 4(4).
Ghosh, A. (2011). Capital structure and firm performance.
Transaction Publishers.
Hofstrand., D. (2013). Financial ratios.
Indonesia, P. B. E. (2015). Idx fact book 2015.
Khajar, I. (2010). Pengaruh right issue terhadap kinerja
keuangan perusahaan. Jurnal Dinamika Manajemen,
1(1).
Mangkunegara, M. A. P. and Hasibuan, M. M. S. (2009).
2.2 manajemen sumber daya manusia.
Nazaruddin, I. and Basuki, A. T. (2015). Analisis statistik
dengan spss. Yogyakarta, Danisa Media.
Sheikh, J., Ahmed, W. A., Iqbal, W., and Masood, M. M.
(2012). Pecking at pecking order theory: Evidence
from pakistan’s non-financial sector. Journal of Com-
petitiveness, 4(4).
ICASESS 2019 - International Conference on Applied Science, Engineering and Social Science
128

Simanullang, P. F. and Daljono, D. (2013). ANALI-
SIS KINERJA KEUANGAN DAN KINERJA SAHAM
SEBELUM DAN SESUDAH RIGHT ISSUE (Studi
Empiris pada Perusahaan yang Terdaftar di Bursa
Efek Indonesia 2008–2010). PhD thesis, Fakultas
Ekonomika dan Bisnis.
Subramanyam, K., Wild, J. J., et al. (2010). Analisis laporan
keuangan. Jakarta: Salemba Empat.
Taqiyyah, B. (2010). Right issue di bawah harga pasar, sa-
ham lpkr terjun.
Wijaya, T. (2015). Cepat menguasai spss 19 untuk olah dan
interpretasi, cahaya atma, kelompok penerbit univ. At-
majaya Yogyakarta. Cetakan ke-5.
Investor Decisions with Pecking Order Theory Method: Strategy of an Investor to Get Right Issue
129
