
Implementation of Data Quality Management Application Architecture
Aji Nur Laksono
1
, Tien Fabrianti Kusumasari
1
and Muhammad Azani Hasibuan
1
1
Telkom University, Information System Departement, Jl. Telekomunikasi 01, Bandung, Indonesia
Keywords:
data profiling, data cleansing, data quality, monitoring, data quality management, architecture.
Abstract:
Data is a precious aspect, especially for an organization. Data must have good and guaranteed quality because
data can provide business value as a decision-maker. However, today many companies do not have useful
quality data in their management. Large organizations data requirements often cause this can be very diverse.
At the departmental and division level, each requires a different business process and IT system, so it directs
to create a specific application system with various platforms. This situation causes the amount of data to
repeat and become inconsistent. To overcome this problem, the architecture is needed to carry out quality
management data that can carry out data transformation paths such as profiling data and data cleansing. In this
study, the researchers developed a data quality application architecture by applying the principle of quality
management data that includes the process of profiling data, data cleansing, and monitoring data. The results
of this study will be compared with similar applications to find out which features can be superior in the data
quality management process.
1 INTRODUCTION
In the current era of information technology, data is
a critical aspect for an organization, whether profit
or non-profit. The data is facts and figures that are
processed every day. Processed data can be valuable
information that can influence the decisions taken.
Also, data must have good quality, which is a vital
determinant in terms of the effectiveness of an orga-
nization to provide business value (Taleb et al., 2018).
Data with higher data quality results in increas-
ingly accurate decisions. Determining the relation-
ship between data quality dimensions and business
processes helps organizations to make better deci-
sions (Panahy et al., 2014). In enterprise organiza-
tions, data requirements are very diverse. Each de-
partment and division in an enterprise has different
business processes. This directs the department or di-
vision to create a specific application system with var-
ious platforms. The business process in each part still
requires the same data.
Weak quality data will affect data governance in
a company. Data governance is planning, supervi-
sion, and control of data management and use of data
and data sources related to data (International, 2017).
Based on the concept of data governance, there are ten
(10) data management functions, including the Qual-
ity Management Data is one of the functions (Inter-
national, 2017). Data Quality Management (DQM) is
the management of data quality in order to maintain
the consistency of data to conform to the standards
and strategies applied to the organization or company
(Sabtiana et al., 2018). DQM is expected to be able to
measurably improve the quality of data so that busi-
ness objectives can be achieved. Data quality process-
ing has several processes such as data profiling, data
cleansing, data monitoring, and data integration Data
Profiling is the first step in data quality management
to understand all the feasibility of data sources and
the quality of each current data source (Abedjan, et
al., 2016). Data cleansing is a solution that can be
used to overcome data problems that generally occur
in enterprise-scale companies. The data cleansing is
improving the quality of data by transforming data to
fit the rules of business (Juddoo, 2015). Data mon-
itoring stages are used to monitor data quality and
measure data quality by business rules (International,
2017).
Previous research conducted by Febri (Dwiandri-
ani et al., 2017), focus on designing a single column
profiling algorithm, which is a process for performing
data quality using the open-source Pentaho Data Inte-
gration (PDI). The results of the research are expected
to be developed, which can later be arranged in inte-
grated application architecture to carry out the DQM
process.
This research focuses on utilizing and refining
previous research to create a web-based application
268
Laksono, A., Kusumasari, T. and Hasibuan, M.
Implementation of Data Quality Management Application Architecture.
DOI: 10.5220/0009868302680274
In Proceedings of the International Conference on Creative Economics, Tourism and Information Management (ICCETIM 2019) - Creativity and Innovation Developments for Global
Competitiveness and Sustainability, pages 268-274
ISBN: 978-989-758-451-0
Copyright
c
2020 by SCITEPRESS – Science and Technology Publications, Lda. All rights reserved
architecture to integrate algorithms in previous re-
search that can later be used as a whole as a feature
for data quality management architecture.
2 DATA PROFILING PROCESS
One thing that can be done to maintain data quality is
by conducting profiling data. Profiling data is the pro-
cess of verifying user‘s data for gathering data struc-
ture, data pattern, distribution value, or other infor-
mation for data governance and data quality manage-
ment control (Dai et al., 2016). Data Profiling is an
activity and process for determining metadata based
on a particular data set (Kusumasari et al., 2016).
The technique and processing of profiling data can
be grouped into three categories, namely Structure
Discovery, Content Discovery, and Relationship Dis-
covery (Institute, 2017). In general, Structure Dis-
covery can also be categorized as structure analysis.
Structure discovery analyzes the metadata and pattern
structure in the data. Structure discovery ensures that
data contains a consistent format. The point made in
structural analysis is to find data that is not the same
as the expected pattern or standard. Content Discov-
ery is a process of analyzing in more detail to each
element of the database to check data quality (Insti-
tute, 2017). General data problems are caused by data
entries that are messy and do not match the standard
pattern set. Data that does not conform to the standard
has the potential to cause problems, ranging from a
misunderstanding of data interpretation that can lead
to incorrect policies. Standardization on the content
discovery process is one of the leading solutions to
minimize the problems that occur. Relationship Dis-
covery handles the relationship between data from
various sources to get knowledge about the correla-
tion between the data needed. Related research con-
ducted by Febri is applying a data profiling algorithm
to process facet text for data using fingerprint cluster-
ing techniques. The text facet process is related to one
of the processing techniques in profiling data, namely
content discovery, which in this algorithm determines
a pattern to test the consistency of a data. The re-
search conducted by Sandy is to make a profiling data
processing algorithm that can determine the pattern
of data (Amethyst et al., 2018). This data pattern can
be categorized in content discovery. Then another re-
lated research conducted by Margo is to create a data
deduplication algorithm that can determine duplicate
data between columns and tables (Gunatama et al.,
2019). Which can be categorized as relationship dis-
covery.
3 DATA PROFILING PROCESS
Data Cleansing is a process to transform data into data
that is by the rules of an organization (Azeroual et al.,
2019). Problems with Quality Data can be solved by
initiating data cleansing. In general, problems with
data quality are caused by differences in the data for-
mat of each part of the application platform. Data
entered in the data warehouse becomes irrelevant to
each other. This problem causes a loss of data quality
that should be important to process. The data ware-
house itself requires the role of data cleansing. Data
that is loaded every day continuously is possible to
contain dirty data. Dirty data that is continuously col-
lected without doing cleansing can have fatal conse-
quences on decision making. Because of clean data
is an essential requirement for any sales, marketing,
and distribution strategy, data cleansing is one of the
main problems in data processing (Kumar and Dixit,
2017).
Related research conducted by Alfi (Khoirunisa,
2017) regarding making data cleansing. In this study
made a data cleansing algorithm using Pentaho data
integration originating from User Input and Auto-
matic Logic Users.
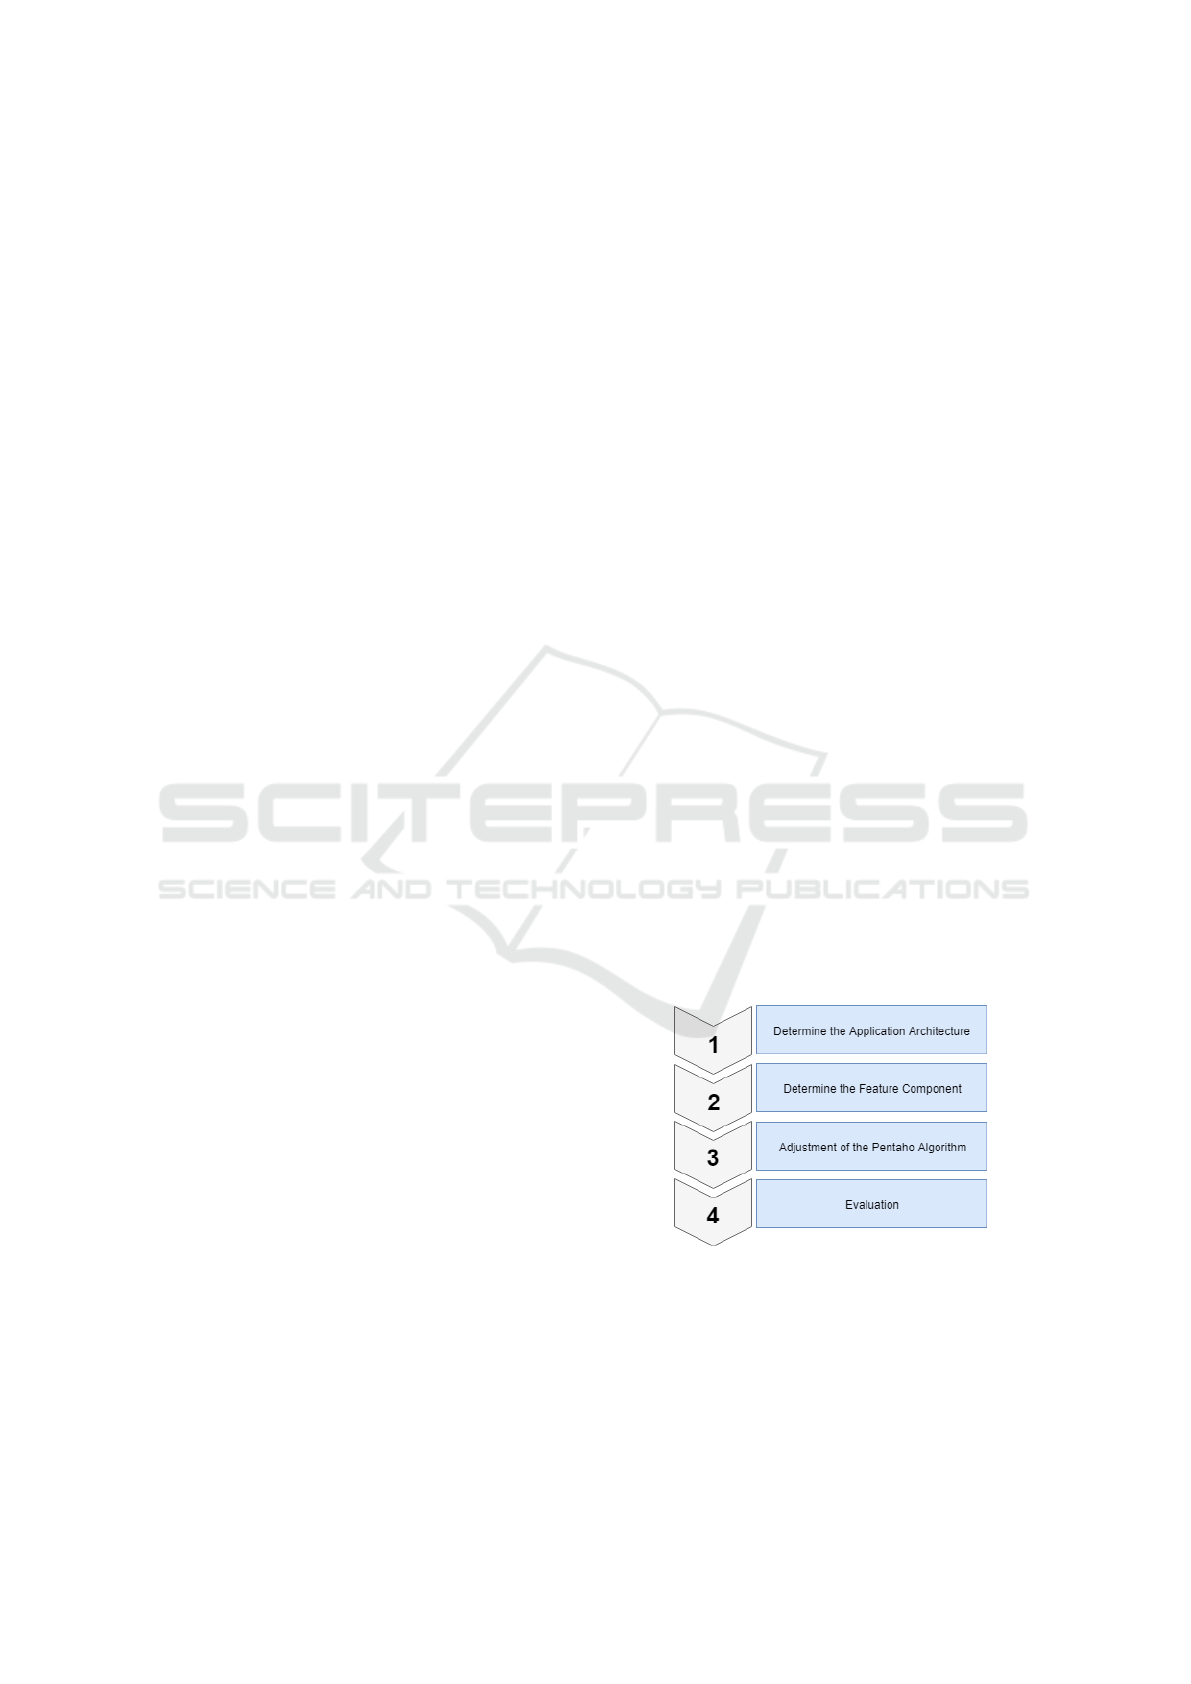
4 METHOD
The method used in this study are four steps. The first
step is to determine the proposed application archi-
tecture. The second step is to determine the feature
component. The third step is the adjustment of the
Pentaho algorithm. The final step is the evaluation.
Figure 1: Research Methodology
The first step is to determine the proposed appli-
cation architecture to analyze what architectural mod-
els are suitable for the application being developed.
Application architecture was made to change previ-
ous research about more dynamic data cleansing or
profiling algorithms. The application architecture is
created as a container for executing on Pentaho files
Implementation of Data Quality Management Application Architecture
269
which can later be integrated as a data profiling fea-
ture on data quality management applications.
The next stage determines how the feature com-
ponents in the proposed application architecture. The
researcher groups criteria as a reference aspect to de-
termine the features developed. From these criteria
determined how the feature components contained in
the proposed application.
The next step is the adjustment of the Pentaho al-
gorithm. The Pentaho algorithm made in previous re-
search was developed into a dynamic algorithm and
can receive data with several core parameters that are
required algorithms to process profiling data.
The final step is evaluation and comparison. In
this phase compared the features and components of
the proposed application architecture with existing
applications related to data quality processing.
4.1 Application Architecture
The application was made to develop previous re-
search on profiling data. In other research, profiling
data algorithms are made with the Pentaho data inte-
gration application tools. In order for the algorithm
to be utilized further into a function that can be run
widely and dynamically, architecture is designed to
be able to run the algorithm. Pentaho is made as a file
that can be executed using a job trigger that is avail-
able on Pentaho. The Pentaho algorithm can be inter-
preted as a logic function where this algorithm exe-
cutes a command to do profiling data. The algorithm
file is executed by the user on the front-end applica-
tion, which is then stored in the database.
Figure 2: Proposed Application Architecture
Figure 2 is a proposed architecture. The archi-
tecture created using the three-tier architecture model
where there are several layers namely, presentation
layer, logic layer, and the data layer.
• Presentation layer: Layer which is a link between
user and application, is a web application us-
ing the PHP programming language with Laravel
framework.
• Logic layer: Layer where the logic algorithm of
the feature is executed. Here Pentaho Data Inte-
gration works to process the data obtained to run
according to the expected function features
• Data layer: This layer is to store data both source
data that will be processed, exported, and save
data as a result of processing algorithms.
The selection of this three-tier model is in line
with the adjustments to the Pentaho algorithm, which
is developed where at the presentation layer, users can
enter the data needed in the process of profiling data
algorithm. From the presentation layer, the algorithm
is executed along with the data as a parameter. The al-
gorithm is executed with trigger Pentaho job by call-
ing the terminal function.
pentahodirectory pan.bat
/ f ile : f ilepentahodirectory
/param : ”param name = param value (1)
4.2 Features Component
As a measurement of the data quality management
function itself, the researcher divides into several cri-
teria for the requirements of the DQM process. The
comparison parameters include several discussion cri-
teria, namely data sources, core functions, and devel-
opment platforms.
Figure 3: Architecture Parameters.
ICCETIM 2019 - International Conference on Creative Economics, Tourism Information Management
270
For the database source function itself because it
applies the Pentaho data integration algorithm to the
core profiling data process and data cleansing from
the related research, the variety of data sources that
can be processed varies according to the capabilities
of the Pentaho tools. It is known that Pentaho data
integration can collect data from various data source
platforms, for example, relational databases, text files,
and CSV files.
For the core process, namely Data Profiling, the
researcher takes functions based on three technical di-
mensions in profiling data, namely content discovery,
structure discovery, and relationship discovery. Al-
gorithms are taken in research on profiling data pro-
cesses in different studies.
The following table explains the mapping of pro-
filing data process functions in this study
Figure 4: Data Profiling Description.
Other studies related to data cleansing from Au-
lia developed research on null cleansing and cleans-
ing patterns. This function is taken based on the im-
plementation of the existing profiling process, namely
pattern and null. Where according to the rules of data
cleansing is cleaning the data after anomaly data is
identified in the previous process, namely profiling
data.
For monitoring function itself is the phase where
profiling data has been done. The results of Data Pro-
filing stored on the database are then taken and dis-
played in graphic form. According to its function,
monitoring data is carried out to monitor data anoma-
lies periodically and consistently.
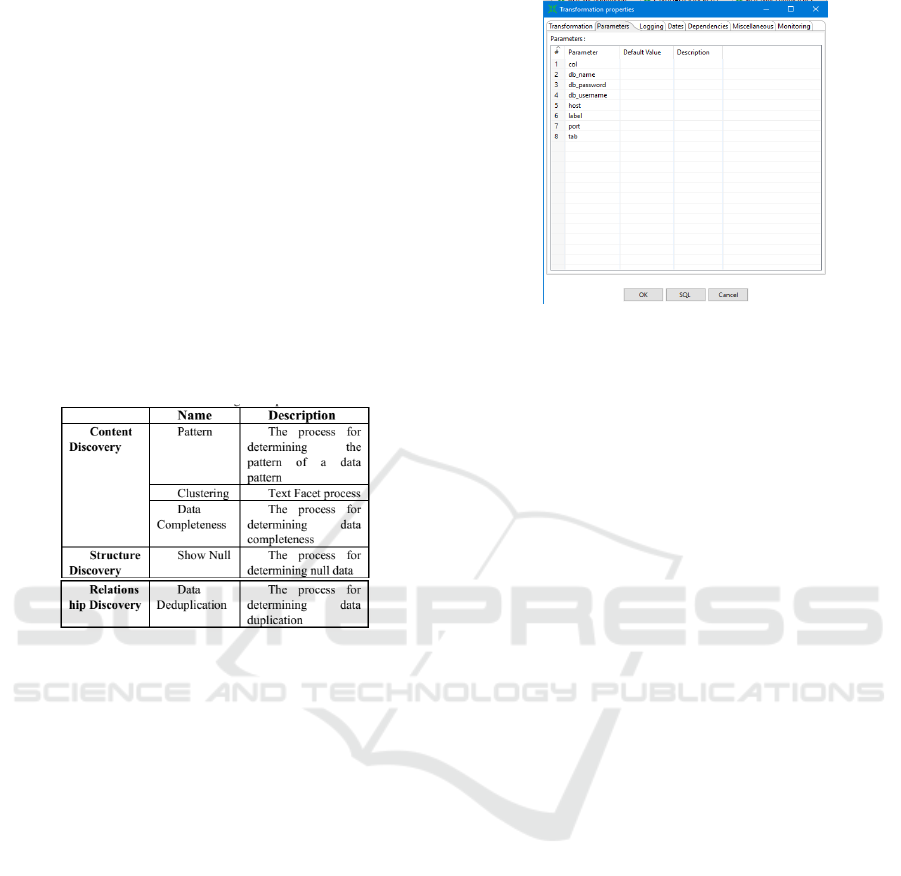
4.3 Adjustment of the Pentaho
Algorithm
Application architecture is built using Algorithms in
other studies. However, this algorithm needs to be
adjusted again with the application architecture used.
This adjustment is carried out as a development in
previous research to be used as part of the features
of an application architecture that has been designed.
Figure 5: Transformation properties
Variables as additional parameters are included to
replace previously determined values such as data in
database configuration, column data, and table. By
changing the value into a variable as a parameter, data
can be taken from the input form on the Application
layer, which will then be entered based on the speci-
fied variable parameters. Figure 5 is the property of
the transformation file Pentaho to initiate parameters
that will be captured and then inserted into the flow of
the algorithm.
To apply the variable to the parameter there are
two ways, the first one can directly call parameters
based on the variables with $parameter or first enter
the row through the Get Variables function on Pen-
taho.
To adjust the storage in the result database, the
component is first adjusted to the flow of the algo-
rithm to at the end of the data storage results. Data
being input from the form in the presentation layer.
Data from form input is a parameter that is entered in
the application layer as a variable to run the existing
algorithm. In previous studies, these data have been
determined or static. In this adjustment, the dynamic
data needed is changed to a new parameter variable
obtained from the parameters when the logic is run
on the application layer using a job trigger. In this ad-
justment, the trigger job used is Pan. Job Trigger is
executed through a terminal command that is called
on the Laravel framework as the presentation layer.
Then if all data entered is appropriate, and the algo-
rithm is successfully executed, the data is ready to be
entered into the database. Before the results of the
data are entered, the running id is entered to iden-
tify each process. In addition to running IDs, labels
are also included as a User reminder when processing
features. Then finally, the additional information is
entered into the database with data from the process.
In addition to the algorithm data, in the previous
database design, it was necessary to have a column to
Implementation of Data Quality Management Application Architecture
271
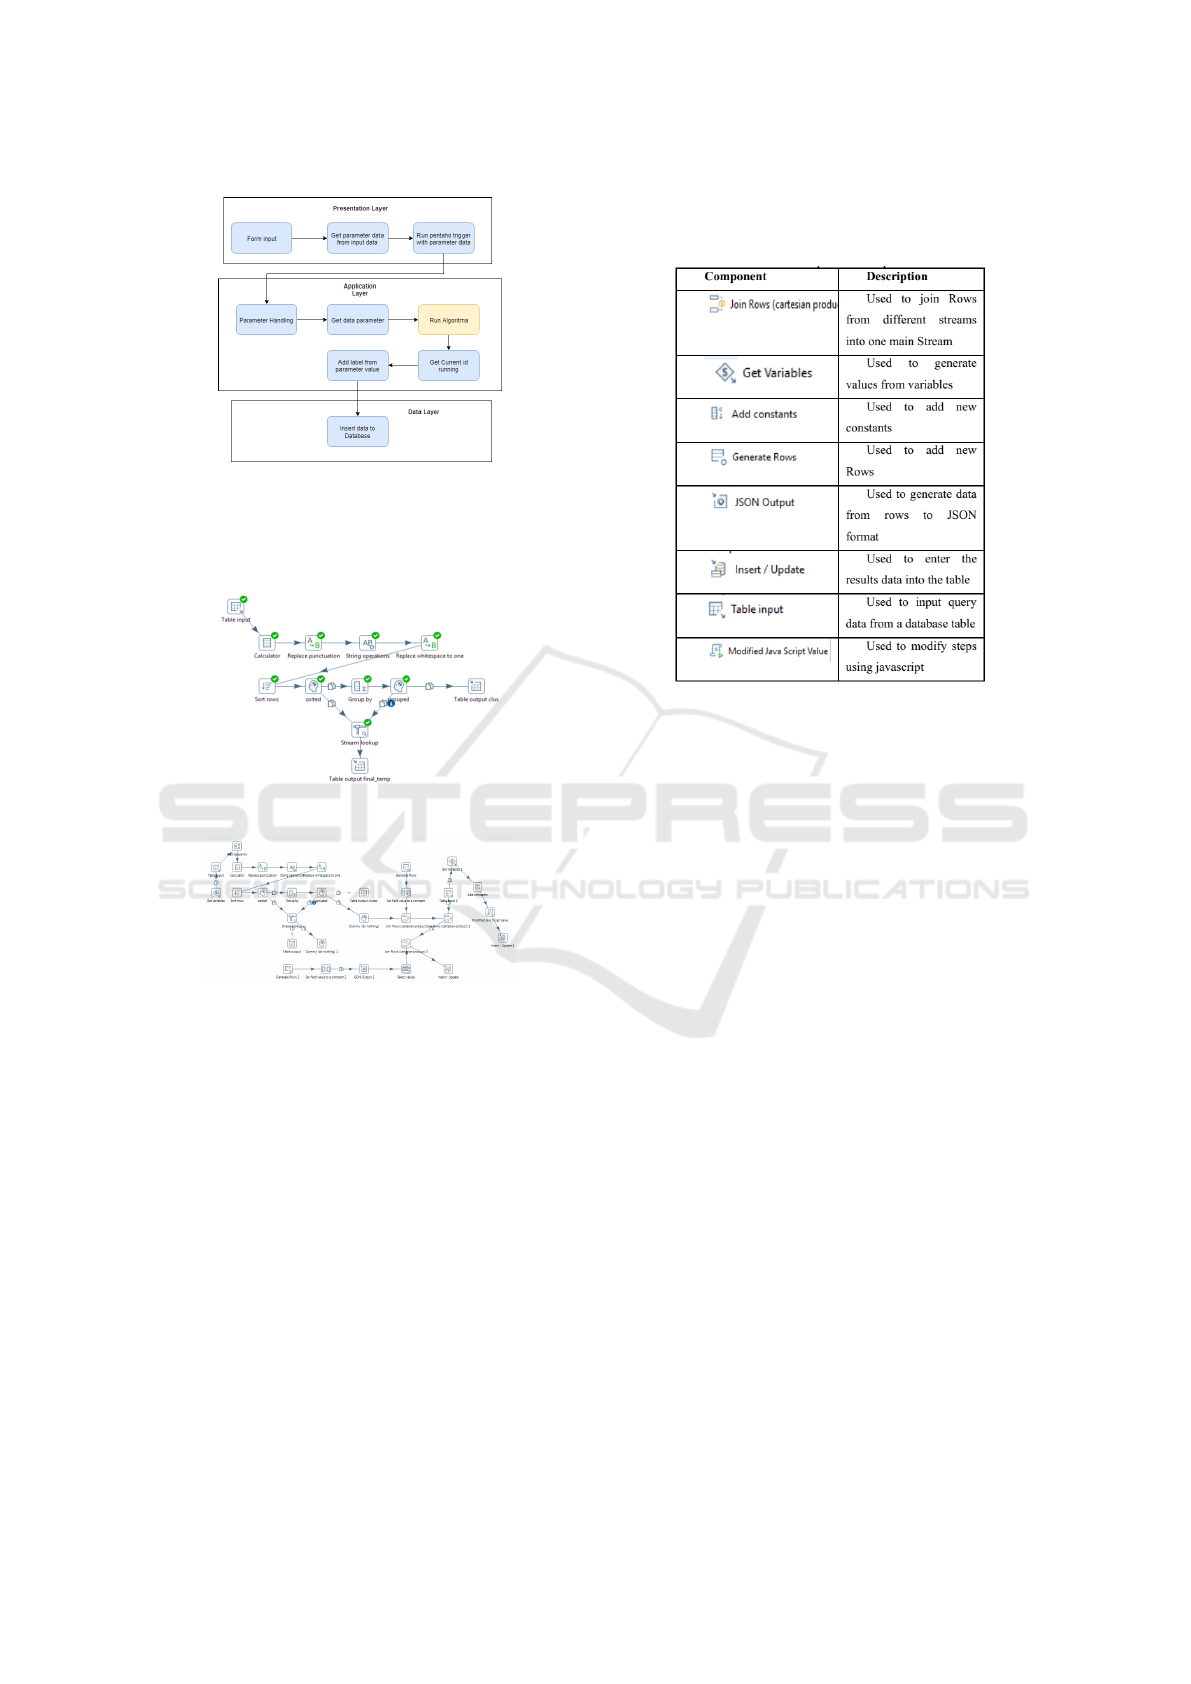
Figure 6: Adjust Pentaho algorithm
store the running ID to identify each process that was
run and the column to store details of the source data
connection
Figure 7: Algorithm before adjustment
Figure 8: Algorithm after adjustment
Figure 7 is an example of an algorithm in a previ-
ous study of profiling patterns that have added several
component steps to the Pentaho Kettle section in Fig-
ure 8. This adjustment is also made on the cleansing
algorithm for the same function.
The following Figure 9 is a component added as
an algorithm adjustment step to the application archi-
tecture.
Figure 9: Component description.
5 DISCUSSION
There are similar applications regarding data quality
processing, where the purpose of this application is
to test to find out the phenomenon of data. One of
them is Data Cleaner. With the variety of open source
applications available, the researcher will determine
the evaluation by comparing the proposed application
with the DataCleaner application.
When compared with a data cleaner application,
there are some differences from the comparison cri-
teria. In the application data source, the proposal
can accommodate text data as well as the relational
database. This variation is based on ability rather than
Pentaho Data Integration in collecting data sources.
While in the data cleaner, data sources can be more
varied, consisting of text, relational databases, Big
Data, and CRM software. In the primary function,
profiling data, data cleansing, and monitoring data,
only monitoring data are criteria that are not found
in the DataCleaner application. In the proposed ap-
plication architecture, the data cleansing and profil-
ing data features are built by developing previous re-
search algorithms regarding processing data on the
Pentaho data integration. For the development plat-
form, the Data Cleaner application was developed us-
ing a java desktop platform. Whereas in the applica-
tion architecture, the proposal uses Php at the presen-
tation layer, and Java at the application layer, namely
ICCETIM 2019 - International Conference on Creative Economics, Tourism Information Management
272
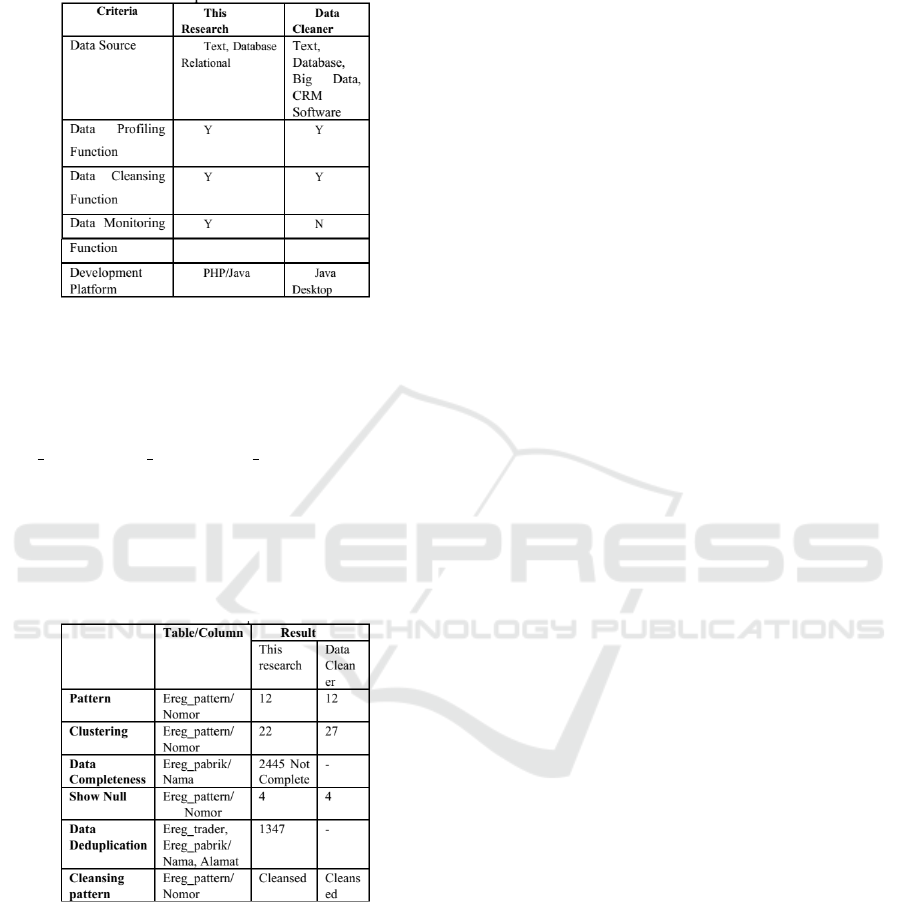
Pentaho data integration. Comparison can be seen in
the following Figure 10.
Figure 10: Comparison Evaluation.
Then compared the results of the data profiling
and data cleansing functions. Analysis of the data
in this journal was obtained from the government
agency dataset, which contained three tables, namely
ereg pattern, ereg pabrik, ereg trader with compari-
son columns that differed from each function. For
data deduplication functions, comparing two-column
data from two different tables. Because the function
of data deduplication itself is Relationship discovery
that compares the relationship between one column
and another.
Figure 11: Result comparison.
From the functions that are compared, there are
no differences or differences that are not too signifi-
cant. However, in the data completeness function, be-
cause the Data Cleaner can only detect null or blank,
it cannot be compared with the data cleaner function
of the application in this study because in this study
data completeness was detected in more detail at the
content level. Then in the data deduplication, the re-
searcher did not find a similar function in the Data
Cleaner application.
ACKNOWLEDGEMENTS
This research is one of the studies on data qual-
ity management funded by Telkom University’s re-
search and community service directorate. We want
to thank Telkom University and the Industrial Engi-
neering Faculty for supporting the research that we
have done. We also thank all the data quality man-
agement research teams that are part of Enterprise
System Development, Telkom University expertise
group.
REFERENCES
Amethyst, S., Kusumasari, T., and Hasibuan, M. (2018).
Data pattern single column analysis for data profiling
using an open source platform. In IOP Conference
Series: Materials Science and Engineering, volume
453, page 012024. IOP Publishing.
Azeroual, O., Saake, G., and Abuosba, M. (2019). Data
quality measures and data cleansing for research in-
formation systems. arXiv preprint arXiv:1901.06208.
Dai, W., Wardlaw, I., Cui, Y., Mehdi, K., Li, Y., and Long, J.
(2016). Data profiling technology of data governance
regarding big data: review and rethinking. In Informa-
tion Technology: New Generations, pages 439–450.
Springer.
Dwiandriani, F., Kusumasari, T. F., and Hasibuan, M. A.
(2017). Fingerprint clustering algorithm for data pro-
filing using pentaho data integration. In 2017 2nd
International conferences on Information Technology,
Information Systems and Electrical Engineering (ICI-
TISEE), pages 359–363. IEEE.
Gunatama, M., Fabrianti, T., and Hasibuan, M. A. (2019).
Deduplication for data profiling using open source
platform. In 2018 International Conference on In-
dustrial Enterprise and System Engineering (ICoIESE
2018). Atlantis Press.
Institute, S. (2017). What is data profiling and how does it
make big data easier?
International, D. (2017). DAMA-DMBOK: Data Manage-
ment Body of Knowledge. Technics Publications,
LLC.
Juddoo, S. (2015). Overview of data quality challenges in
the context of big data. In 2015 International Con-
ference on Computing, Communication and Security
(ICCCS), pages 1–9. IEEE.
Khoirunisa, A. N. (2017). Analysis and design of applica-
tion architecture data cleansing based on open source
in xyz organization , bandung: Telkom university.
Kumar, S. and Dixit, M. (2017). Analysis of various data
cleansing approaches: A survey. International Jour-
nal, 7(5).
Kusumasari, T. F. et al. (2016). Data profiling for data qual-
ity improvement with openrefine. In 2016 Interna-
tional Conference on Information Technology Systems
and Innovation (ICITSI), pages 1–6. IEEE.
Implementation of Data Quality Management Application Architecture
273

Panahy, P. H. S., Sidi, F., Affendey, L. S., and Jabar, M. A.
(2014). The impact of data quality dimensions on
business process improvement. In 2014 4th World
Congress on Information and Communication Tech-
nologies (WICT 2014), pages 70–73. IEEE.
Sabtiana, R., Yudhoatmojo, S. B., and Hidayanto, A. N.
(2018). Data quality management maturity model: A
case study in bps-statistics of kaur regency, bengkulu
province, 2017. In 2018 6th International Conference
on Cyber and IT Service Management (CITSM), pages
1–4. IEEE.
Taleb, I., Serhani, M. A., and Dssouli, R. (2018). Big data
quality assessment model for unstructured data. In
2018 International Conference on Innovations in In-
formation Technology (IIT), pages 69–74. IEEE.
ICCETIM 2019 - International Conference on Creative Economics, Tourism Information Management
274
