
Analysis of Service Quality and Patient Satisfaction using SERVQUAL
Method in Particular Public Hospital
Johanes Ronaldy Polla
1
, Respati Wulandari
1
, Ezra Aileen
1
and Thalia Dwiutami
1
1
BINUS University, Jakarta, Indonesia
Keywords:
Service quality, Patient satisfaction, Hospital and SERVQUAL method.
Abstract:
The purpose of this research is to measure the quality of services and patient satisfaction in the particular
public hospital and to find out which service dimension is the main priority for improvement. This research
measures the gap between patient expectation and patient perspective based on questionnaires completed by
202 patients from various polyclinics. This research used SERVQUAL method based on five dimensions of
service quality such as tangible, reliability, responsiveness, assurance, and empathy. The result of this research
found that the gap value from all dimensions are negative, and the main priority dimension for improvement
are empathy and responsiveness dimension. The conclusion is the service quality in the hospital has not been
satisfactory yet and the hospital should improve the quality of service in all dimensions especially on empathy
and responsiveness dimensions.
1 INTRODUCTION
Service quality means the fulfillment of patient ex-
pectations, the ability of service providers to fulfill
the needs and expectations of patients will gener-
ate a positive performanceof the ability of service
providers. If the performance of service quality is
positive and provider’s performance met the patients’
expectations, the patients will be more confident in
the ability and competence of the provider or hospital
(Zarei et al., 2015). According to (Long, ), healing
and recovery are no longer the only measurements of
patient satisfaction. (Akhade et al., 2016) conducted
research in hospitals in several countries. Problems
of service quality found in general were about the ef-
fectiveness of care, availability of resources, financial
accessibility, modernization of equipment, timeliness
of care delivery, performance accuracy, improvement
of interpersonal relationships, communication skills
of doctors, nurses, and other hospital personnel.
Hospitals in Indonesia are ranked at 774 in Asia
rankings and ranked 3858 in the world rankings. Hos-
pitals in Indonesia are still unable to compete with the
hospitals in Singapore that ranked at 45 and Malaysia
ranked at 171 in Asia (Punnakitikashem et al., 2012).
Hospitals in Indonesia are left behind compared to
ASEAN countries. Indonesian people choose to have
medical treatment in other countries. It means that the
quality of hospitals in Indonesia should be improved,
this is also a proof that the hospitals’ quality of ser-
vice in Indonesia is still low and there are still many
hospitals that have poor service.
Based on observation in Particular public hospi-
tal, the main problem in the hospitalsis service quality
that has been complained by the patients. According
to the Law of the Republic of Indonesia number 44
year 2009 about hospitals, hospitals’ permits can be
revoked if the hospitals no longer meet the require-
ments and standards, therefore this study aims to mea-
sure the services quality provided by the hospitals,
and researchers try to determine the service quality
and the level of patient satisfaction in Particular pub-
lic hospital based on data and find the right solution
to solve the problem. This research also find that the
hospitalsprovide registration service via SMS Gate-
way, where allow the patients to register without need
to come to the hospital and queue up, but patients are
still complaining because the SMS Gateaway service
registration is limited per day. The purpose of this re-
search is to measure the services quality that is given
to the patients and to explore the patients satisfaction
in the Particular public hospital. This research will
find which service dimension of servqual is the top
priority for an improvement in the Particular public
hospital.
Polla, J., Wulandari, R., Aileen, E. and Dwiutami, T.
Analysis of Service Quality and Patient Satisfaction using Servqual Method in Particular Public Hospital.
DOI: 10.5220/0009867802350241
In Proceedings of the International Conference on Creative Economics, Tourism and Information Management (ICCETIM 2019) - Creativity and Innovation Developments for Global
Competitiveness and Sustainability, pages 235-241
ISBN: 978-989-758-451-0
Copyright
c
2020 by SCITEPRESS – Science and Technology Publications, Lda. All rights reserved
235

2 LITERATURE REVIEW
Based on (Parasuraman et al., 1980) cited in (Rezaei
et al., 2016), the main way to improve the service
quality in health sector is to monitor and evaluate the
services provided by companies using tools and mod-
els for quality measurement. One of the best and most
used models to evaluate the service quality in health
care is the SERVQUAL model.SERVQUAL method
aims to understand how customers perceive service
quality. Instruments or questionnaires are used to
compare what service companies should offer, their
expectations, and their performances of actual service
performance (Punnakitikashem et al., 2012).
The level of expectation and performance of ser-
vice quality is measured by five dimensions based on
(Manulik et al., 2016):
1. Tangibility (appearance of physical facilities,
equipments, and personnel)
2. Reliability (ability to perform promised services
accurately and appropriately)
3. Responsiveness (willingness to provide fast ser-
vice and ability to help customers)
4. Assurance (knowledge and propriety of employ-
ees, ability to build confidence and trust)
5. Empathy (concern, individual attention given to
the company’s customers)
3 RESEARCH METHODOLOGY
The method used in this research is quantitative meth-
ods. Quantitative research is done bycollecting nu-
merical data, observing and measuring phenomena
that can be analyzed statistically, repeated and repli-
cated by the same researchers or other researchers
under imilar onditions (Hancock., 2002; Hamilton.,
2003) cited in (Everest, 2014).
The type of data used in this research is the pri-
mary data. Primary data refers to information ob-
tained directly by researchers on interest variables
for specific research purposes (Sekaran and Bougie.,
2013: p113). This research was conducted using con-
venience sampling technique.Convenience is collect-
ing information from a group of people who are will-
ing to give it (Sekaran and Bougie, 2016). There are
202 inpatients and outpatients from several polyclin-
ics in the hospital.
3.1 Data Collection
This study was conducted for a month by collecting
the information based on literature review related to
the research that taken from books, journals, previ-
ous research and others. Primary data collecting was
obtained through questionnaires distribution and by
short interview given to 202 patients in Particular par-
ticular public hospital from 23 polyclinics distributed
randomly from 23 polyclinics in the hospital, this is
limited due to a non-visited polyclinic for the sake of
joint health. Data processing in this research began
by testing validity and reliability.
The questionnare is based on 22 questions, it has
three parts of statements where the first one is mea-
suring the importance of service quality, the second is
measuring atient xpectations, and the third is measur-
ing patient performances of the actual service deliv-
ered. The 22 questions are divided into 5 dimensions.
Each dimension measures the service on a scale of 1
to 5.
1. Tangibility 4 attributes (appearance of physical fa-
cilities, equipments, personnel)
2. Reliability 5 attributes (ability to perform
promised services accurately and appropriately)
3. Responsiveness 4 attributes (willingness to pro-
vide fast service and ability to help customers)
4. Assurance 4 attributes (employee knowledge and
decency, their ability to build trust)
5. Empathy 5 attributes (concern, individual atten-
tion given to the company’s customers)
ICCETIM 2019 - International Conference on Creative Economics, Tourism Information Management
236
The following formula is used to calculate servqual
gap:
SQ = comparisono f expectation(E)
withper f ormancelevel(P)
SQ = P − E (1)
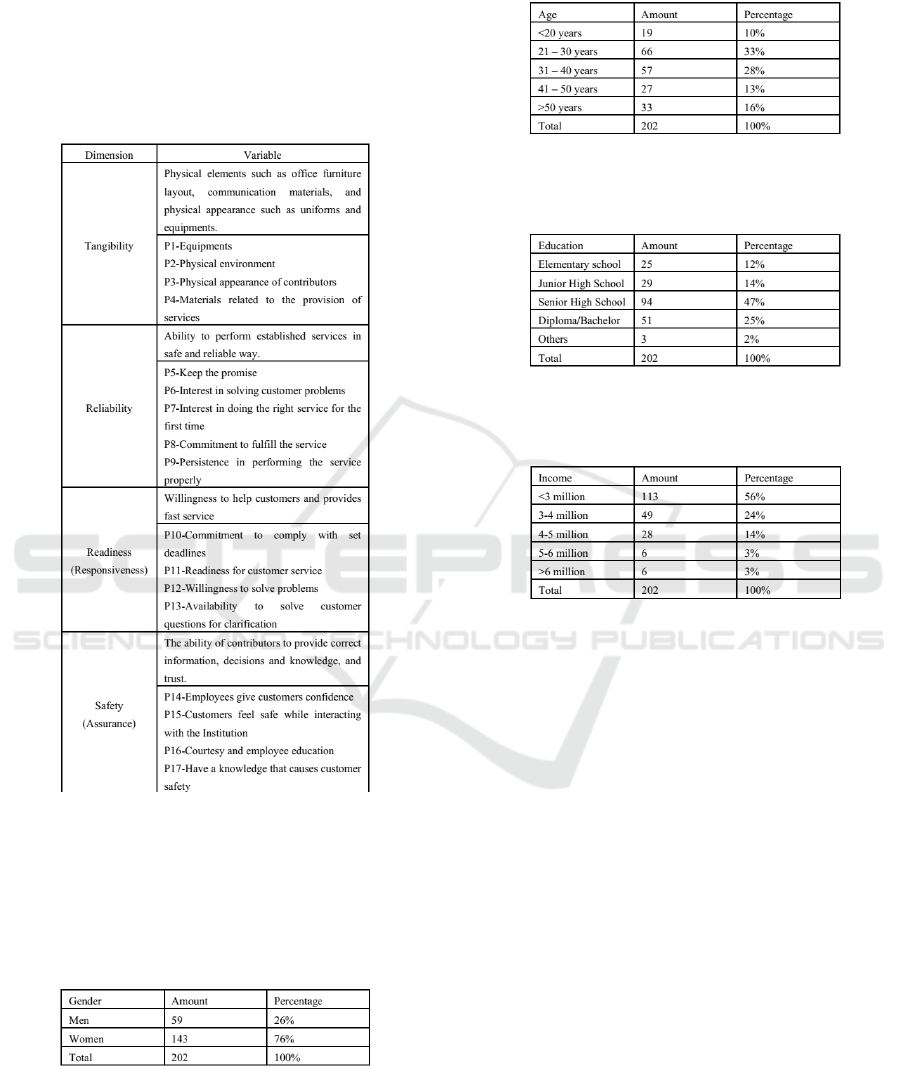
Figure 1: Operational Variables.
4 RESULTS AND DISCUSSION
Based on the data processing, found the result of re-
spondents by gender, as follows:
Figure 2: Respondents by gender.
Based on the data processing, found the results of
respondents by age, as follows:
Figure 3: Respondents by age.
Based on the data processing, found the results of
respondents by last education, as follows:
Figure 4: Respondents by last education.
Based on the data processing, found the results of
respondents by income, as follows:
Figure 5: Respondents by income.
Analysis of Service Quality and Patient Satisfaction using Servqual Method in Particular Public Hospital
237
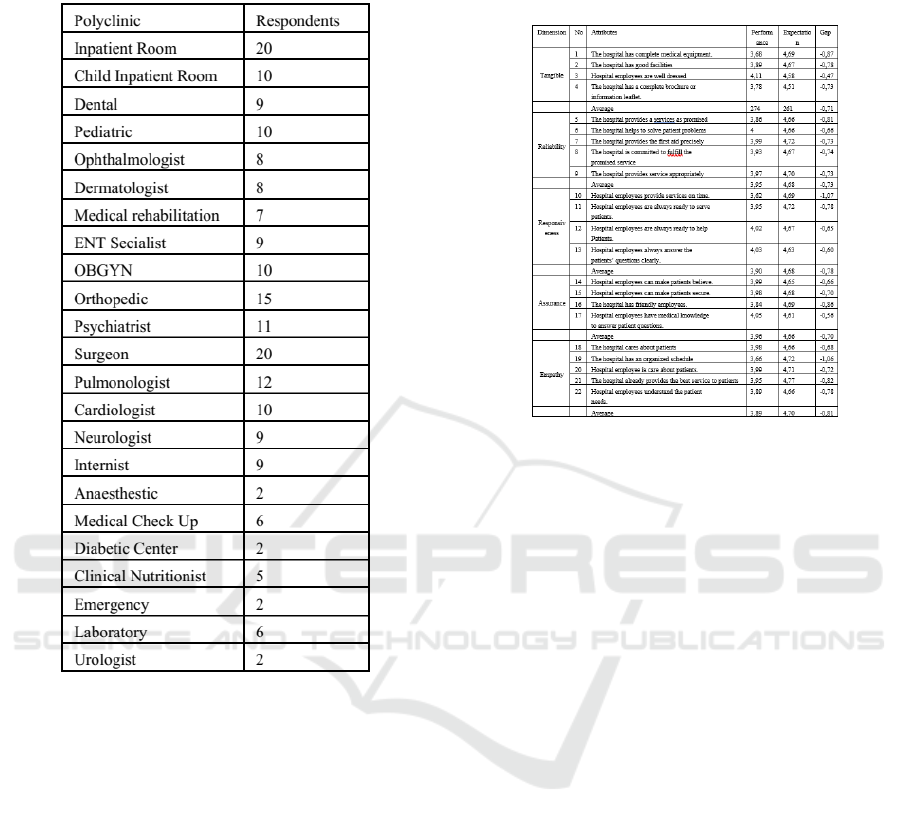
Based on the data processing, found the results of
respondents by polyclinic, as follows:
Figure 6: Respondents by polyclinic.
Questionnaires were distributed to 23 polyclinics
in the hospital. The number of respondents obtained
is 202, which from 202 respondents have different
profiles. The result of respondent profile data shows
that most patients of Particular public hospital are fe-
male with productive age that is 21 to 30 years old
with high school diploma or equal to working as a
housewife with income below 3 million.
Figure 7 are obtained from calculating the value of
servqual gap from patient Performance minus patient
Expectation.
Figure 7: Average servqual gap value.
The biggest gap found in P10 with the value of
-1.07 i.e. hospital employees have not been able to
provide services on time and P19 with a value of -1.06
i.e. the hospital does not have an organized schedule
because based on open questions, most of the patients
are complainingabout the queue and the service time-
liness.
ICCETIM 2019 - International Conference on Creative Economics, Tourism Information Management
238
Overall the quality service from Particular public
hospital has not fulfill patients’ expectation because
patients’ expectation is higher than patient’ perfor-
mance.
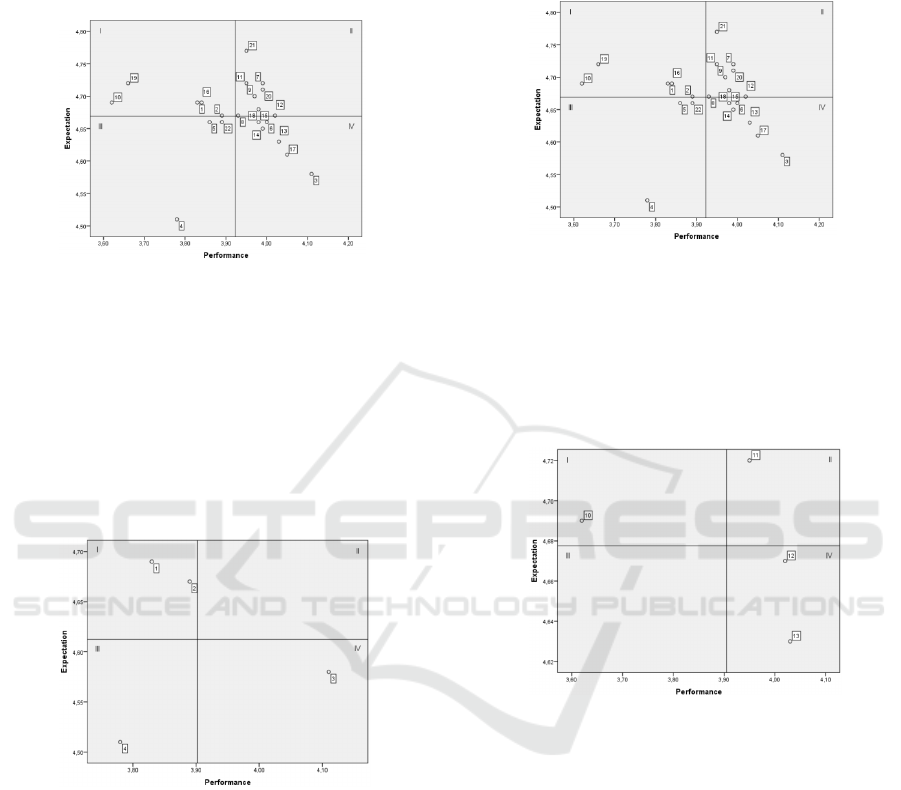
Figure 8: Cartesian diagram
There are 4 quadrants in Cartesian diagram.
Quadrant I is the priority area that must be improved
because it has a very important value, but the service
has not met patient’s expectations. The attributes in-
cluded in quadrant II are P1 (the hospital has com-
plete medical equipment), P2 (the hospital has good
facilities), P10 (hospital employees provide services
on time), P16 (the hospital has friendly employees),
P19 (the hospital has an organized schedule).
Figure 9: Cartesian diagram Tangible dimension
The main priorities for improvement for the hospi-
tal are facilities and medical equipment in the hospi-
tal, because according to the short interview with the
patient, the medical equipments owned by the hospi-
tal are less complete and it also has inadequate hos-
pital facilities. The hospital is not able to do some of
emergency measures and major surgery.
Inpatient wards in hospitals are also inadequate
because hospital’s building has reached the maximum
capacity.
Figure 10: Cartesian diagram
Based on the calculation of servqual gap from the
average value of performance and the average value
of expectation on Reliability dimension, There is no
attributes included in quadrant I because according to
the patients’ performance, the attribute of Reliability
dimension is good enough.
Figure 11: Cartesian diagram Responsiveness dimension
Based on the calculation of servqual gap from the
average value of performance and the average value of
expectation on Responsiveness dimension, attributes
included in quadrant I is P10 (Hospital employees
provide services on time).
Analysis of Service Quality and Patient Satisfaction using Servqual Method in Particular Public Hospital
239

The attributes included in quadrant II is P11 (Hos-
pital employees are always ready to serve patients).
Figure 12: Cartesian diagram Assurance dimension
Based on the calculation of servqual gap from the
average value of performance and the average value
of expectation on Assurance dimension, the attribute
included in quadrant I is P16 (the hospital has friendly
employees). The attributes included in quadrant II is
P15 (the hospital employee makes the patient feel se-
cure). In the Assurance dimension, the main prior-
ity for improvement for the hospital is the hospitality
from hospital employees, because some patients feel
the nurse did not give appropriate hospitality. Based
on a short interview, sick patients want to get good
service from the nurses and doctors. But hospital’s
employees can make patients feel safe while in the
hospital because patients believe that they have been
treated by professionals.
5 CONCLUSIONS AND
RECOMMENDATION
The purpose of this research is to measure the ser-
vices quality that’s given to the patient and to explore
the patient satisfaction in the Particular public hos-
pital. This researchfind which service dimension of
servqual is the top priority for an improvement in the
Particular public hospital, where the Servqual method
is used to know the gap value between patients per-
formance and patients expectation.
The result of this research from calculating the gap
in 22 attributes using Servqual method is negative.
The largest gap value was found in P10 with a value
of -1.07 i.e. hospital employees have not been able
to provide services on time and P19 with a value of
-1.06 i.e. hospital does not have an organized sched-
ule. The smallest gap value is found in P3 with val-
ues of - 0.47 i.e. Hospital employees are well dressed
and P17 with a value of -0.56 i.e. all hospital em-
ployees have a medical knowledge to answer patients’
questions. And also the service attributes, which ac-
cording to the patients, has the most important value,
so that the hospital should think and improve the ser-
vice are, P21 with values of 4.91 and P22 with values
of 4.92, where P21 is about the hospital already pro-
vides the best service to patientsand P22 is about the
hospital employees understand the needs of the pa-
tient because the patients expect the hospital to pro-
vide services in accordance with the required by the
patientand patients expect to get good service and feel
satisfy. In the level of service quality provided by the
hospital is found that the attributes of the five dimen-
sions have a negative gap value.
6 IMPLICATIONS
Based on the analysis results of this study, patients
expect the hospital can improve the service quality
by improving the timeliness of service. Manage the
doctors’ schedule by arranging the operation sched-
ule. When operation and visit schedule are managed,
patient will not wait too long for a visit. Manage the
queues in registration by increasing the registration
counters. Minimize the number of queues by adding
the registration quota via SMS Gateway or the hos-
pital can also create a special website to register, to
get the queue number and will also be determined at
what time the patient will be checked, so that patients
do not have to queue for too long and it will reduce
the number of queues in the hospital, and improve the
pharmacy queues by adding more of pharmacy staff.
The hospital is also expected to give individual care
and attention to the patient, hopefully patients would
feel more comfortable in the hospital.
7 LIMITATION
This research is limited to the service quality in partic-
ular public hospital with 202 respondents. Suggestion
for future research is to analyze and compare service
quality in more than one hospital, especially in pri-
vate hospitals. Find more respondents with various
backgrounds. Most respondents in this study chose
the hospital because this hospital because it is free of
charge and they get recomendation letter from their
nearest health care.
ICCETIM 2019 - International Conference on Creative Economics, Tourism Information Management
240

REFERENCES
Akhade, G., Jaju, S., and Lakhe, R. (2016). Critical re-
view of global practices in measuring healthcare ser-
vice quality. Int J Eng Res Technol, 5(2):762–9.
Everest, T. (2014). Resolving the qualitative-quantitative
debate in healthcare research. Medical Practice and
Reviews, 5(1):6–15.
Long, G. Improving the patient experience drives superior
patient satisfaction.
Manulik, S., Rosi
´
nczuk, J., and Karniej, P. (2016). Evalu-
ation of health care service quality in poland with the
use of servqual method at the specialist ambulatory
health care center. Patient preference and adherence,
10:1435.
Punnakitikashem, P., Buavaraporn, N., Maluesri, P., and
Leelartapin, K. (2012). Health care service quality:
case example of a hospital with lean implementation.
In POMS 23 rd Annual Conference, pages 20–23.
Rezaei, S., Matin, B. K., Khalil Moradi, B. B., Fallahi,
M., Shokati, B., and Saeidi, H. (2016). Measure-
ment of quality of educational hospital services by
the servqual model: the iranian patients’ perspective.
Electronic physician, 8(3):2101.
Sekaran, U. and Bougie, R. (2016). Research methods for
business: A skill building approach. John Wiley &
Sons.
Zarei, E., Daneshkohan, A., Khabiri, R., and Arab, M.
(2015). The effect of hospital service quality on pa-
tient’s trust. Iranian Red Crescent Medical Journal,
17(1).
Analysis of Service Quality and Patient Satisfaction using Servqual Method in Particular Public Hospital
241
