
Analysis and Design of Data Quality Monitoring Application using Open
Source Tools: A Case Study at a Government Agency
Mohammad Reza Effendy
1
, Tien Fabrianti Kusumasari
1
and Muhammad Azani Hasibuan
1
1
Department of Information System, Telkom University, Bandung, Indonesia
Keywords:
Data Quality, Monitoring, Data Quality Management, Open-source.
Abstract:
Data is an essential component in managing information systems in an organization. A good data quality
management can be used by organizations to create business policies. Many organizations have managed their
data to be good data quality, but there are still many organizations that have not been able to make good data
quality. A government agency in Indonesia has problems in managing data quality. Problems occur such as
a large amount of null data, different data patterns, duplication of data, alternating data writing policies until
there is no data quality monitoring application. To overcome these problems, there is a data quality monitoring
process which will monitor data quality in an organization.
1 INTRODUCTION
Organizations realize that the development of a qual-
ity information system has significant business bene-
fits. Using data to determine goals and decision mak-
ing makes data as an essential component of infor-
mation systems (Leonard, 2018). Data governance
as a part of corporate governance and information
technology is defined as data management techniques
that produce data as a part of organizational assets
(Brackett and Earley, 2009). Data governance is a se-
ries of processes, policies, standards, organizations,
and technologies that ensure availability, accessibil-
ity, quality, consistency, audit capability, and data se-
curity in an organization (Panian, 2010).
When an organization is seriously handling infor-
mation system quality issues, they must manage the
quality of data in their organization (Leonard, 2018).
Data quality plays a vital role in data governance,
data quality as a way to build the reputation of an or-
ganization, as a decision-making action, even opera-
tional process, and transaction process (Herzog et al.,
2007). The primary purpose of the organization to
handle data quality problems is to improve the accu-
racy of data, data completeness, the age of data and
data quality reliability. Managing data quality prob-
lems are one among the functions in data governance,
namely Data Quality Management (DQM) (Brackett
and Earley, 2009). The DQM process divided into
several stages, starting from the scene of data produc-
tion, data storage, data transfer, data sharing, and data
usage (Rouse,2018). DQM consists of several phases,
namely data profiling, data cleansing, data quality as-
sessment, and data quality monitoring (Apel et al.,
2015). Data quality monitoring is also described as
monitoring and ensuring data (static and streaming)
can adjust the business rules and can be used to deter-
mine the quality of data in an organization (Judah and
Friedman, 2014).
In this study, a government agency in Indonesia
has some common mistakes in the data entry pro-
cess, for example, are the existence of empty data, the
absence of standards in data formats, and the emer-
gence of data redundancies that are still a problem for
the government agency. These errors also cannot be
monitored automatically by the application, and if left
unchecked, these errors will become an ongoing prob-
lem because the data will continue to increase even
more. By looking at these conditions, a data quality
monitoring application is needed to monitor the qual-
ity of data automatically. This study was made to de-
sign a data quality monitoring application in the study
case of a government agency.
214
Effendy, M., Kusumasari, T. and Hasibuan, M.
Analysis and Design of Data Quality Monitoring Application using Open Source Tools: A Case Study at a Government Agency.
DOI: 10.5220/0009867402140219
In Proceedings of the International Conference on Creative Economics, Tourism and Information Management (ICCETIM 2019) - Creativity and Innovation Developments for Global
Competitiveness and Sustainability, pages 214-219
ISBN: 978-989-758-451-0
Copyright
c
2020 by SCITEPRESS – Science and Technology Publications, Lda. All rights reserved

2 THEORY AND RELATED
WORK
2.1 Data Quality Monitoring
The Data Management Association says there are four
processes in managing data quality are plan, deploy,
monitor, and act (Brackett and Earley, 2009). The
plan is defined as a process for assessing the scope
of data quality issues. The deploy stage is the stage
for analyzing data profiles. Stages of monitoring are
used to monitor data quality and measure data quality
by business rules. Act stage is the last stage, namely
decision-making, to overcome and resolve data qual-
ity problems. In managing data quality, there is a
process, one of which is Data Quality Monitoring
(DQM). Data Quality Monitoring is a framework that
is used to control the quality of data in an informa-
tion system continuously, for example, by using met-
rics, reports, or by using profiling data regularly (Apel
et al., 2015). (Ehrlinger and W
¨
oß, 2017) et al. di-
viding the data quality monitoring process into four
steps, namely data profiling and quality assessment,
data quality repository, time series analytics, and vi-
sualization. Data profiling is a series of activities and
processes to determine metadata in a data set (Abed-
jan, 2016). Based on (Abedjan et al., 2016), data pro-
filing is divided into three groups, namely single col-
umn profiling, multiple columns profiling, and depen-
dencies. According to DataFlux Corporation, in the
technique and processing of data profiling involves
three categories of analytical methods, namely: col-
umn discovery, structure discovery, and relationship
discovery (Apel et al., 2015). Data Quality Assess-
ment is a phase in DQM that is used to verify the
source, quantity, and impact of each data item that
violates predetermined data quality rules. Data qual-
ity standards consist of five dimensions, and there are
availability, usability, reliability, relevance, and pre-
sentation qualityc (Cai and Zhu, 2015). DQ Repos-
itory is divided into two components, namely Data
Quality Metadata (DQMD) and the results of Data
Quality Assessment (DQA). DQMD is a description
of the data schema being assessed, while the results
of DQA are a database that stores DQA results over
time (Ehrlinger and W
¨
oß, 2017). Visualization of the
results of data quality has been examined by Kandel et
al. (Kandel et al., 2012), which highlights the need to
automate this step since the determination. The pur-
pose of the visualization is that there are two of them,
the time-series data stored from the DQ Repository
can be mapped directly, and on the other hand, the re-
sults of time series analysis can be presented to the
user.
2.2 Pureshare
Pureshare is a dashboard development methodology
produced by pureshare vendors. Pureshare proposes
to do projects associated with measuring and manag-
ing organizational performance easier. The pureshare
development method, starting with planning and de-
sign that identifying the user needs, in addition to this
step, also identifying the features on the dashboard.
After knowing the user needs, the next step is review
system and data, such as controlling the system, iden-
tifying of data sources, accessing data, and measuring
the size of a data. The next step is designing the pro-
totype as quickly as possible to provide an overview
of the dashboard system that will be created. After the
prototype is created, a series of prototypes that have
been made will be reviewed together with the user to
gather feedback to be further developed according to
the user’s needs. After the user approve the prototype
and it suitable with the user needs, the dashboard pro-
totype will be implemented in the release step.
2.3 Related Work
This research is a continuation of previous studies that
have been carried out. Previous research conducted
by Amethyst (Amethyst et al., 2018) about the using
of data profiling, which focuses primarily on analyz-
ing data by doing profiling data using the cardinali-
ties method, data pattern and value distribution using
open source applications. The results of profiling will
be implemented in the form of logic in open source
applications and will be compared with other open-
source applications. In another research used in this
study is a study from Dwiandriani, which had a main
focus on building a profiling data architecture for cal-
culating null or blank data in a column.
3 PROPOSED METHODOLOGY
In developing this data quality monitoring applica-
tion, there are two main focuses, including the devel-
opment of a dashboard as visualization and the de-
velopment of data quality monitoring architecture. In
developing the data quality monitoring architecture,
we used the concept that was studied by Ehrlinger
(Ehrlinger and W
¨
oß, 2017). The architecture of data
quality monitoring has been investigated by Ehrlinger
(Ehrlinger and W
¨
oß, 2017) states that data quality
monitoring architecture starts from determining data
source, followed by data profiling and data quality as-
sessment, storing the results, time series analysis, and
Analysis and Design of Data Quality Monitoring Application using Open Source Tools: A Case Study at a Government Agency
215
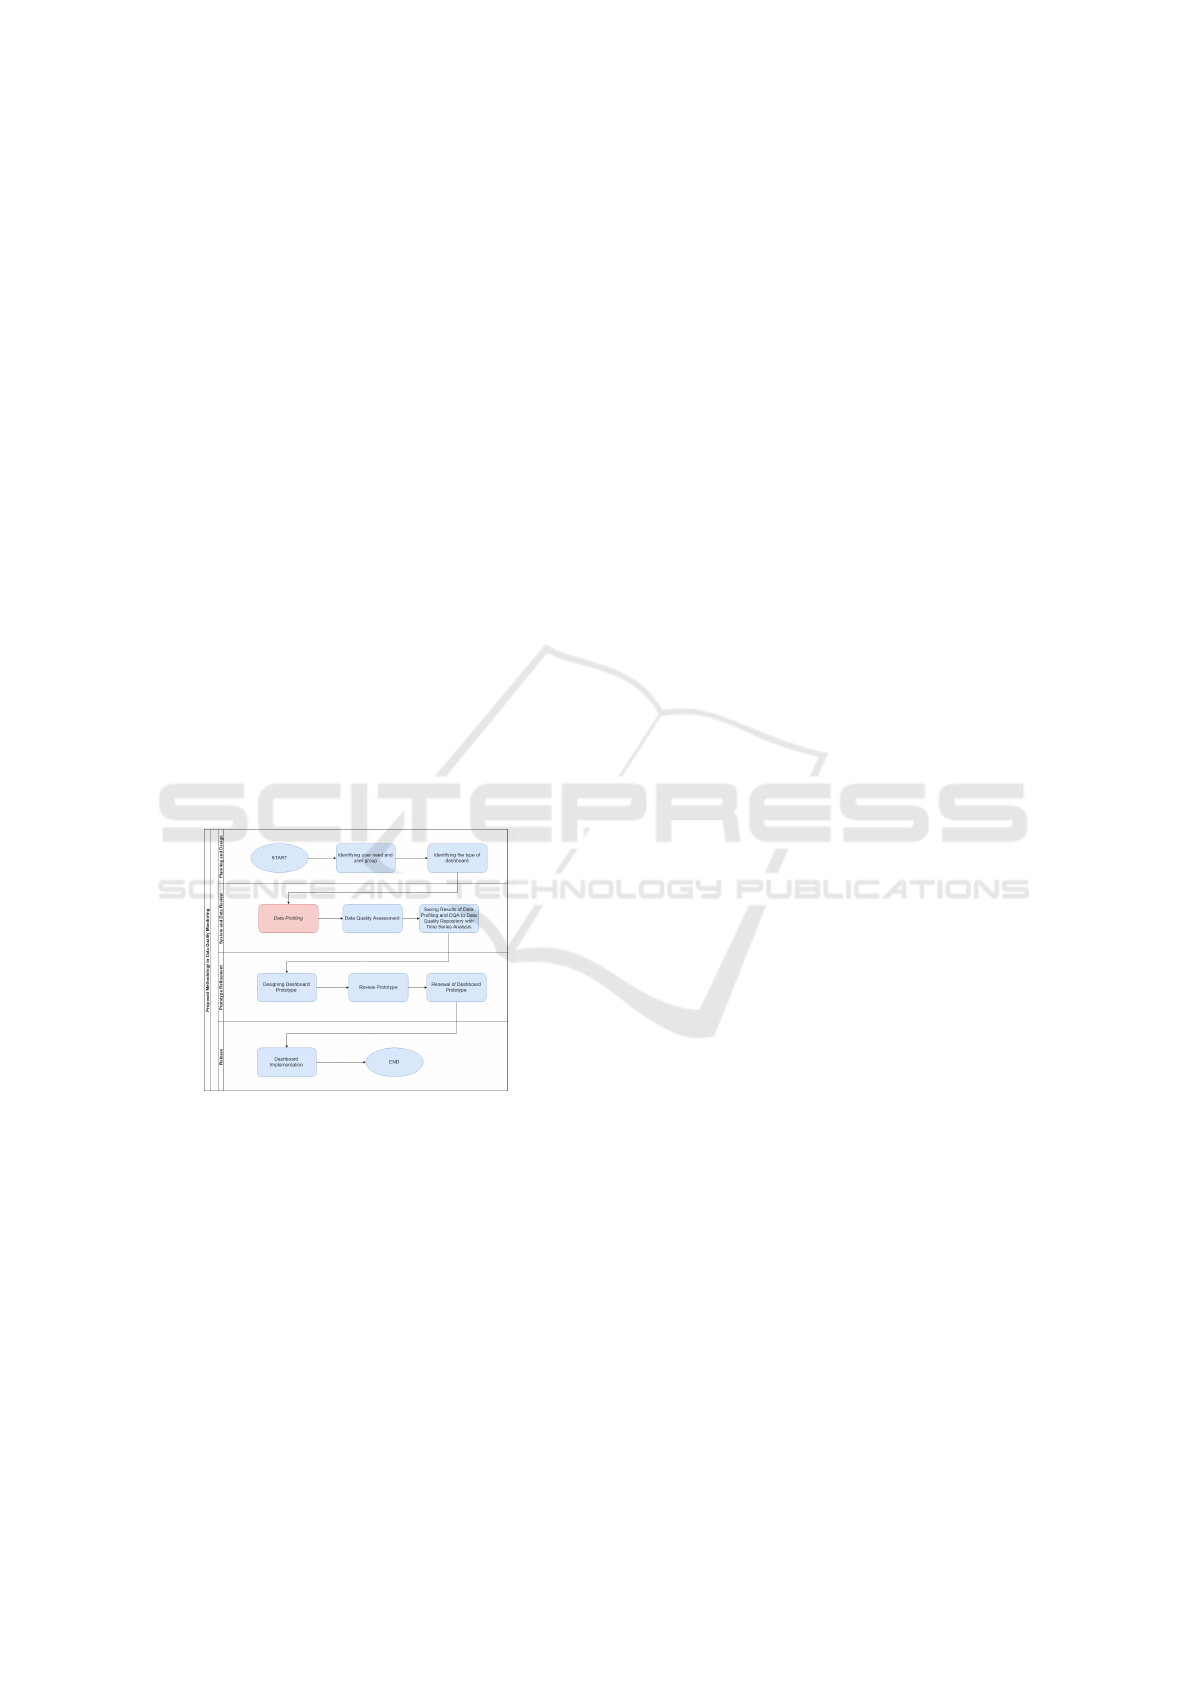
the last is visualization. While in developing the dash-
board application, we implement pureshare method-
ology. In this proposed methodology, the steps of
developing a data quality monitoring architecture are
performed in the pureshare methodology.
This proposed methodology consists of four
stages, there are plan and design, system and data
review, prototype refinement, and release. The first
stage is plan and design, the developer identify the
user needs and the type of dashboard in this stage.
Second stage is system and data review, in this stage
the developer identify the datasource, the process of
identifying the data source starts with data profil-
ing, data quality assessment, and saving the results
of data profiling and assessment. The data profiling
process has been carried out by previous research by
(Amethyst et al., 2018). After the system and data
review stage, the next stage is prototype refinement
stage with the aim to design dashboard prototype. The
prototype will be reviewed periodically until the user
approves the renewal dashboard prototype. The dash-
board prototype will be implemented at release stage,
as shown at Figure. 1. As shown in Figure. 1. all
of the steps of data quality monitoring architecture
are applied in this proposed methodology such as data
profiling, data quality assessment, time series analy-
sis, and also visualization.
Figure 1: Pureshare Methodology
4 RESULT AND ANALYSIS
4.1 Study Case Analysis
In this study, the researcher uses three tables of data
from a government agency in Indonesia, there are a
pabrik table, trader table, and merk table. In this case,
a government agency in Indonesia is still having diffi-
culties in managing the quality of data related to their
data. The challenge is, there are a lot of empty data
in each column, the data pattern in a column is still
different, and the amount of value distribution from
a column is still unknown. These problems also still
cannot be monitored automatically by the application,
and if left unchecked, these problems will become a
continuing problem because the data that is owned
will continue to increase even more. Besides that,
the condition that occurs in the current government
agency is the existence of existing applications that
are used to support the process of checking the au-
thenticity of a product. However, existing applica-
tions are not integrated of their respective uses, there
is no checking for data entry errors in the application,
and each application has its database with different
platforms.
Another problem is alternating policies for the for-
mat of data. It will make the data become more re-
duced quality data. By looking at the conditions in
such a government agency, a data quality monitoring
application is needed that aims to monitor the qual-
ity of data automatically in each database with dif-
ferent platforms. We use five profiling parameters in
this case, there are pattern profiling, show null pro-
filing, clustering profiling, data completeness profil-
ing, and value distribution profiling. Pattern profiling
is used to identify the percentage of data patterns in
a column with a different format, show null profil-
ing is used to collect the amount of empty data in a
column. Clustering profiling classifies the number of
clusters in each column, and data completeness pro-
filing shows the percentage of data valid according to
the dictionary, value distribution profiling calculates
the number of items in a column.
4.2 Data Quality Monitoring
Application
4.2.1 Dashboard Page
The dashboard on Figure. 2 is consist of five cards
that show the results from each data profiling. The
pattern card shows a pie chart with the blue part is
the percentage passing score of pattern profiling in all
rules, and the red part is the percentage failed score
of pattern profiling by all regulations. The show null
card shows the total blank/null data in each show null
profiling running. The clustering card shows a to-
tal of number clustering in each clustering profiling
running. The data completeness card shows a bar
chart, and the yellow bar describes total valid data that
matches the dictionary, the red bar describes a total of
not complete data, and the yellow bar describe a to-
tal of not in dictionary data. The last card is the value
distribution card, this card show bar chart that outlines
the amount of data distribution in each profiling.
ICCETIM 2019 - International Conference on Creative Economics, Tourism Information Management
216
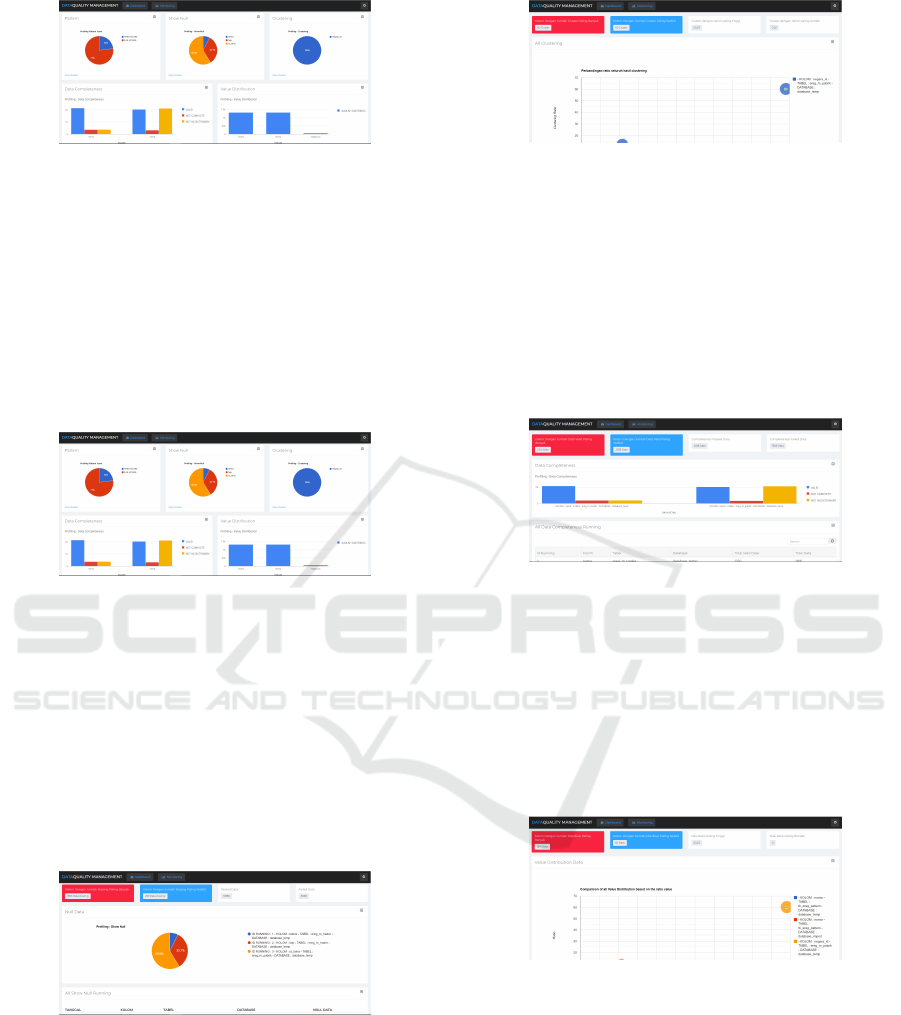
Figure 2: Dashboard Page
4.2.2 Pattern Report Page
The pattern report page on Figure. 3 consist of infor-
mation about the results of pattern profiling, the col-
umn with the most number of patterns, columns with
the least amount of patterns, pattern passing score,
pattern failing score, pattern checking score, and pat-
tern profiling table.
Figure 3: Pattern Report Page
4.2.3 Show Null Report Page
The show null report page consists of information
about the results of show null profiling, the column
with the highest number of blank/null, the column
with the least amount of blank/null, totally passed
data, totally failed data, results of all profiling, and
all show null profiling table as shown in Figure. 4.
Figure 4: Show Null Report Page
4.2.4 Clustering Report Page
The clustering report page on Figure. 5 consist of
information about the results of clustering profiling,
the column with the most number of clusters, the col-
umn with the least amount of clusters, cluster with the
highest ratio, the cluster with the lowest ratio.
Figure 5: Clustering Report Page
4.2.5 Data Completeness Report Page
The data completeness report page consists of infor-
mation about the results of data completeness profil-
ing, the column with the most valid data, the column
with the least valid data, completeness passed data,
completeness failed data and all data completeness
profiling table as shown in Figure. 6.
Figure 6: Data Completeness Report Page
4.2.6 Value Distribution Report Page
The value distribution report page on Figure. 7 con-
sist of information about the results of running profil-
ing, the column with the most amount of distributions,
the column with the least amount of distributions, the
highest distribution ratio, the lowest distribution ratio.
Figure 7: Value Distribution Report Page
4.2.7 Pattern Monitoring Page
This pattern monitoring page shows information
about the results of pattern data profiling feature. On
this page, a pivot table is displayed whose data is
taken from the database. Users can also monitor the
results of pattern data profiling based on the pivot
columns provided such as based on running id, table
name, column name, database name, number of pat-
terns, and date as shown in Figure. 8.
Analysis and Design of Data Quality Monitoring Application using Open Source Tools: A Case Study at a Government Agency
217
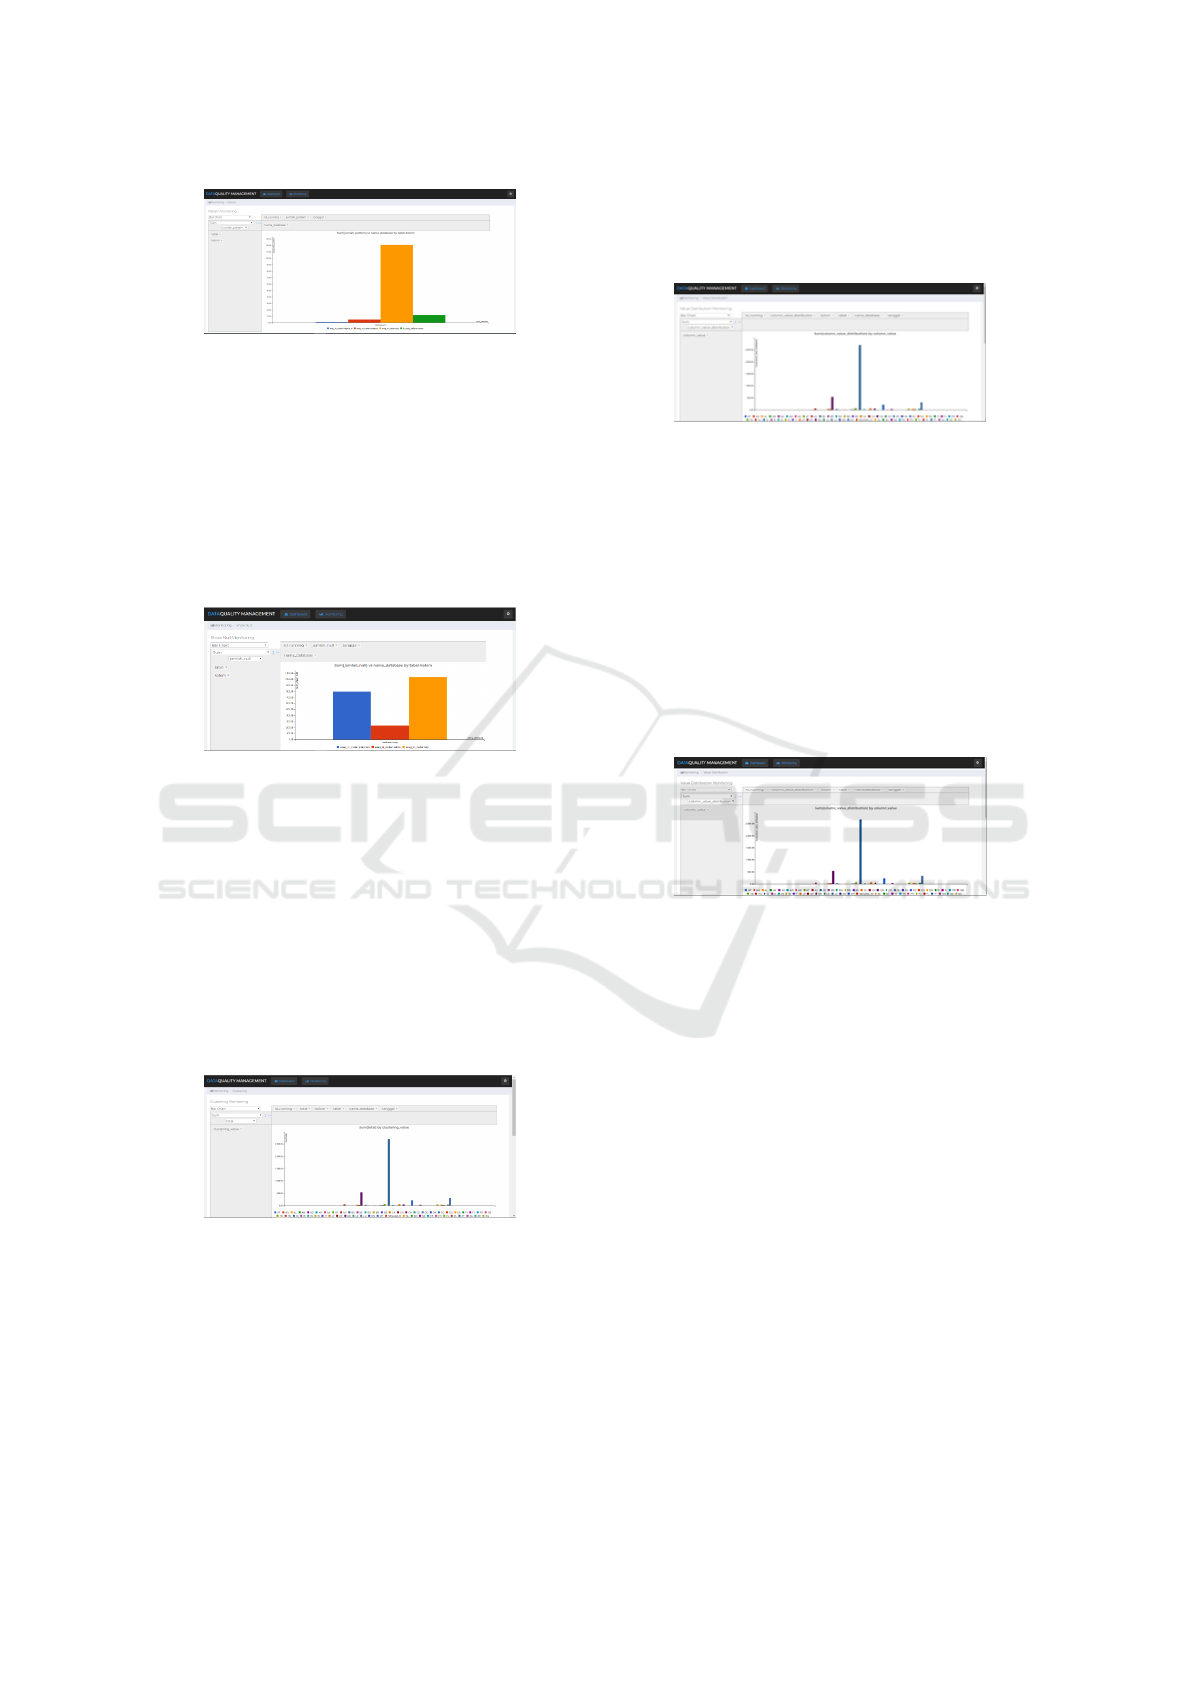
Figure 8: Pattern Monitoring Page
4.2.8 Show Null Monitoring Page
Show null monitoring page on Figure. 9 show infor-
mation about the results of show null data profiling
feature. In this page, users can monitor the results of
show null data profiling based on pivot columns pro-
vided such as based on running ID, table name, col-
umn name, database name, null number, and date.
Figure 9: Show Null Monitoring Page
4.2.9 Clustering Monitoring Page
This clustering monitoring page shows information
about the results of running clustering profiling fea-
tures. On this page, a pivot table is displayed whose
data is taken from the database. Users can observe
the results of clustering profiling based on the pivot
columns provided such as based on ID running, table
name, column name, database name, date, clustering
value, and total as shown in Figure. 10.
Figure 10: Clustering Monitoring Page
4.2.10 Data Completeness Monitoring Page
The data completeness monitoring page on Figure. 11
present information about the results of running data
completeness profiling. On this page, a pivot table
is displayed whose data is taken from the database.
Users can observe the results of data completeness
profiling based on the pivot columns. The pivot ta-
ble presents the data such as running ID, table name,
column name, database name, date, and type.
Figure 11: Data Completeness Monitoring Page
4.2.11 Value Distribution Monitoring Page
The value distribution monitoring page presents the
results of the value distribution profiling. On this
page, a pivot table is displayed whose data is taken
from the database. Users can monitor the results
of value distribution profiling based on the pivot
columns provided such as based on running ID, ta-
ble name, column name, database name, date, column
value, column value distribution as shown in Figure.
12.
Figure 12: Value Distribution Monitoring Page
4.3 Testing
Testing on applications use two testing method, they
are unit testing and usability testing. A unit testing
performed by developers, while the second is usabil-
ity testing conducted by an expert user. For the mea-
surement method in usability testing uses a Likert.
Usability testing measures applications with user in-
terface and functionality. The result of unit testing is
there are no bugs found in the application. The result
of the usability testing as shown in Figure. 13
ICCETIM 2019 - International Conference on Creative Economics, Tourism Information Management
218
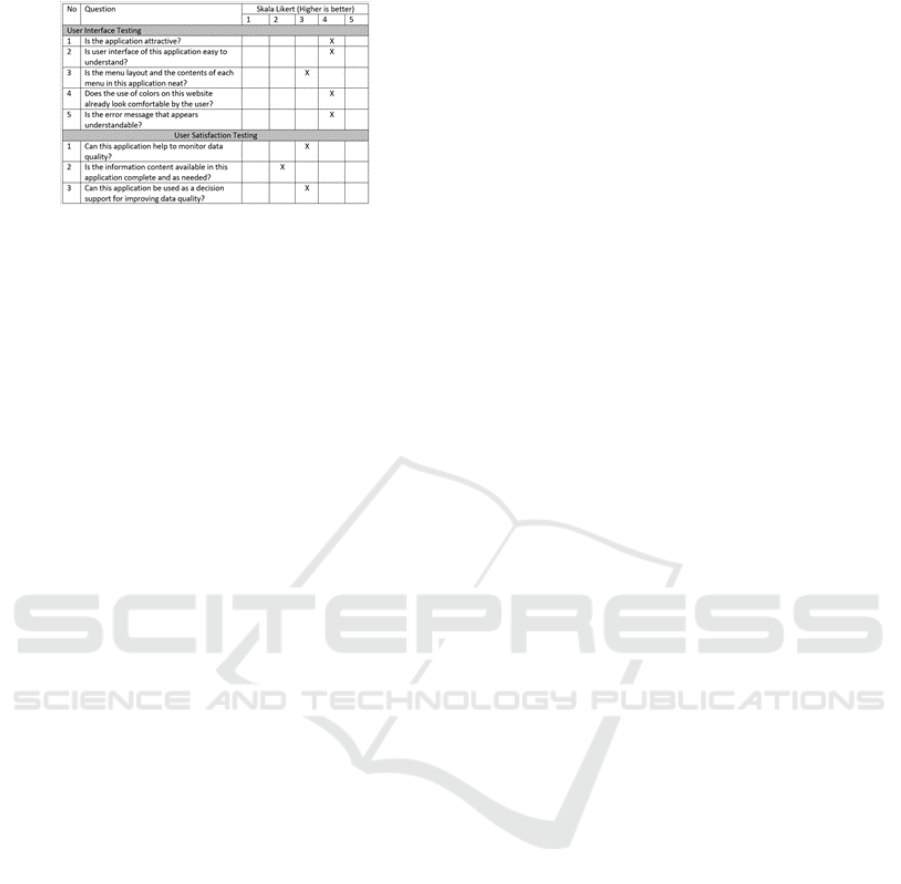
Figure 13: Usability Testing of Data Quality Monitoring
Application
5 CONCLUSIONS
Based on this research can be concluded this data
quality monitoring application is just a prototype be-
cause there is a lack of analysis in decision making
and the dashboard only showing information from
each profiling. Presentation of visualization and
features in the data quality monitoring application
made with the pureshare development method that
starts from identifying needs, identifying systems and
data, refinement prototypes, and implementing appli-
cations that have features such as dashboard, report-
ing, and monitoring. The application proposed in
the study case has been made and adapted to the ob-
ject of research. With the proposed application, the
government agency used as the research object can
monitor data quality based on five profiling parame-
ters, there are pattern profiling, show null profiling,
clustering profiling, data completeness profiling, and
value distribution profiling. The research we are cur-
rently working on is the process of completing the de-
velopment of data quality management at the stage of
data cleansing, data integration, data quality monitor-
ing in another profiling parameters, and increasing the
performance for this application.
REFERENCES
Abedjan, Z., Golab, L., and Naumann, F. (2016). Data
profiling. In 2016 IEEE 32nd International Confer-
ence on Data Engineering (ICDE), pages 1432–1435.
IEEE.
Amethyst, S., Kusumasari, T., and Hasibuan, M. (2018).
Data pattern single column analysis for data profiling
using an open source platform. In IOP Conference
Series: Materials Science and Engineering, volume
453, page 012024. IOP Publishing.
Apel, D., Behme, W., Eberlein, R., and Merighi, C. (2015).
Datenqualit
¨
at erfolgreich steuern: Praxisl
¨
osungen f
¨
ur
Business-intelligence-Projekte. dpunkt. verlag.
Brackett, M. and Earley, P. S. (2009). The dama guide to the
data management body of knowledge (dama-dmbok
guide).
Cai, L. and Zhu, Y. (2015). The challenges of data quality
and data quality assessment in the big data era. Data
science journal, 14.
Ehrlinger, L. and W
¨
oß, W. (2017). Automated data qual-
ity monitoring. In Proceedings of the 22nd MIT In-
ternational Conference on Information Quality (ICIQ
2017), pages 15–1.
Herzog, T. N., Scheuren, F. J., and Winkler, W. E. (2007).
Data quality and record linkage techniques. Springer
Science & Business Media.
Judah, S. and Friedman, T. (2014). Magic quadrant for data
quality tools. Gartner.
Kandel, S., Parikh, R., Paepcke, A., Hellerstein, J. M., and
Heer, J. (2012). Profiler: Integrated statistical analysis
and visualization for data quality assessment. In Pro-
ceedings of the International Working Conference on
Advanced Visual Interfaces, pages 547–554.
Leonard, K. (2018). The role of data in business.
Panian, Z. (2010). Some practical experiences in data gov-
ernance. World Academy of Science, Engineering and
Technology, 62(1):939–946.
Analysis and Design of Data Quality Monitoring Application using Open Source Tools: A Case Study at a Government Agency
219
