Customer Loyalty Classification with RFM and Na
¨
ıve Bayes for Decision
Making in Indonesia E-Commerce Industry
Indra Ranggadara
1
, Ifan Prihandi
1
, Sfenrianto
2
and Nilo Legowo
2
1
Faculty of Computer Science, Mercu Buana University, Jl. Raya Meruya Selatan, Kembangan, Jakarta, 11650
2
Information Systems Management Department, BINUS Graduate Program – Master of Information Systems Management,
Bina Nusantara University, Jakarta, Indonesia 11480
Keywords:
Classification, Decision Making, E-commerce, Na
¨
ıve Bayes, RFM Model.
Abstract:
The problem faced by the e-commerce industry in determining customer loyalty is that it is challenging to
be classified because to set strategy in every year the company should define customers who are feasible in
terms of loyalty to the company. The differentiator in this study uses Naive Bayes as a classification method
in detail to the attributes that are tested and the customer is classified by the RFM method and in previous
studies that have been conducted by other researchers are still little discussing the combining of these two
methods between Naive Bayes and RFM, then positioning in this research between ecommerce business actors,
the business competition to get customer loyalty is very important as a basis for taking appropriate decision
making for stakeholders. Then the result from Naive Bayes is 62% feasible and not feasible 38% then assisted
by RFM method as data analysis to each customer based on segmentation use ”usage rate” attribute on data so
that with processed data can make an essential reference in making decisions.
1 INTRODUCTION
In the era of technology developed at this time, the
use of data has massive potential in the business, es-
pecially the e-commerce industry. The growth of
the internet and electronic commerce (e-commerce) is
increasing due to technological advancements (Shia
et al., 2015). The factors that significantly affect
seller satisfaction will indirectly affect the seller loy-
alty and should always be considered by the com-
pany in ensuring the sustainability of the business as
commitment is the most contributor to sustainabil-
ity (SANTOSO and NAPITUPULU, 2018). This re-
search takes a sample in the e-commerce industry in
Indonesia, E-commerce business activities in Indone-
sia can be said competition is fierce, so there are still
many shortcomings encountered in its implementa-
tion (Firmansyah, 2017). Future economic growth
with digital-based, Indonesia in 2025 will be pre-
dicted to rise to USD $ 150 billion (Das et al., 2016).
In a 2016 survey conducted by Deloitte, Indonesian
participants identified three main advantages of on-
line shopping(Moore et al., 2018).
1. Practicality: The availability of products, home
delivery, and availability of information are the
most cited reasons for preferring to shop online.
2. More extensive product choice: Better range and
merchandising than products found in local stores
and markets.
3. Promotion: Rewards, loyalty points, and access to
exclusive content entice Indonesian consumers to
shop online.
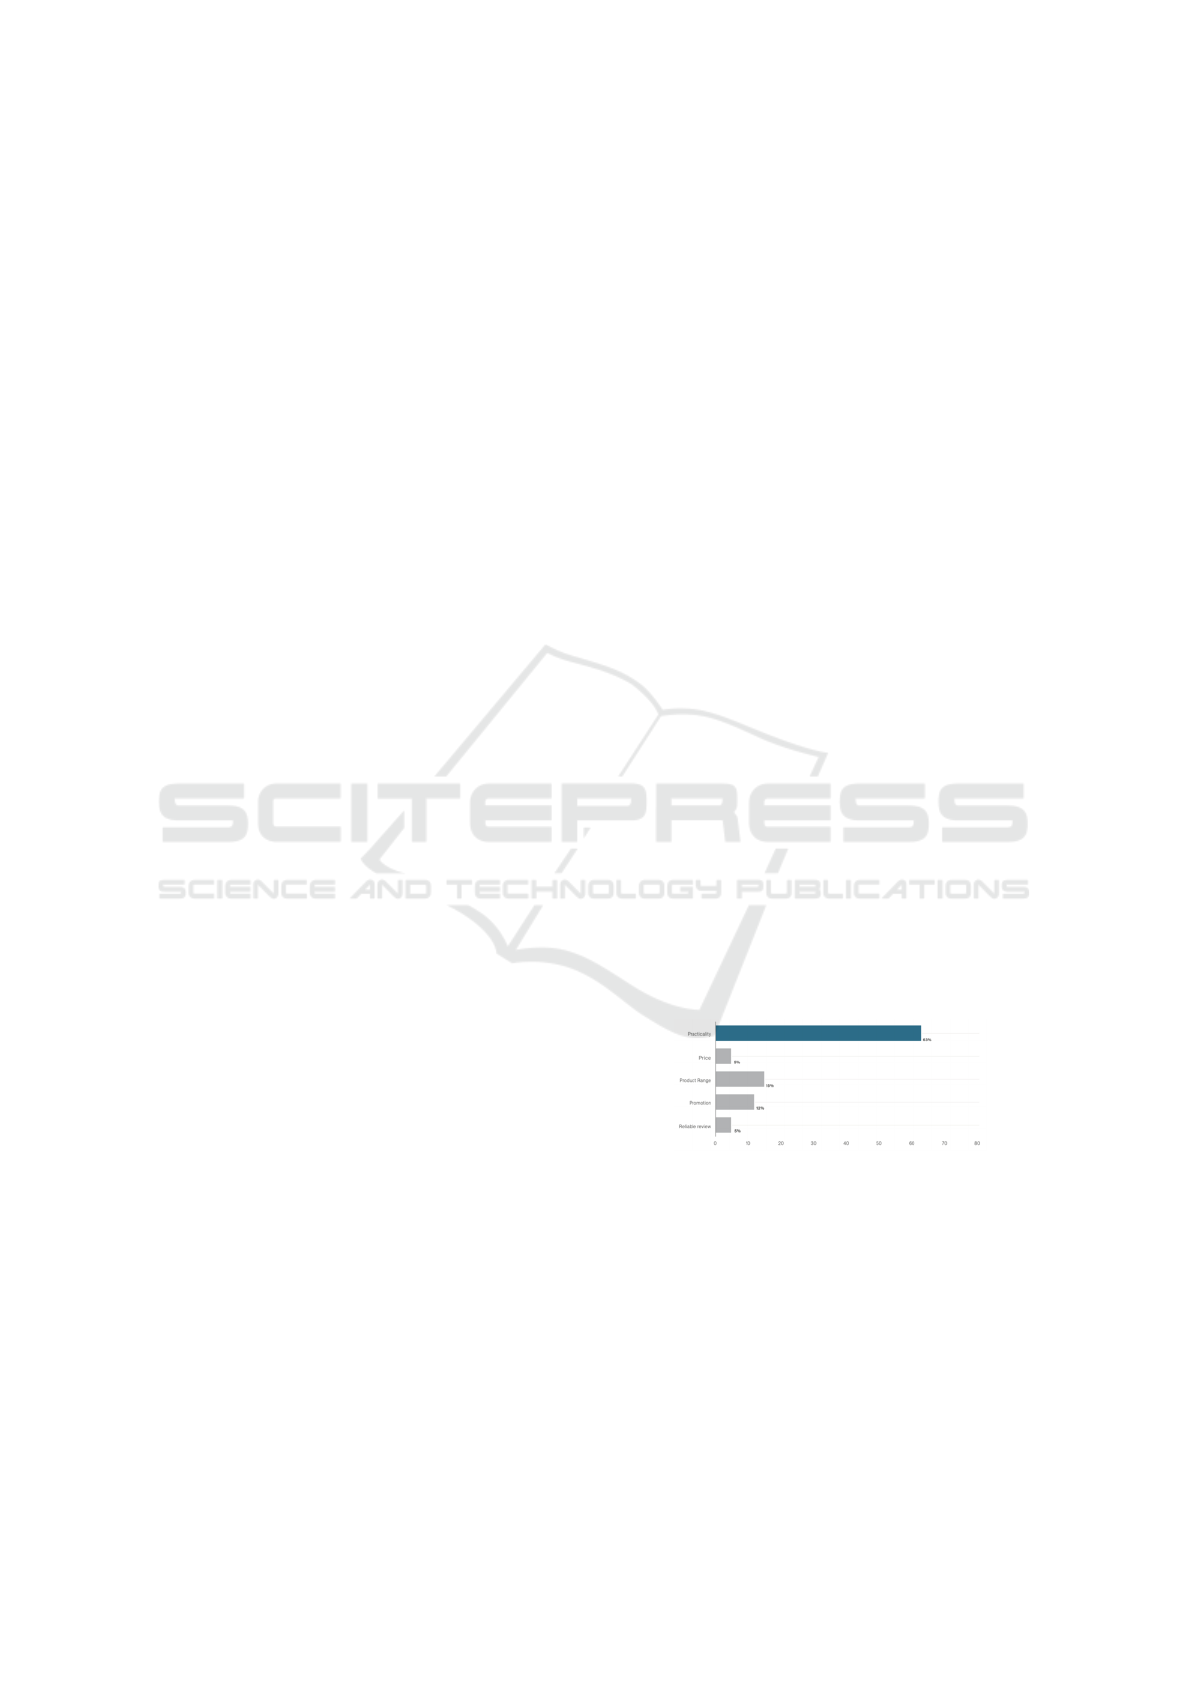
Figure 1: Reasoning Shopping Online in Indonesia
Based on data from Deloitte Consumer Insights,
the data found practicality of 65%, price 5%, Prod-
uct Range 15%, Promotion 12%, Reliable review 5%.
When viewed from the most significant value data,
consumers want the availability of products, home de-
livery, and availability of information as the basis for
loyalty to buy on e-commerce. From the results of
interviews obtained in determining customer loyalty
is very difficult to be classified to give awards in the
form of promotions every year to customers who are
feasible in terms of commitment to the company, be-
Ranggadara, I., Prihandi, I., Sfenrianto, . and Legowo, N.
Customer Loyalty Classification with RFM and Naïve Bayes for Decision Making in Indonesia E-Commerce Industry.
DOI: 10.5220/0009866201470152
In Proceedings of the International Conference on Creative Economics, Tourism and Information Management (ICCETIM 2019) - Creativity and Innovation Developments for Global
Competitiveness and Sustainability, pages 147-152
ISBN: 978-989-758-451-0
Copyright
c
2020 by SCITEPRESS – Science and Technology Publications, Lda. All rights reserved
147

cause of the many factors that support customers to
be loyal to the e-commerce industry. Customers and
companies can enjoy the benefits of a loyalty program
(Magatef and Tomalieh, 2015) and customer loyalty
is categorized into four types of categories, namely
no loyalty, loyalty, latent loyalty, and spurious loy-
alty, this category is seen based on two dimensions,
namely attitude and preferential treatment (Dick and
Basu, 1994), A typical approach uses Platinum, Gold,
and Silver tiers, typically based on purchase volumes.
The collaborated Na
¨
ıve Bayes as a data mining tech-
nique and RFM as analytical, and positioning in this
research between e-commerce business actors in busi-
ness competition is essential as a basis for taking ap-
propriate decision making for stakeholders. Based on
their duties, mining data is grouped into description,
estimation, prediction, classification, clustering, asso-
ciation (Larose, 2015), meanwhile, data mining is the
process of discovering interesting patterns and knowl-
edge from large amounts of data (Han et al., 2012).
This study uses the supervised learning for classifica-
tion method by using the Na
¨
ıve classifier statistically
(Bhosale and Ade, 2014). Another explanation about
the Na
¨
ıve Bayes classifier in determining the classifi-
cation of the right test data is finding the highest prob-
ability (Feldman et al., 2007). Then RFM as a clas-
sification analysis method, and to increase company
profits in the short term RFM can be used in predict-
ing responses (Baecke and Van den Poel, 2011). In di-
rect marketing and long history, practically the RFM
model is widely applied (Wei et al., 2010). Indeed
the results of data mining by combining customer de-
mographic variables can be done, but it is better to
use RFM analysis because it can improve customer
relations better (Nimbalkar and Shah, 2013). So the
objective in this research to experiment with the al-
gorithm of Na
¨
ıve Bayes classifier and RFM then use
customer loyalty data as decision making for stake-
holders.
2 PREVIOUS RESEARCH
Some of the previous research was explained in this
section to support the research conducted, for the first
research (Da et al., 2011) In this study based on the
quantitative combined value of the RFM model and
the Na
¨
ıve Bayesian algorithm that functions for the
classification of students and offers more decisions
and methods as feedback for learning resources by
presenting new construction methods. Second re-
search (Zu et al., 2012) to improve the quality of
the Na
¨
ıve Bayes classification method, it is neces-
sary to change the attribute group with the new at-
tribute group in presenting the extended Bayes model.
Third research (Nimbalkar and Shah, 2013) In RFM
analysis to manage customer relations in segmenta-
tion, a grouping of values is needed and is classified
into each customer segment that has been grouped.
Then the fourth research (Cheng and Chen, 2009)
Other studies use rough sets or LEM2 algorithms for
extracting classifications in CRM, and the resulting
RFM model becomes quantitative values as its at-
tributes and other K-means algorithms in grouping
customer values. Based on previous research that has
been explained, the differentiator in this study uses
Naive Bayes as a classification method in detail to the
attributes that are tested and the customer is classi-
fied by the RFM method and in previous studies that
have been conducted by other researchers are still lit-
tle discussing the combining of these two methods
between Naive Bayes and RFM then positioning in
this research between e-commerce business actors in
business competition is very important as a basis for
taking appropriate decision making for stakeholders.
3 MATERIAL AND METHOD
3.1 Research Stages
The knowledge discovery process is shown in as an
iterative sequence of the following steps (Han et al.,
2012):
1. Data Cleaning: Data cleaning is a process of dis-
appearing noise and inconsistent data or irrelevant
data
2. Data Integration: Data integration is the merg-
ing of data from various databases into one new
database.
3. Data Selection: Data that is in the database is of-
ten not all used, therefore only data suitable for
analysis to be taken from the database.
4. Data Transformation: Data is converted or com-
bined into a format suitable for processing in Data
Mining
5. Data Mining: It is a major process when methods
are applied to find knowledge valuable and hidden
from data. Several methods can be used based on
Data Mining grouping
6. Pattern Evaluation: To identify interesting pat-
terns into knowledge based found.
7. Knowledge Presentation: Is a visualization and
presentation of knowledge about the methods
used to obtain knowledge obtained by users.
ICCETIM 2019 - International Conference on Creative Economics, Tourism Information Management
148
Based on the steps that have been explained in
general, this study uses experimental research to an-
swer the problems encountered, described the steps as
follows:
1. The first stage is collecting data sets. After the
data set is collected, the next step is data prepro-
cessing. This process includes 2 things, namely
the labeling process and the process of transform-
ing data into CSV format. In labeling process, the
researcher gives a sign on the training data. The
mark given is feasible or not feasible. While data
transformation is done so that the data set can be
processed in Rapid Miner application.
2. The Second stage, preprocessing data sets are sep-
arated into 2, namely training data and testing
data. For separation of datasets is done by rapid
miner. Rapid Miner is set to split percentage filled
with 65%, so for data training amounts to 500 data
and for testing data is 10 data. The purpose of sep-
arating data sets is for researchers can test the re-
search that has been done using testing data based
on results from experiments using training data.
3. In the next process, the training method is using
training data. Method used is the Naive Bayes.
For testing using the Rapid Miner application.
From data training that has been labeled and trans-
forms the data into CSV data, the training data is
entered into the Rapid Miner for the training pro-
cess.
4. From the training process will produce a model
of each method. This model will be used to be
the basis from testing data processing. The re-
sults of testing will be evaluated aimed at obtain-
ing the information contained on the results of the
classification of the naive Bayes algorithms. In
the results of the classification obtained there are
several available measuring instruments, such as
confusion matrix. Confusion matrix is one mea-
suring instrument 2x2 matrix. The Confusion ma-
trix serves to get the correct classification of data
sets against feasible classes and not feasible on
the algorithm used. Each class predicted has four
possibilities, namely trues positives (TP) and true
negatives (TN) which indicate the accuracy of the
classification of algorithms used. If the prediction
that appears is incorrect, the output with a posi-
tive value and the negative original value is called
false positive (FP) and if the output prediction is
negative and the original positive value is called
false negative (FN).
The following table confusion matrix in the table 1.
Table 1: Confusion Matrix
Predicted Class
Yes No
Actual Yes a (TP) b (FN)
Class No c (FP) d (TN)
Confusion matrix can produce precision, recall
and accuracy. Here’s the explanation:
• Precision: The level of accuracy between the in-
formation requested by the user and the answer
given by system.
Precision =
T P
T P + FP
x100% (1)
• Recall: The level of success of the system in re-
discovering information
Recall =
T P
T P + FN
x100% (2)
• Accuracy: Proximity between predictive value
and actual value.
Accuracy =
T P + T N
T P + FN + FP + T N
x100% (3)
3.2 Data Set
For collecting data set in, this research needs criteria
and value on every basis of data set, which is ask some
question to the marketing division. The data set has
4, and the number dataset receives 3 million data and
this data from the internal database, and each attribute
has value, its show on table 2.
Table 2: Attributes of Customer Loyalty
Attributes Value
Loyalty
Status
Hard-core, Split Loyal,
Shifting Loyal, Switcher
Brand Funnel Aware, Ever tried, Recent
Trial, Occasional User, Reg-
ular User, Most Often Used
Consumer At-
titudes
Enthusiastic, Positive, Indif-
ferent, Negative, Hostile
Usage Rate Heavy, Medium, Light
3.3 Technique
This research use Na
¨
ıve Bayes as an algorithm to
calculate the probability to reduce computational
complexity into a simple multiplication of, and this
method only requires a small amount of training data
to determine the estimated parameters needed in the
Customer Loyalty Classification with RFM and Naïve Bayes for Decision Making in Indonesia E-Commerce Industry
149
classification process (Pattekari and Parveen, 2012).
An advantage of the naive Bayes classifier is that it
requires a small amount of training data to estimate
the parameters (means and variances of the variables)
necessary for classification (Pattekari and Parveen,
2012). Here’s the formula of Na
¨
ıve Bayes :
P(H|X) =
P(X|H).P(H)
PX
(4)
Then analysis use RFM, this model will classified
the value of customer using Recency (R), Frequency
(F), and Monetary (M) and the RFM model is es-
sential and can provide fruitful insight to researchers
and decision makers, then the RFM model has been
proven to be very successful in a variety of practice
areas (Wei et al., 2010) and the value of a customer
Ci can be represented as (Roshan and Afsharinezhad,
2017):
V (C
i
) = W
R
xR(C
i
) +W
M
xM(C
i
) (5)
4 RESULT AND DISCUSSION
This research using 500 data training, in this section
describes the number of labels that want to test on the
name ”FEASIBLE” (F) and ”NOT FEASIBLE” (NF),
the data getting from attributes of customer loyalty,
for example, show on table 3.
Table 3: Data Training
Name Lolayty
Sta-
tus
Brand.
Fun-
nel
Consu
mer
Atti-
tudes
Usage
Rate
Lab
el
Oyong
Liza
Split
Loyal
Ever
tried
Positive Medium NF
Ade
Herdi
Shifti
ng
Loyal
Recent
tried
Indiffre
nt
Light NF
Taufik
Afwan
Hard
core
Aware Enthu
siastic
Heavy F
Rinto
Um-
bara
Split
Loyal
Ever
tried
Positive Medium NF
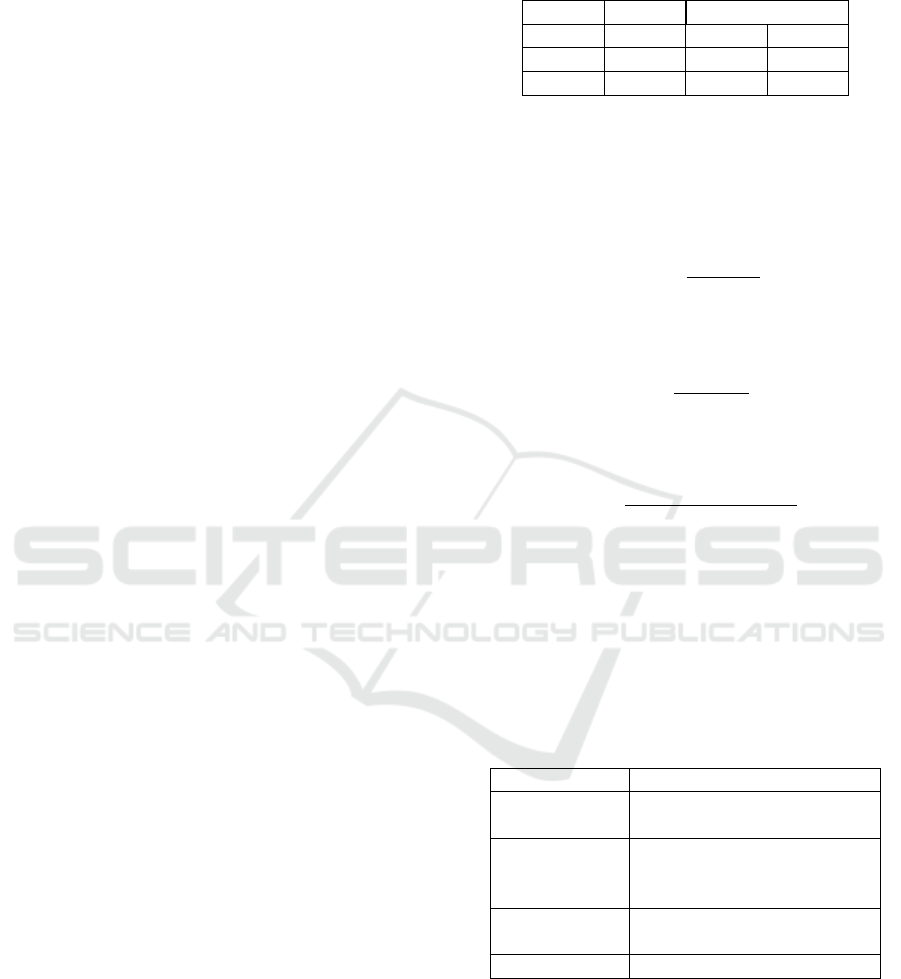
After defining the label then calculating the results
P (FEASIBLE) is 62%, and P (NOT FEASIBLE) is
38% from 100% in the CSV data which is used 500
training data and uses the results of processing using
rapid miner, and the results show on figure 2 is ob-
tained.
Then calculate the probability in every attribute to
indicate the classification by adjusting characteristics
Figure 2: Label Comparison Result
based on the value used in the attribute, using 100%
data that is identified per each value:
Table 4: Data Training
P(Loyalty
Status)
Feasible (%) Not Feasible
(%)
Hard-core 40% 30%
Split Loyal 11% 43%
Shifting
Loyal
23% 23%
Switcher 26% 4%
TOTAL 100% 100%
P(Brand Fun-
nel)
Feasible (%) Not Feasible
(%)
Aware 16% 32%
Ever tried 21% 12%
Recent Trial 15% 11%
Occasional
User
13% 12%
Regular User 23% 21%
Most Often
Used
12% 12%
TOTAL 100% 100%
P(Consumer
Attitudes)
Feasible (%) Not Feasible
(%)
Enthusiastic 12% 21%
Positive 35% 23%
Indifferent 12% 21%
Negative 12% 23%
Hostile 29% 12%
TOTAL 100% 100%
P(Usage
Rate)
Feasible (%) Not Feasible
(%)
Heavy 42% 32%
Medium 23% 43%
Light 35% 25%
TOTAL 100% 100%
Based on table 4, the result of every attribute has
100% complete and no missing in classification test
feasible and not feasible, which do some probabil-
ity in attribute loyalty status, brand funnel, Consumer
Attitudes, and Usage Rate. After doing some clas-
sification test in every attribute, so after that need to
ICCETIM 2019 - International Conference on Creative Economics, Tourism Information Management
150
calculate in data testing use 10 data from data testing
combine calculation with data training, show on table
5.
Table 5: Data Training
Label Feasible (%) Not Feasible
(%)
Feasible 0,2% 1,0%
Not Feasible 0,1% 0,2%
Feasible 0,2% 0,4%
Feasible 0,2% 0,3%
Not Feasible 0,4% 0,2%
Not Feasible 0,1% 1,5%
Feasible 0,1% 1,2%
Then, after doing some testing, the writer takes
measurements to find out and measure between the
level of prediction and actual precision, recall, and ac-
curacy of the tested data shown in the results of table
6.
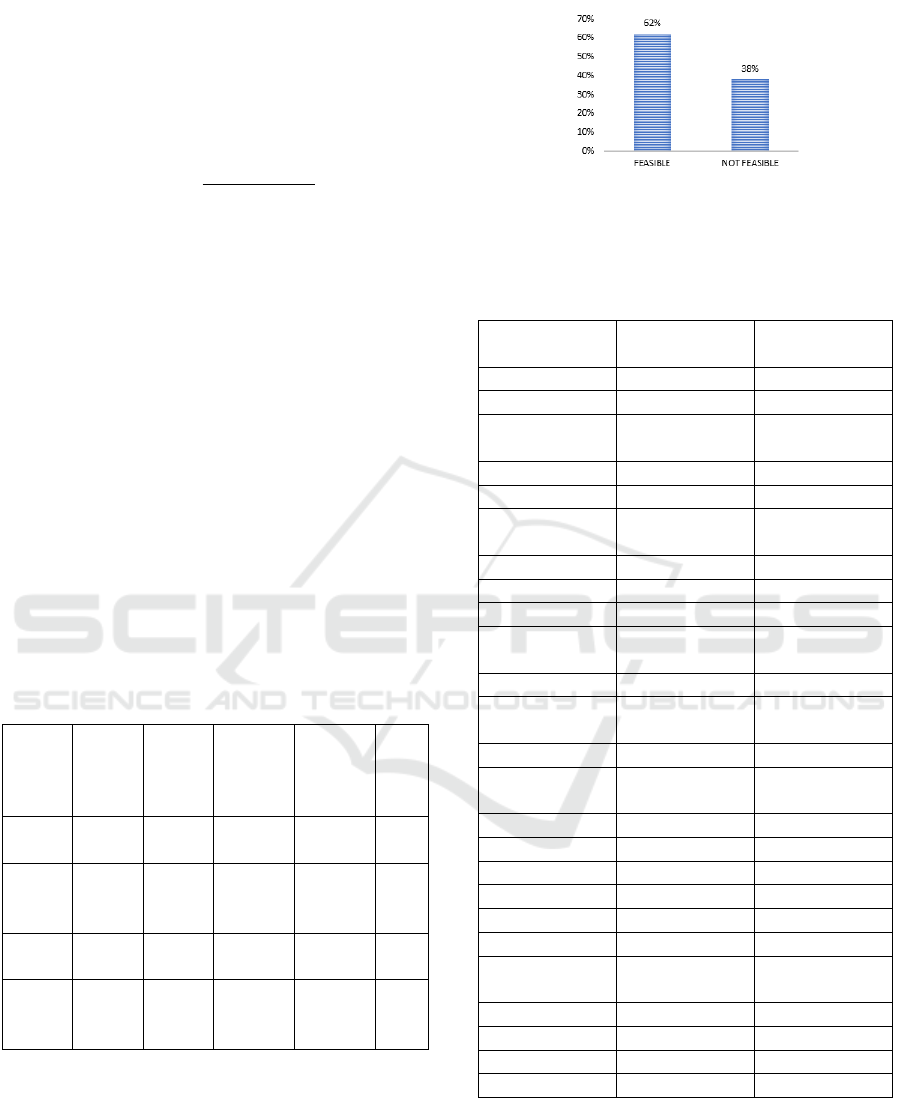
Table 6: Data Training
Precision Recall Accuracy
Before 40% 30% 42%
After 81.5% 87% 87%
The table 6, it was explained that the comparison
between before and after was much better using naive
Bayes. Data that has been tested before using Na
¨
ıve
Bayes is done manually with the same data of 500
data, but sorting and classifying it is very difficult to
do because the attributes possessed by the data are
very diverse and very numerous and so human errors
often occur in categorizing. The data show the re-
sult after use Na
¨
ıve Bayes, the value of precision is
81.5%, recall 87% and accuracy 87%, with this data
result can continue to decision making to stakeholders
to do some strategy in the company. After used Na
¨
ıve
Bayes as a data mining tools, then extract from data
has been classify use 3 classification which is heavy
with 3 point (green color), Medium with 2 point (or-
ange color), light with 1 (yellow color) point as and
not feasible, the result show on table 7 for example.
So far this research, there are several obstacles that
are made by the data selection attribute, diverse at-
tributes of the constraints within the classification and
the calculation will be much more complicated and
a lot that needs to be counted, so the best solution
is to directly define several attributes approximately
matches in order to perform the classification of cus-
tomer data is done.
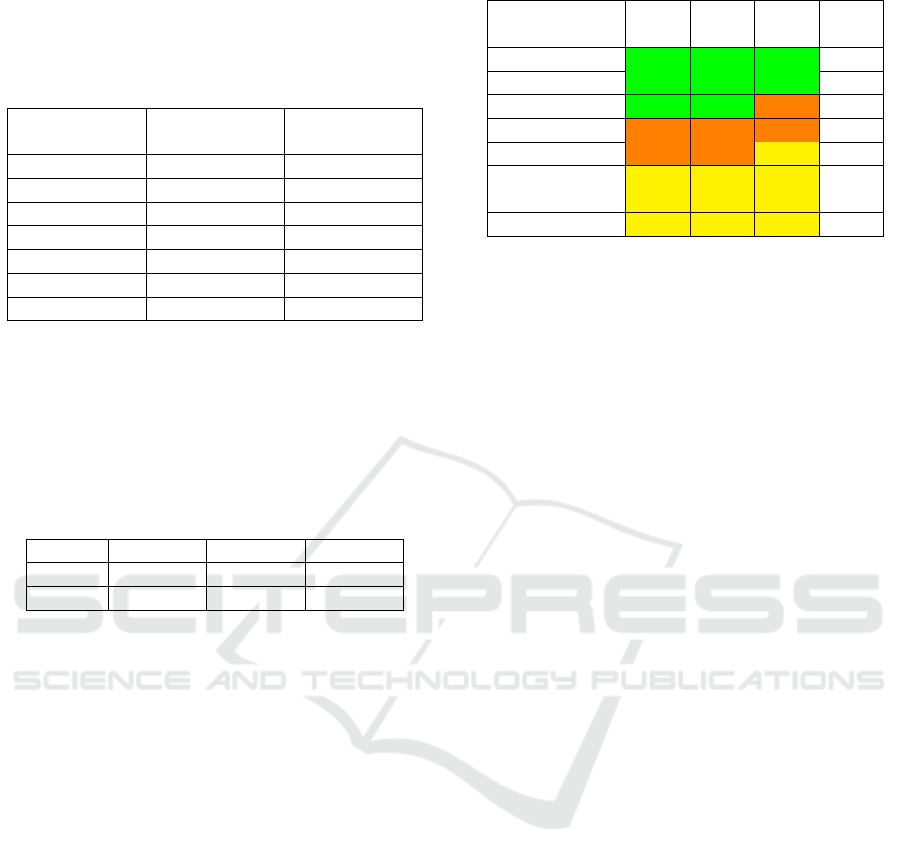
Table 7: Data Training
Customer
Name
Rece
ncy
Frequ
ency
Mone
tary
Score
Riki Yuliandri 3 3 3 9
Elfi Susanti 3 3 3 9
Emri Zelmi 3 3 2 5
Aditiawarman 2 2 2 5
Rozanya 2 2 1 3
Beni Munan-
dar
1 1 1 3
Yuriswan 1 1 1 3
5 CONCLUSION AND
RECOMMENDATION
In this study to determine the classification of loyal
customers, then there are some conclusions, namely:
1. Based on the two labels that have been defined
as the answer to problems for loyal customers,
there are from na
¨
ıve Bayes, get 62% feasible and
not feasible 38% based on 500 data processed
and transformed into CSV to get these 2 labels,
namely feasible and not feasible based on attribute
status loyalty, funnel brand, consumer attitudes,
and usage rate.
2. Then assisted by RFM method as data analysis to
the customer based on the segmentation of use of
the ”usage rate” attribute on data so that processed
primary data can be used as a reference in making
decisions for e-commerce Industry.
Based on the conclusions obtained, in this study
only used the specified attributes described in the
previous chapter as parameters in processing data.
Therefore the recommendations that need to be de-
veloped in this study are to be continued with other
attributes to enrich the results in the next survey and
it is also necessary to use different methods to make
the most accurate and efficient classification to be ap-
plied in the e-commerce industry.
Customer Loyalty Classification with RFM and Naïve Bayes for Decision Making in Indonesia E-Commerce Industry
151

REFERENCES
Baecke, P. and Van den Poel, D. (2011). Data augmentation
by predicting spending pleasure using commercially
available external data. Journal of intelligent infor-
mation systems, 36(3):367–383.
Bhosale, D. and Ade, R. (2014). Feature selection based
classification using naive bayes, j48 and support vec-
tor machine. International Journal of Computer Ap-
plications, 99(16):14–18.
Cheng, C.-H. and Chen, Y.-S. (2009). Classifying the seg-
mentation of customer value via rfm model and rs the-
ory. Expert systems with applications, 36(3):4176–
4184.
Da, M., Wei, W., Hai-guang, H., and Jian-he, G. (2011).
The application of bayesian classification theories in
distance education system. IJ Mod. Educ. Comput.
Sci, 4:9–16.
Das, K., Gryseels, M., Sudhir, P., and Tan, K. T. (2016).
Unlocking indonesia’s digital opportunity. McKinsey
& Company, pages 1–28.
Dick, A. S. and Basu, K. (1994). Customer loyalty: toward
an integrated conceptual framework. Journal of the
academy of marketing science, 22(2):99–113.
Feldman, R., Sanger, J., et al. (2007). The text mining hand-
book: advanced approaches in analyzing unstruc-
tured data. Cambridge university press.
Firmansyah, A. (2017). Overview of implementation
constraints of e-commerce in indonesia. Jurnal
Masyarakat Telematika Dan Informasi, 8(2):127–136.
Han, J., Kamber, M., and Pei, J. (2012). Data mining: con-
cepts and techniques, waltham, ma. Morgan Kaufman
Publishers, 10:978–1.
Larose, D. T. (2015). Data mining and predictive analytics.
John Wiley & Sons.
Magatef, S. G. and Tomalieh, E. F. (2015). The impact of
customer loyalty programs on customer retention. In-
ternational Journal of Business and Social Science,
6(8):78–93.
Moore, B., Akib, K., and Sugden, S. (2018). E-commerce
in indonesia: A guide for australian business.
Nimbalkar, D. D. and Shah, P. (2013). Data mining using
rfm analysis. International Journal of Scientific & En-
gineering Research (IJSRE), 4(12):940–943.
Pattekari, S. A. and Parveen, A. (2012). Prediction sys-
tem for heart disease using na
¨
ıve bayes. Interna-
tional Journal of Advanced Computer and Mathemat-
ical Sciences, 3(3):290–294.
Roshan, H. and Afsharinezhad, M. (2017). The new ap-
proach in market segmentation by using rfm model.
Journal of applied research on industrial engineering,
4(4):259–267.
SANTOSO, G. J. A. and NAPITUPULU, T. A. (2018). Fac-
tors affecting seller loyalty in business emarketplace:
A case of indonesia. Journal of Theoretical & Applied
Information Technology, 96(1).
Shia, B. C., Chen, M., Ramdansyah, A. D., Wang, S., et al.
(2015). Comparison of decision making in adopting e-
commerce between indonesia and chinese taipei (case
study in jakarta and taipei city). American Journal of
Industrial and Business Management, 5(12):748.
Wei, J.-T., Lin, S.-Y., and Wu, H.-H. (2010). A review of the
application of rfm model. African Journal of Business
Management, 4(19):4199.
Zu, Q., Wu, T., and Wang, H. (2012). A multi-factor cus-
tomer classification evaluation model. Computing and
Informatics, 29(4):509–520.
ICCETIM 2019 - International Conference on Creative Economics, Tourism Information Management
152
