
Relationship between Consumption of Caffeine and Food with Sleep
Quality in Students of SMA Perguruan Al-Azhar
Medan Year 2018
Nithiya Ravaandran
1
, Arlinda Sari Wahyuni
1*
1
Faculty of Medicine, Universitas Sumatera Utara
Jl. Abdul Hakim No.1, Padang Bulan,
Medan Baru, Kota Medan, Sumatera Utara 20222
Keywords: Sleep Quality, Sleep Disorders, Caffeine, Food and Students in SMA Perguruan Al-Azhar Medan
Abstract: Sleep not only has an impact on physical and emotional development but also closely related to the
cognitive functions of learning and attention. Consumption of caffeine and food can cause sleep disorders
and poor sleep quality. This study was conducted to determine the relationship between the consumption of
caffeine and food with sleep quality in students of SMA Perguruan Al-Azhar Medan. The methodology of
this research is analytic with a cross-sectional design. Sleep quality was assessed by the Pittsburgh Sleep
Quality Index (PSQI) questionnaire and consumption of caffeine and food was assessed by the Food
Frequency Questionnaire (FFQ). The sampling technique is probability sampling using simple random
sampling. 86 people (86%) had poor sleep quality and 14 people (14%) good sleep quality. Consumption of
coffee, tea, energy drinks, rice, bread, sweet potatoes, noodles, beef, chicken, mutton, chicken eggs, fish,
tempeh or tofu, nuts, full cream milk, cheese, vegetables, fruits, fast food , fried foods, soft drinks and sweet
drinks with sleep quality have a value of p> 0,05. Consumption of vegetable oil, butter and coconut milk
with sleep quality has a value of p <0,05. This study shows there is a relationship between the consumption
of vegetable oil, butter and coconut milk with the quality of sleep and there is no relationship between
consumption of coffee, tea, energy drinks, rice, bread, sweet potatoes, noodles, beef, chicken, mutton,
chicken eggs, fish, Tempe or tofu, nuts, full cream milk, cheese, vegetables, fruits, fast food, fried foods,
soft drinks and sweet drinks with sleep quality.
1 INTRODUCTION
Sleep not only has an impact on physical and
emotional development but also is closely related to
the cognitive functions of learning and attention
(Kaplan and Sadock, 2015). In 2011, the National
Sleep Foundation in America, through its research,
said that more than a third (36%) of young adults
from the age of 18-29 were reported having
difficulty getting up early. Nearly a quarter of young
adults (22%) are often late for class or work because
of difficulty getting up early. 40% of young adults
also complain of drowsiness when working at least
twice a week or more (Sulistiyani, 2012). Research
in Indonesia on junior high school students aged 12-
15 years in East Jakarta found the prevalence of
sleep disorders was 62,9% using the Sleep
Disturbance Scale for Children (SDSC) (Haryono,
2009).
Research in the United States shows that
there are around 75-98% of adolescents who
consume at least one caffeinated drink a day (NSF,
2006). The young generation in Indonesia, in the
morning automatically orders various energy-
enhancing drinks and caffeinated soda. This means
that many young people in Indonesia have sleeping
difficulties and poor quality of sleep patterns
(Prasadja, 2009).
A study in the Journal of Clinical Sleep
Medicine found that food consumed could actually
affect sleep. Consumption of foods with a higher
portion of saturated fat and sugar requires more time
to fall asleep at night (Japardi, 2002). Consumption
of energy drinks and sugary drinks is associated with
poor sleep quality (St-Onge, 2016). The purpose of
this study was to determine the relationship between
the consumption of caffeine and food with sleep
quality in students of SMA Perguruan Al-Azhar
Medan.
130
Ravaandran, N. and Wahyuni, A.
Relationship between Consumption of Caffeine and Food with Sleep Quality in Students of SMA Perguruan Al-Azhar Medan Year 2018.
DOI: 10.5220/0009861901300136
In Proceedings of the 2nd International Conference on Tropical Medicine and Infectious Disease (ICTROMI 2019), pages 130-136
ISBN: 978-989-758-469-5
Copyright
c
2020 by SCITEPRESS – Science and Technology Publications, Lda. All rights reserved
2 METHODS
The design of this study is analytic with a cross-
sectional approach. The population of this research
is students of SMA Perguruan Al-Azhar Medan who
are undergoing education at SMA Plus Al-Azhar
Medan, students who live in the school hostel.
Sampling uses probability sampling and simple
random sampling. Data retrieval was carried out in
an interview using a questionnaire. The Pittsburgh
Sleep Quality Index (PSQI) questionnaire and the
Food Frequency Questionnaire (FFQ) were used to
retrieve data. Data analysis was done by Chi-Square
test and data processing using SPSS.
3 RESULTS AND DISCUSSION
During this period, a total of 58 core biopsy actions
were carried out. Of those, 43 were guided using CT
scan and 15 patients were guided with the US. Table
1 describes the baseline characteristics of patients.
Table 1 Characteristic of respondents based on age.
Age
Frequency Percentage
(People)
(%)
14
9 9
15 41 41
16 32 32
17 16 16
18
2 2
Table 1 shows that the majority of respondents
are 15 years old as many as 41 students (41%) and
the minority is 18 years old, 2 students (2%).
Students aged 14 years consisted of 9 respondents
(9%), 16 years consisted of 32 respondents (32%)
and 17 years consisted of 16 respondents (16%).
Table 2 Characteristic of respondents by gender.
Gender Frequency Percentage
(People) (%)
Female 50 50
Male 50 50
Table 2 shows that female respondents consisted
of 50 students (50%) and male consisting of 50
students (50%).
Table 3 Sleep quality of respondents.
Sleep quality Frequency Percentage
(People) (%)
Poor 86 86
Good 14 14
Table 3 shows the majority of respondents,
namely 86 students (86%) had poor sleep quality
and 14 students (14%) had good sleep quality.
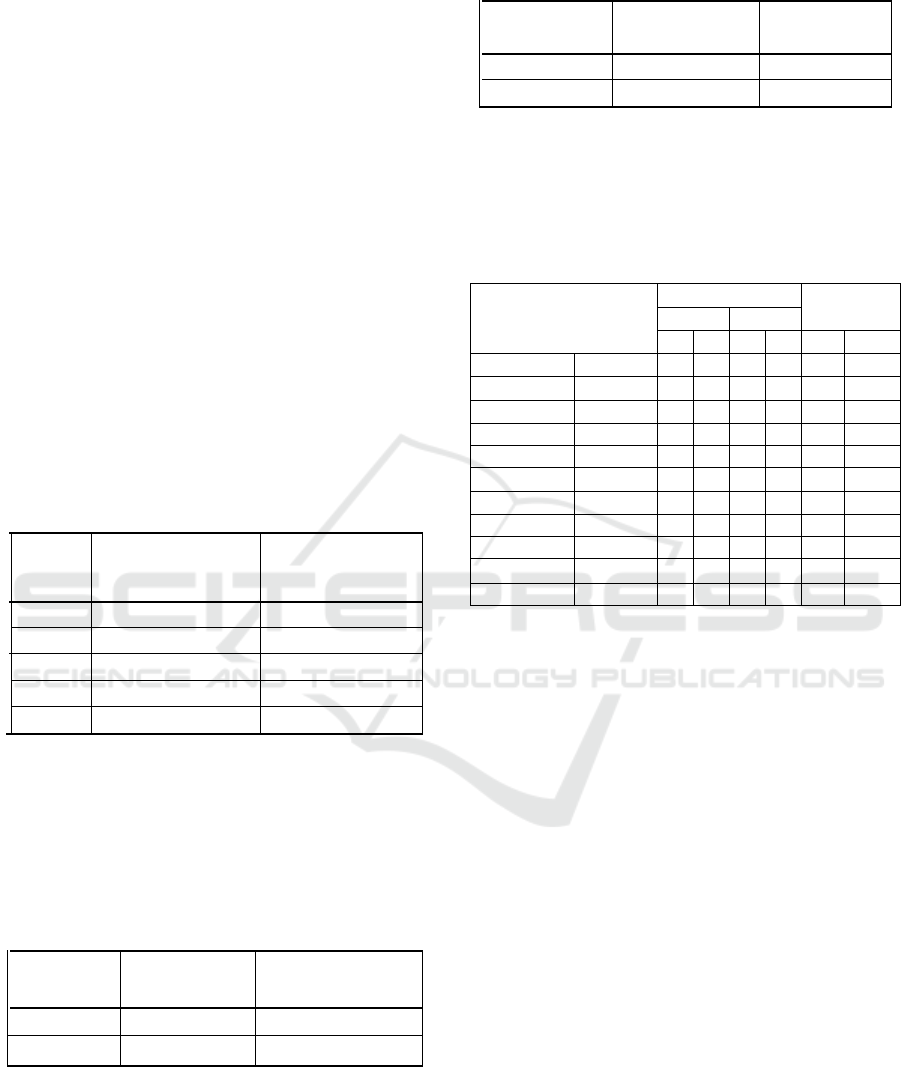
Table 4 Relationship between consumption of drinks
containing caffeine with sleep quality
Caffeine source
Sleep quality
Total
Poor Good
n
%
n % n
%
Coffee Rarely
76 76 13 13 89 89
Often
10 10 1 1 11 11
Total
86 86 14 14 100 100
Tea Rarely
49 49 9 9 58 58
Often
37 37 5 5 42 42
Total
86 86 14 14 100 100
Energy drink Rarely
59 59 10 10 69 69
Often
27 27 4 4 31 31
Total
86
86
14 14
100 100
Table 4 shows that 86 people (86%) had poor
sleep quality and 14 good sleep quality. 89 people
(89%) consumed coffee rarely and 11 people (11%)
often. The p-value is 0,619. 58 people (58%)
consumed tea rarely and 42 people (42%) often. The
p-value is 0,607. 69 people (69%) consumed energy
drinks rarely and 31 people (31%) often. The p-
value is 0,832.
Relationship between Consumption of Caffeine and Food with Sleep Quality in Students of SMA Perguruan Al-Azhar Medan Year 2018
131
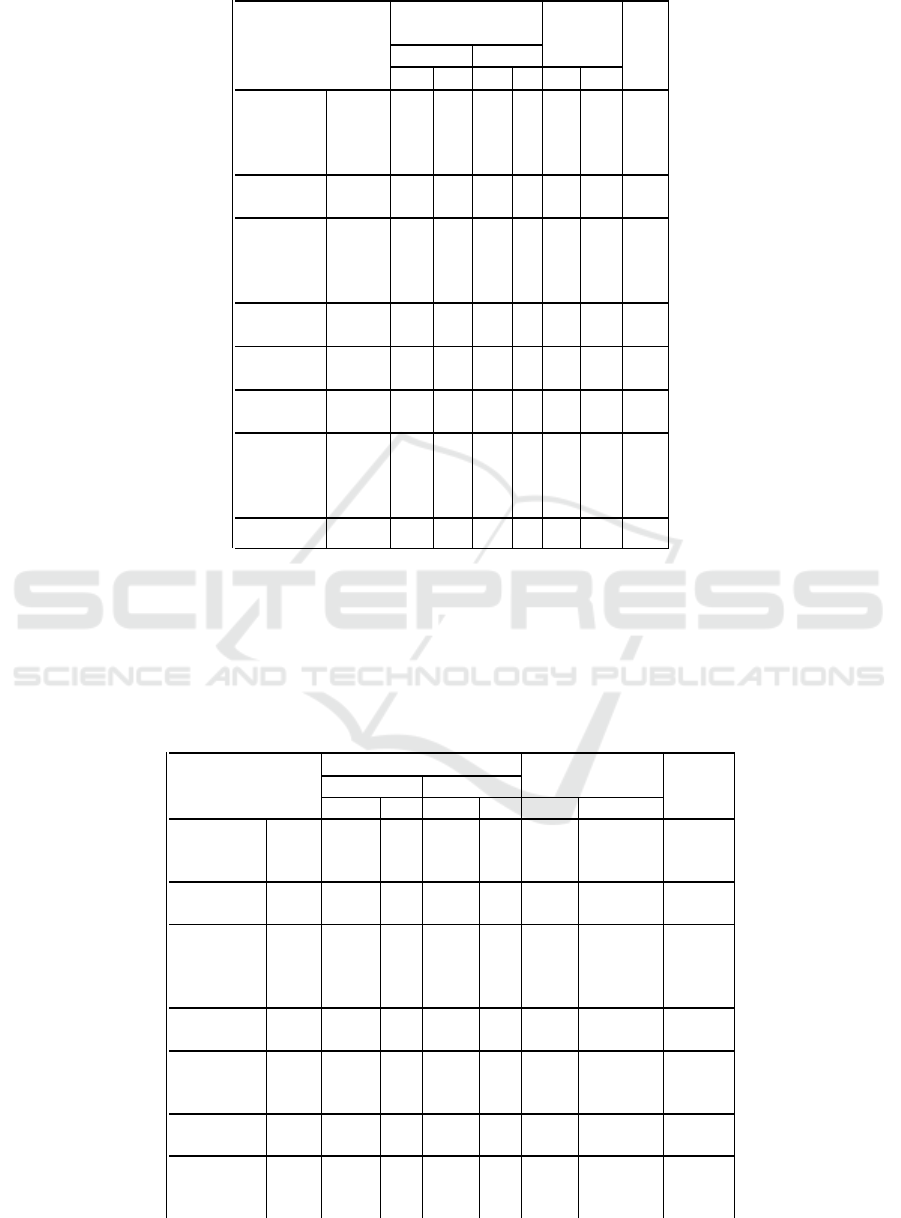
Table 5 Relationship between carbohydrate consumption and sleep quality.
Sleep
quality
Total p
Carbohydrate source
Poo
r
Goo
d
n%n%n%
1. Rice
Rarel
y
44
0
04 4
Often
2 82
14
14 96 96 0,410
Jumlah
686
14
4 100 100
2. Brea
d
Rarel
y
45 45
7
75252
Often
41 41
7
7 48 48 0,872
Jumlah
86 86
14
14 100 100
3. Sweet
Rarel
y
86 86
14
14 100 100
.
a
p
otato
6
4
40 0
Jumlah
86 86
14
14 100 100
4. Noodles
Rarel
y
76 76
14
14 90 90
Often
10 10
0
0 10 10 0,179
Total
86 86
14
14 100 100
Table 5 shows that 86 people (86%) had poor
sleep quality and 14 people (14%) good sleep
quality. 4 people (4%) consume rice rarely and 96
people (96%) often. The p-value is 0,410. 52 people
(52%) consume bread rarely and 48 people (48%)
often. The p-value is 0,872. The p-value for sweet
potatoes is not calculated because sweet potatoes are
constant because all respondents, 100 people (100%)
consume sweet potatoes rarely. 90 people (90%)
consume noodles rarely and 10 people (10%) often.
The p-value is 0,179.
Table 6 Relationship between protein consumption and sleep quality
Sleep quality
Total
p
Protein source
Poo
r
Goo
d
%
N
%
n
%
1. Beef
Rarel
y
2 82 13 13 95 95
Often
4
4 1 1 5
5 0,69
2
Total
86 86 14 14
100
100
2.
Rarely 41 41
44
45 45
Chicken
Often
45 45 10 10 55 55
0,18
3
Total
86 86 14 14
100
100
3. Mutton
Rarel
y
85 85 13 13 98 98
Often
1
1 1 1 2
2 0,13
8
Total
86 86 14 4
100
100
4.
Rarel
y
46 46
99
55 55
Chicken
egg
ICTROMI 2019 - The 2nd International Conference on Tropical Medicine and Infectious Disease
132
Often
0 40
55
45 45
0,45
1
Total
86 86 14 14
100
100
5. Fish
Rarel
y
19 19
55
24 24
Often
67 67
9 9
76 76
0,26
8
Total
86 86 14 14
100
100
6. Tem
p
e
Rarel
y
71 71 10 10 81 81
or Tofu
Often
15 15
4 4
19 19
0,32
5
Total
86 86 14 14
100
100
7. Nuts
Rarel
y
77 77 10 10 87 87
Often
9
944
13 13
0,06
2
Total
86 86 14 14
100
100
Table 6 shows that 86 people (86%) had poor
sleep quality and 14 people (14%) good sleep
quality. 95 people (95%) consume beef rarely and 5
people (5%) often. The p-value is 0,692. 45 people
(45%) consume chicken rarely and 55 people (55%)
often. The value of p is 0,183. 98 people (98%)
consume mutton rarely and 2 people (2%) often. The
value of p is 0,138. 55 people (55%) consume
chicken eggs rarely and 45 people (45%) often. The
value of p is 0,451. 24 people (24%) consume fish
rarely and 76 people (76%) often. The p-value is
0,268. 81 people (81%) consume Tempe or tofu
rarely and 19 people (19%) often. The value of p is
0,325. 87 people (87%) consume nuts rarely and 13
people (13%) often. The p-value is 0,062.
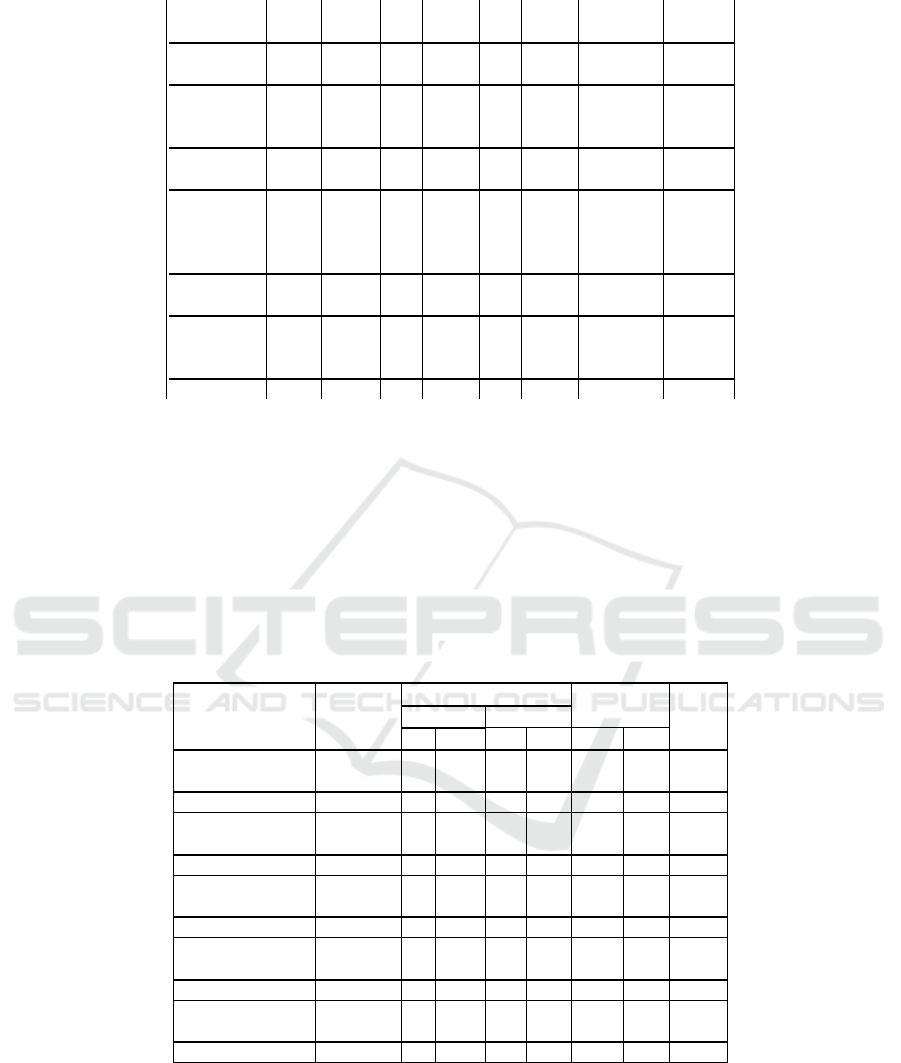
Table 7 Relationship between fat consumption a sleep quality.
Sleep quality Total p
Fat source
Poo
r
Goo
d
n
%
n%n%
1. Full cream mil
k
Rarel
y
949
88
57 57
Often
37 37
6 6
43 43
0,991
Total
86 86
14
14
100
100
2. Ve
g
etable oil Rarel
y
66 66
77
73 73
Often
20 20
7 7
27 27
0,037
Total
86 86
14
14
100
100
3. Cheese Rarel
y
77 77
10
10 87 87
0,062
Often
9 9
4 4
13 13
Total
86 86
14
14
100
100
4. Butte
r
Rarel
y
81 81
10
10 91 91
0,006
Often
5 5
4 4
9
9
Total
46 86
14
4
100
100
5.Coconut mil
k
Rarel
y
70 70
7
77 77
0,010
Often
6 16
7 7
23 23
Total
86 86
14
14
100
100
Table 7 shows that 86 people (86%) had poor
sleep quality and 14 people (14%) good sleep
quality. 57 people (57%) consume full cream milk
rarely and 43 people (43%) often. The p-value is
0,991. 73 people (73%) consume vegetable oil
rarely and 27 people (27%) often. The p-value is
0,037. 87 people (87%) consume cheese rarely and
13 people (13%) often. The p-value is 0,062. 91
people (91%) consume butter rarely and 9 people
(9%) often. The p-value is 0,006. 77 people (77%)
consume coconut milk rarely and 23 people (23%)
often. The value of p is 0,010.
Relationship between Consumption of Caffeine and Food with Sleep Quality in Students of SMA Perguruan Al-Azhar Medan Year 2018
133
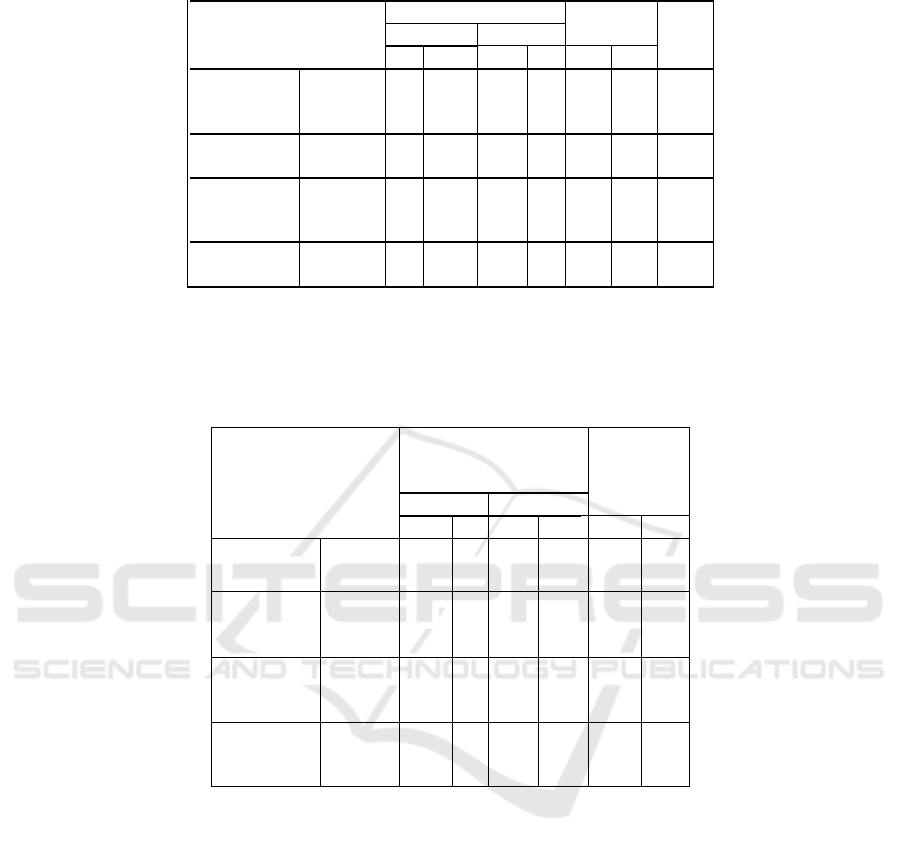
Table 8 Relationship between fiber consumption and sleep quality.
Fiber source
Sleep quality
Total
p
Poor Good
n
%
n
%
%
1. Vegetables
Rarely 25 25
1
1
1
26
0,083
Often
61 61 13 13 13 74
Total
86 86 14 14 14 100
2. Fruits
Rarely 64 64
8
8
8
72
Often
22 22
6
6
6
28
0,182
Total
86 86 14 14 14 100
Table 8 shows that 86 people (86%) had poor
sleep quality and 14 people (14%) good sleep
quality. 26 people (26%) consume vegetables rarely
and 74 people (74%) often. The p-value is 0,083. 72
people (72%) consume fruits rarely and 28 people
(28%) often. The value of p is 0,182.
Table 9: Relationship between beverage consumption and sleep quality
Beverage source
Sleep quality
Total
Poor Good
n
%
n
%
N
%
1. Softdrink
Rarely
58 8
11
11 69 69
Often
28 28 3 3 31 31
Total
86 86
14
14 100
100
2.Sweet drink
Rarely
37 37
6
6
43 43
Often
49 49
8
8
57
Total
86 86
14
14 100
100
Table 9 shows that 86 people (86%) had poor
sleep quality and 14 people (14%) good sleep
quality. 69 people (69%) rarely consume soft drinks
and 31 people (31%) often. The value of p is 0,404.
43 people (43%) rarely consume sweet drinks and
57 people (57%) often. The p-value is 0,991.
From the results of this study, it was found that
86 people (86%) had poor sleep quality and 14
people (14%) had good sleep quality. This is in
accordance with a study conducted by the National
Sleep Foundation in America which showed that
one-third (36%) of young adults from the age of 18-
29 years had difficulty getting up early, a quarter of
young adults (22%) were often late for work or class
because it is difficult to get up early and 40% of
young adults also complain of drowsiness when
working at least twice a week or more because they
experience sleep disorders (Sulistiyani, 2012).
Research conducted in Indonesia shows that junior
high school students aged 12-15 years in East
Jakarta found a prevalence of sleep disorders of
62,9% (Haryono, 2009). This is because adolescents
and young adults experience a number of changes
that often reduce sleep time such as lifestyle
demands, school and social activities that suppress
the time available to sleep (Lumantow et al., 2016).
In this study chi-square test was used to analyze
data. If the value of p <0,05 it can be concluded that
there is a significant relationship between the
consumption of caffeine and food with the quality of
sleep in students of SMA Perguruan Al-Azhar
Medan. The results of data analysis showed that
consumption of drinks containing caffeine, namely
coffee, tea, and energy drinks did not have a
significant relationship with sleep quality because of
the value of p> 0,05. Consumption of carbohydrate
ICTROMI 2019 - The 2nd International Conference on Tropical Medicine and Infectious Disease
134

sources, namely rice, bread, sweet potatoes, and
noodles does not have a significant relationship with
sleep quality because of the value of p> 0,05.
Consumption of protein sources, namely beef,
chicken, mutton, chicken eggs, fish, tempeh or tofu
and beans does not have a significant relationship
with sleep quality because of the value of p> 0,05.
The consumption of fat sources, namely full cream
milk and cheese does not have a significant
relationship with sleep quality because of the value
of p> 0,05. Consumption of fiber sources, namely
vegetables and fruits, snacks, fast food and fried
foods and sources of drinks, soft drinks and sweet
drinks have no significant relationship with sleep
quality because of the value of p> 0,05.
This is contrary to a study that showed that
caffeine binds to cell receptors in the brain and
prevents the reception of fatigue signals produced
by adenosine to keep individuals awake and alert.
The use of caffeine disrupts sleep patterns and long-
term use can cause poor sleep quality and long-term
adverse health effects (Snel and Lorist, 2011).
According to the American Society for Nutrition,
diets high in carbohydrates have lower sleep onset
latency (SOL). The effect of high carbohydrates on
changes in the stage of sleep is related to an increase
in serotonin synthesis. A low carbohydrate diet is
associated with difficulty maintaining sleep.
Consumption of a diet low in protein will limit
serotonin production and this will lead to longer
sleep onset latency (SOL). This will cause someone
to need a longer time to fall asleep at night. Other
studies show that consumption of fiber sources will
promote sleep because it increases melatonin
concentration and improves sleep quality (St-Onge
et al., 2016). A study shows that too much sugar in
the diet will increase blood sugar levels. This will
cause someone to get out of bed and go to the
bathroom all night to urinate and produce sleep
patterns that are inconsistent (NHLBI, 2011).
However, a study shows that caffeine
consumption should be no more than 200 mg per
day so as not to experience sleep disorders. Cannot
consume caffeine at least 4 hours before going to
bed. The consumption of the last major meal every
day 2 to 3 hours before going to bed will not provide
a sleep disorder (Wendte et al., 2003). Eat balanced
foods both for health and overall well-being. This is
because someone will have more energy during the
day and sleep better at night so as not to experience
sleep disturbances (Sediaoetama, 2008).
A study also showed that moderate caffeine
intake was not associated with health risks. Three 8
oz. cup of coffee (250 milligrams of caffeine) per
day is considered a moderate amount of caffeine. Six
or more 8 oz. coffee cups per day is considered
excessive caffeine intake and will have an effect. In
addition to consumption of caffeine and food,
alcohol, smoking, psychological disorders, health
problems, drugs and environmental factors such as
noise, lights that are too bright and temperatures that
are too cold or hot will cause sleep disturbances
(NSF, 2006).
A study also shows that it is still unknown
whether sleep affects food intake or food intake that
affects sleep. Control foods that contain fat, protein
and carbohydrates and high-energy foods do not
cause acute changes in sleep architecture (St-Onge,
2016).
4 CONCLUSION AND
SUGGESTION
Based on the results of the study, the researcher can
conclude that the demographic characteristics of
students in SMA Perguruan AL-Azhar Medan in this
study were 50 people (50%) women and 50 people
(50%) men. The majority of respondents are 15
years old, as many as 41 students (41%). 86 students
(86%) had poor sleep quality and 14 students (14%)
good sleep quality. There is no significant
relationship between consumption of coffee, tea,
energy drinks, rice, bread, sweet potatoes, noodles,
beef, chicken, mutton, chicken eggs, fish, Tempe or
tofu, nuts, full cream milk, cheese, vegetables ,
fruits, fast food, fried foods, soft drinks and sweet
drinks with sleep quality (p> 0.05). There was a
significant relationship between consumption of
vegetable oil, butter and coconut milk with sleep
quality (p <0.05). Students are expected to be able to
evaluate the consumption of caffeine and food and
reduce consumption of vegetable oil, butter, and
coconut milk in order to get good quality sleep. The
school can use the results of this study to regulate
the food of students at school.
REFERENCES
Haryono, A. 2009, ‘Prevalensi gangguan tidur pada
remaja usia 12-15 tahun di sekolah lanjutan tingkat
pertama’, vol. 11, no. 3, pp. 149-154.
Japardi, I. 2002, Gangguan Tidur, [Online], diakses 15
Maret 2018, tersedia di:
https://gudangarsipadibahmadi.files.w
ordpress.con/2007/07/gangguan-tidur.pdf
Relationship between Consumption of Caffeine and Food with Sleep Quality in Students of SMA Perguruan Al-Azhar Medan Year 2018
135

Kaplan & Sadock. 2015, Synopsis of Psychiatry:
Behavioral Sciences/Clinical Psychiatry, 9
th
edn,
Lippincott Williams, USA.
Lumantow, I., Rompas, S. & Onibala, F. 2016, Hubungan
Kualitas Tidur Dengan Tekanan Darah Pada Remaja
Di Desa Tombasian Atas Kecamatan
National Heart, Lung and Blood Institute 2011, ‘Your
guide to healthy sleep’, National Institutes of Health,
[Online], diakses 17 Maret 2018, tersedia di:
https://www.nhlbi.nih.gov/files/docs/p
ublic/sleep/healthy_sleep.pdf
National Sleep Foundation 2006, Sleep-Wake Cycle: Its
Physiology and Impact on Health, [Online], diakses
14 Maret 2018, tersedia di:
https://sleepfoundation.org/sites/defau
lt/files/SleepWakeCycle.pdf
Prasadja, A. 2009, Ayo Bangun Dengan Bugar Karena
Tidur Yang Benar, Hikamah, Jakarta.
Sediaoetama, A.D. 2008, Ilmu Gizi Mahasiswa dan
Profesi, Dian Rakyat, Jakarta.
Snel Jan & Lorist, M. 2011, ‘ Effects of caffeine on sleep
and cognition’, Progress in Brain Research, vol. 190,
no. 1, pp. 105-117.
St-Onge, M.P., Anja Mikic, Pietrolungo, E. 2016, ‘Effects
of diet on sleep quality’, American Society for
Nutrition, vol. 7, no. 1, pp. 938-949.
St-Onge, M.P., 2016, ‘ Fiber and saturated fat are
associated with sleep arousals and Slow Wave Sleep’,
Clinical Sleep Medicine, vol. 12, no. 1, pp. 19-24.
Sulistiyani, C. 2012, Beberapa Faktor yang Berhubungan
Dengan Kualitas Tidur Pada Mahasiswa Fakultas
Kedokteran, [Online], diakses 14 Maret 2018, tersedia
di: https://media.neliti.com/media/publica tions/ID-
beberapa-faktor-yang-berhubungan-dengan-kualitas-
tidur-pada-mahasiswa-fakultas-k.pdf
Wendte, R., Snel, J., & Tieges, Z. 2003, ‘Causes and
examples’, Missclassification of Caffeine Use, vol.
190, no. 3, pp. 1-20.
ICTROMI 2019 - The 2nd International Conference on Tropical Medicine and Infectious Disease
136
