
Combination of Fuzzy C-Means, Xie-Beni Index, and Backpropagation
Neural Network for Better Forecasting Result
Muttabik Fathul Lathief
1
, Indah Soesanti
1
and Adhistya Erna Permanasari
1
1
Departement of Electrical Engineering and Information Technology, Universitas Gadjah Mada, Yogyakarta, Indonesia
Keywords:
Clustering, fuzzy c-means, cluster validation, xie-beni index, backpropagation, forecasting.
Abstract:
Accuracy is one of the performance parameters of a method. This research proposes a combination of Fuzzy
C-Means (FCM) method with the Backpropagation (BP) method to improve forecasting performance in terms
of accuracy. BP algorithm is a supervised learning algorithm which is have good performance for pattern
recognition. In some researches, FCM is more efficient and clustering results are better than other methods.
However, FCM has a disadvantage that clustering results are affected by clustering configurations, such as
the number of clusters. Therefore it is necessary to do cluster validation. One of popular cluster validation
method is Xie-Beni (XB) index. In this paper, we propose a forecasting system by combining the validated
FCM algorithm using the XB index method with the BP algorithm. The data are grouped using FCM with
number of clusters 3, 4, 5, 6, 7, 8, 9, and 10. Then, the clustering results validated using XB and find the most
suited number of clusters for the data. Each cluster becomes the input of the BP neural network for forecasting
process. This research uses sales data of 49 types of products for 25 months.
1 INTRODUCTION
Fuzzy C-Means (FCM) algorithm is popular fuzzy
clustering algorithm (Yejun, 2015). In FCM algo-
rithm, each data can be a member of one or more clus-
ters with different membership degrees (Kumar et al.,
2018). Like other grouping algorithms, FCM deter-
mines the number of clusters (c) used as initial pa-
rameters . The initialization of c affects the results of
clustering (Duan et al., 2016). If initialization of c is
not optimal, it will has an impact on merging or sep-
arating one or more clusters (Kesemen et al., 2017).
Therefore, cluster validation is needed to find the op-
timal c for the data. The Xie-Beni index method (XB)
introduced by Xie and Beni is one of the popular clus-
ter validation methods (Singh et al., 2017). The XB
index method focuses on the proximity of the data in
one cluster and the distance between one cluster cen-
tre and the other. The smallest XB value indicates the
optimal number of clusters (Mota et al., 2017).
There are many researches that validate FCM us-
ing XB. Research (Muranishi et al., 2014) applied XB
method to validate clustering results of the Fuzzy Co-
clustering Model (FCCM), Fuzzy CoDok, FSKWIC,
and SCAD-2. The results of the validation using XB
compared with the results of partition evaluations us-
ing Partition Entropy (PE) index and Partition Coef-
ficient(PC) index. The research grouped text data set
which taken from a Japanese novel. The results shows
XB method is suitable implemented with the FCCM
method. PC and PE shows instability in number of
clusters, while the Xie-Beni index always consistently
shows that c = 5 gives the best result. Research (Kese-
men et al., 2017) compared the results of the cluster
validation using XB, PE, Pakhira-Bandyopadhyay-
Maulik (PBM) index, Fukuyama-Sugeno (FS) index.
This research used improved FCM, called FCM4DD
(Fuzzy C-Means for Directional Data) method for
clustering process. This research used directional data
of 76 turtles after its hatch. The data grouped us-
ing the FCM4DD method with c = 2, 3, 4, 5, 6, 7,
8, 9. Then, the clustering results were validated us-
ing the 5 validation methods above. All validation
methods show c = 2 is gives the best result. Research
(Mota et al., 2017) compared the results of cluster-
ing using FCM, K-Means method (KM), Gath-Geva
(GG), and Gustafson-Kessel (GK), and This research
applied XB method, PC, Partition Index (SC), and
Dunn Index method to validate the clustering result.
This study uses data taken from 42 farms in the state
of Kentucky, with variable pack moisture, tempera-
ture, total carbon, total nitrogen, carbon-nitrogen re-
lations, hygiene score, inequality value, and type of
image. The results shows that c = 6 gives the best
72
Lathief, M., Soesanti, I. and Permanasari, A.
Combination of Fuzzy C-Means, Xie-Beni Index, and Backpropagation Neural Network for Better Forecasting Result.
DOI: 10.5220/0009858200720077
In Proceedings of the International Conference on Creative Economics, Tourism and Information Management (ICCETIM 2019) - Creativity and Innovation Developments for Global
Competitiveness and Sustainability, pages 72-77
ISBN: 978-989-758-451-0
Copyright
c
2020 by SCITEPRESS – Science and Technology Publications, Lda. All rights reserved

result.
Backpropagation (BP) is a supervised learning al-
gorithm that is popularly used. BP has network ar-
chitecture consisting of input layer, hidden layer, and
output layer (Zhang and Jiang, 2009). There are
many researches that combine FCM with BP. Re-
search (Hicham et al., 2012) combined FCM with BP
to forecast sales models. The proposed approach is
divided into three stages: stage 1 recognizes trend
using the Winter’s Exponential Smoothing method,
stage 2 grouping using FCM, and stage 3 training
each cluster using BP. Compared to other Researches
that use hard clustering methods, this research that
used fuzzy clustering is able to improve the accuracy
of the forecasting system proposed. There are other
researches that combine FCM with BP for different
purposes. Research (Zhao et al., 2010) combined
FCM with BP for automatic segmentation of CT im-
ages of the heart. The research segmented images
using FCM. The results of the initial image segmen-
tation are used to train BP. The process is repeated
until all sliced images are segmented. The result of
the research indicates that the proposed method can
segment images efficiently. The research (Zhang and
Jiang, 2009) combined FCM with BP for vehicle type
pattern recognition. This research was divided into
three stages: stage 1 preliminary processing of images
and feature extraction, stage 2 grouping types of ve-
hicles using FCM, and stage 3 training data based on
clustering result and testing data using BP. The result
shows that combination of FCM and BP can recog-
nize vehicle types faster and has better accuracy.
Sometimes sales data doesn’t have a definite pat-
tern. The sales data is not seasonal or trend data types.
Sales on every month are not affected by sales in the
previous months. This makes data difficult to pre-
dict because data has no pattern and sometimes the
popular items and the unpopular items have the same
sales in a one month or more and will affect the pre-
diction. This problem can be solved by grouping the
items based on its sales. So, when the sales data fed
into neural network as input, data will become more
uniform. FCM has a good performance for grouping
data and XB can help improve the accuracy by pro-
viding optimal number of clusters. Combining FCM
and BP will improve BP’s performance, as some pre-
vious studies have suggested.
In this research, we propose a forecasting system
by combining the FCM algorithm validated using the
XB index method with the BP method. This research
is divided into three stages: stage 1 pre-processing
data and clustering data using FCM, stage 2 cluster
validation and selecting optimal cluster using the XB
method, and stage 3 training and testing or forecasting
using BP. This research uses sales data of 49 types of
products in the merchandise store for 25 months.
2 METHODS
2.1 Min-Max Normalization
The large difference in data values makes the value
range of a data set be wide which will affect the re-
sults of data mining. The normalization method can
be used to overcome this problem, so that the range of
the data set value is not too wide. Min-max normal-
ization is a linear normalization method that scales
values in the range between 0 to 1, or -1 to 1. Data in
matrix X can be normalized using equation (1).
V
0
=
v − min
x
max
x
− min
x
(new max
x
− new min
x
) + new min
x
(1)
In equation (1), v is the data that want to be nor-
malized, v’ is the normalized data, minx is the small-
est data, maxx is the largest data, new minx is the
smallest desired data, and new maxA is the biggest
desired data.
2.2 Fuzzy C-Means
The Fuzzy C-Means (FCM) is a fuzzy clustering algo-
rithm that groups data into clusters based on distance
of the data and the centroid. FCM is categorized into
soft clustering types, it means each data can be mem-
ber of more than one cluster. The membership degree
of data determines which cluster the data belong. The
FCM algorithm is :
1. Set the number of clusters (c), weight (w), max-
imum iteration, smallest desired error value (ξ),
objective function (Pt) for first iteration with the
initial value is 0, and the initial iteration (t) with
initial value is one (1).
2. Set the initial degree of membership randomly for
iteration 1. The degree of membership is µik, with
i = 1, 2, ..., n and k = 1, 2, ..., m.
3. Calculate the centroid (Vkj), with k = 1, 2, ..., c
and j = 1, 2, ..., m.
V
k j
=
Σ
n
i=1
((µ
ik
)
w
∗ X
i j
)
Σ
n
i=1
(µ
ik
)
w
(2)
4. Calculate the objective function in the iteration t
(Pt).
P
t
= Σ
n
i
= 1Σ
c
k=1
([Σ
m
j=1
(X
i j
−V
k j
)
2
](µ
ik
)
w
) (3)
Combination of Fuzzy C-Means, Xie-Beni Index, and Backpropagation Neural Network for Better Forecasting Result
73

5. Update the membership degree of each data in
each cluster.
µ
ik
=
[Σ
m
j=1
(X
i j
−V
k j
)
2
]
−1
w − 1
Σ
c
k=1
[Σ
m
j=1
(X
i j
−V
k j
)
2
]
−1
w−1
(4)
6. Check the stop condition, (— Pt - Pt-1 — ¡ ξ) or
(t ¿ maximum iteration), if fulfilled, then stop the
clustering process. But if not, then increase itera-
tion value t and repeat the process from step 3.
2.3 Xie-Beni Index
Xie and Beni introduced Xie-Beni (XB) index method
in 1991. XB index is focus on separation and com-
pactness. Separation is a measure of the distance be-
tween one cluster and another cluster and compact-
ness is a measure of proximity between data points
in a cluster. According to this method, the optimal
c is the one with the smallest XB value (VXB). The
function of this method is :
V
XB
=
Σ
c
i=1
Σ
n
j=1
µ
2
i j
||V
i
− X
j
||
2
nmin
i, j
||V
i
− X
j
||
2
(5)
2.4 Backpropagation Neural Network
Backpropagation Neural Network algorithm is a su-
pervised learning method which is usually used on
perceptron with many layers. There are two training
phases in this method, which are feed forward phase
and back propagation of error phase. The following is
backpropagation neural network algorithm (Puspitan-
ingrum, 2006) :
1. Step 0: determine the weight value randomly.
2. Step 1: if stop condition is wrong, do steps 2-9.
3. Step 2: for each vector training pair, do steps 3-8.
Feed forward phase
4. Step 3: each input node, xi, with i = 1, ..., n, re-
ceives an xi input signal and passes the signal to
all nodes in the hidden layer.
5. Step 4: each hidden node, zj, with j = 1, ..., p,
sums the input signal, using the equation:
z in
j
= v
0 j
+ Σ
n
i=1
X
i
V
i j
(6)
Calculate the output signal with the activation
function used, and send the signal to all nodes in
the output layer.
z
j
= f (z in
j
) (7)
6. Step 5: Each output node, Yk, with k = 1, . . . . . . ,
m, sums the input signal using the equation:
y in
k
= w
0k
+ Σ
p
j=1
z
j
w
jk
(8)
Then, calculate the output signal with the activa-
tion function:
y
k
= f (y in
k
) (9)
Back propagation of error phase.
7. Step 6: Each output node, Yk, with k = 1, . . . . . . ,
n, accepts the target pattern (tk) according to the
training input pattern.
δ
k
= (t
k
− y
k
) f
0
y in
k
(10)
Then calculate the weight changes:
∆W
jk
= aδ
k
z
j
(11)
Also calculate the bias changes:
∆W
0k
= aδ
k
(12)
8. Step 7: Each hidden node, Zj, with j = 1, ......, p,
sums the delta input δk from the previous node.
δ in
j
= Σ
m
k=1
δ
k
W
jk
(13)
Calculate the error :
δ
j
= δ in
j
f
0
(z in
j
) (14)
Calculate weight changes :
∆v
i j
= aδ
j
x
i
(15)
Update weight and bias :
∆v
0 j
= aδ
j
(16)
9. Step 8: Update weight and bias on output node.
w
jk
(new) = w
jk
(new − 1) + ∆w
jk
(17)
w
0k
(new) = w
0k
(new − 1) + ∆w
0k
(18)
Update weight and bias on hidden node.
v
jk
(new) = v
jk
(new − 1) + ∆v
jk
(19)
v
0k
(new) = v
0k
(new − 1) + ∆v
0k
(20)
10. Step 9: Test the stop condition, epoch reach maxi-
mum value, or error value smaller than predefined
minimum value.
ICCETIM 2019 - International Conference on Creative Economics, Tourism Information Management
74
3 PROPOSED FORECASTING
SYSTEM
In this research, we propose a forecasting system by
combining the validated FCM algorithm using the XB
index method with the BP algorithm. The proposed
method is divided into three stages: stage 1 normal-
izes data and clustering the data using FCM, stage 2
cluster validation using XB method and determining
the optimal c, and stage 3 training data and testing
data, or in this study case is forecasting, using BP.
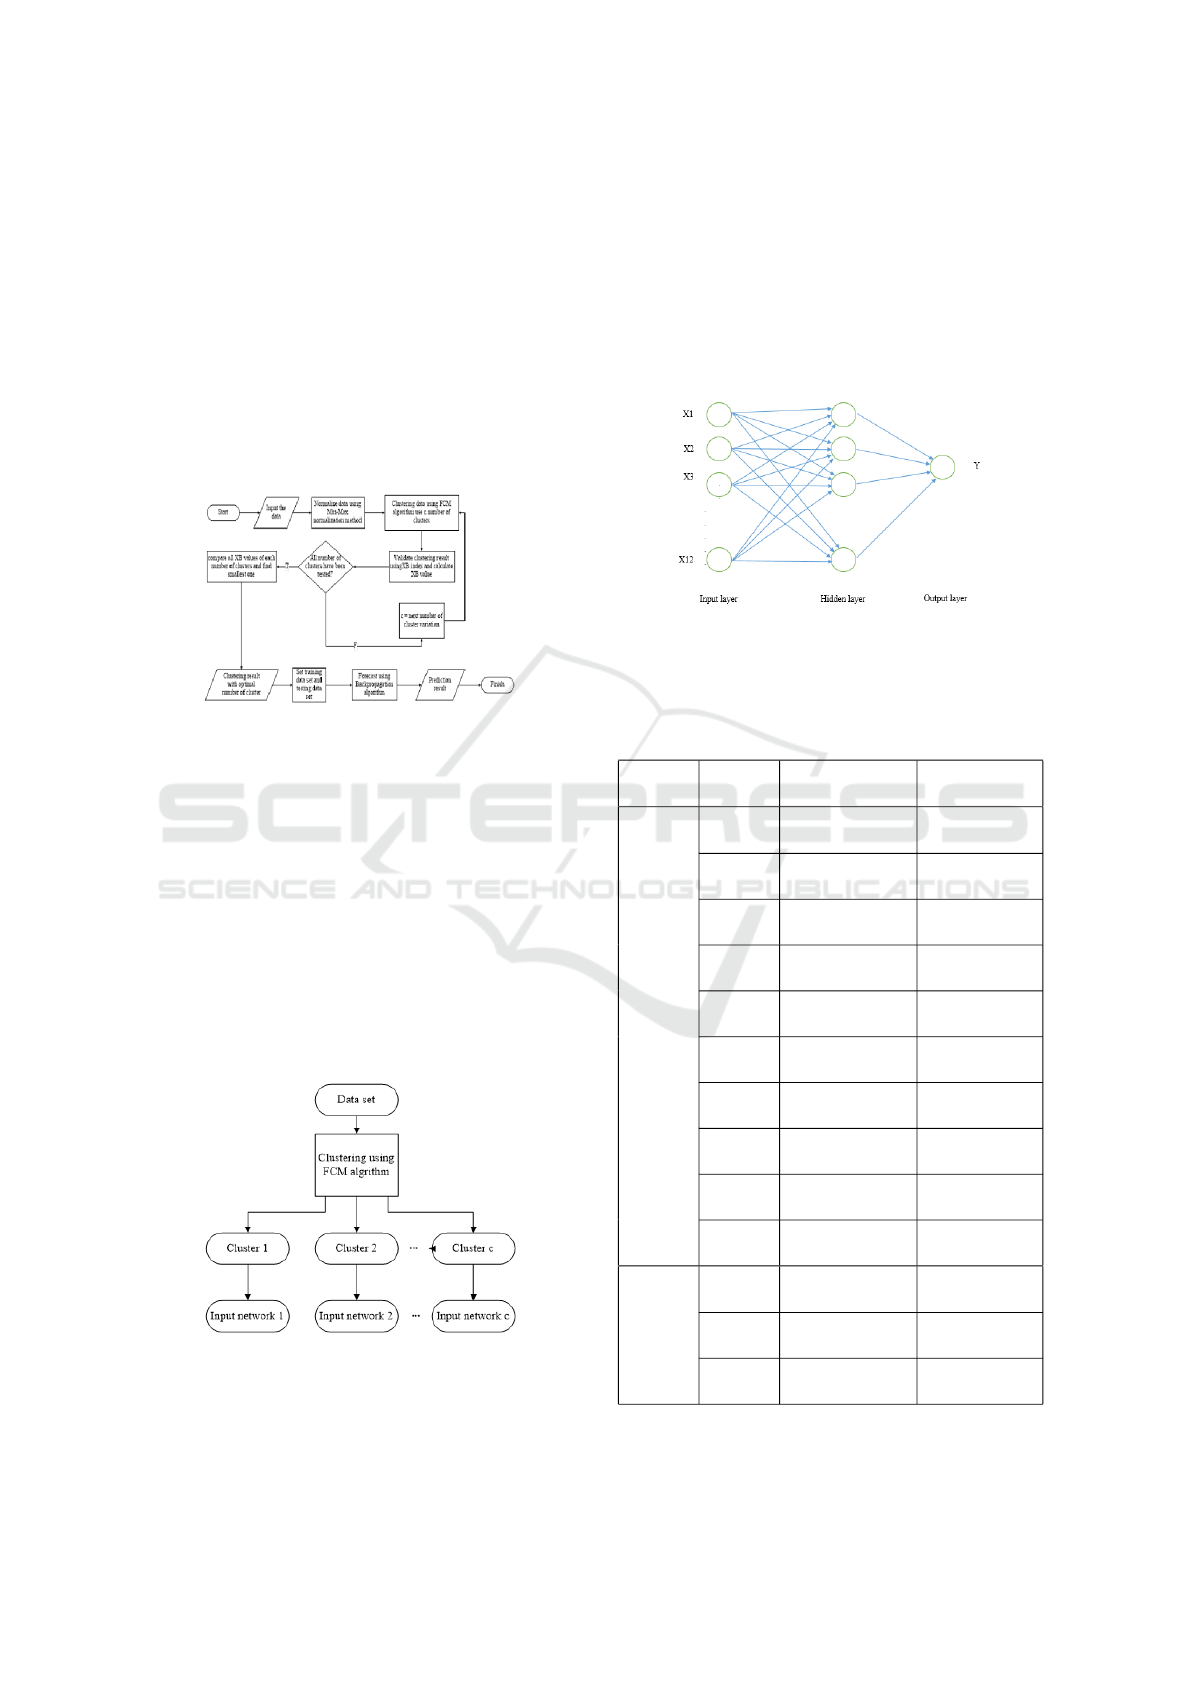
The flowchart of proposed system shown in Fig. 1.
Figure 1: The flowchart of proposed system.
The process begins by normalizing the data using
min-max normalization method, with a scale of 0 to
1 or -1 to 1. The organized data are grouped using
FCM. Set the number of cluster (c) in C matrix, for
example C = 2, 3, 4,..,c. The clustering process is car-
ried out many times using every c. If the clustering
process has been completed, proceed with the cluster
validation process using the XB index method. Cal-
culate the XB value (VXB) for each c and compare
them. The best validation result is c with smallest
VXB. All clusters is fed to the BP neural network as
shown in Fig 2. One cluster of data belongs to a neural
network, so the data processed by the neural network
becomes more uniform.
Figure 2: Cluster and neural network relation.
The neural network structure used in this research
is shown in Fig 3. The neural network used consists
of input layer, hidden layer, and output layer. At the
input layer there are 12 input nodes that present sales
for 12 months. At the hidden layer there are 12 nodes.
At the output layer there is 1 output node that presents
next month sales predictions. Distribution of training
data and test data is shown in Table 1. This research
uses 12 months sales data as the input and next month
sales data as the target.
Figure 3: The neural network structure.
Table 1: Pattern of input and target for training and testing
data set.
Data
Type
Pattern Input Data Target Data
Training
data
set
1 Sale on month
1-12
Sale on
month 13
2 Sale on month
2-13
Sale on
month 14
3 Sale on month
3-14
Sale on
month 15
4 Sale on month
4-15
Sale on
month 16
5 Sale on month
5-16
Sale on
month 17
6 Sale on month
6-17
Sale on
month 18
7 Sale on month
7-18
Sale on
month 19
8 Sale on month
8-19
Sale on
month 20
9 Sale on month
9-20
Sale on
month 21
10 Sale on month
10-21
Sale on
month 22
Testing
data
set
11 Sale on month
11-22
Sale on
month 23
12 Sale on month
12-23
Sale on
month 24
13 Sale on month
13-24
Sale on
month 25
Combination of Fuzzy C-Means, Xie-Beni Index, and Backpropagation Neural Network for Better Forecasting Result
75

4 EXPERIMENTAL RESULT AND
DISCUSSION
In this research, we used 25 months sales data of 49
product form local merchandise shop. First, we nor-
malized the data using equation 1. After that, we used
FCM algorithm for grouping the products based on
sales. In clustering process, we tested c = 3, 4, 5, 6,
7, 8, 9, 10. After clustering process, we validated the
clustering result using XB method to determine the
optimal c. In Table 2 shown XB value (V
XB
).
Table 2: XB value of all number of clusters.
Number of clusters (C) V
XB
3 0.25914727981512925
4 0.2662354305431815
5 0.26636604136238
6 0.28914641701970806
7 0.280678259035902
8 0.5400887360712261
9 0.5160469677794415
10 0.5141624900702748
Table 2 shows that c= 3 has the smallest VXB. So,
c = 3 is the most optimal c. In this research, we also
used other cluster validation methods to compare with
XB result. Table 3 shows Partition Coefficient value
(VPC) and Partition Entropy value (VPE) of cluster-
ing result.
Table 3: XB value of all number of clusters.
C V
PC
V
PE
3 0.812205240726 0.472354915629
4 0.799448326243 0.537941416641
5 0.725782129740 0.780968730019
6 0.676573669944 0.963241489047
7 0.665442096695 1.049213133289
8 0.563640242603 1.279514290767
9 0.567000067257 1.296391158861
10 0.571230883065 1.297560767950
The best validation result is c with biggest VPC
and smallest VPE. Table 3 shows that c = 3 has the
biggest VPC and the smallest VPE. The VPC and
VPE results are same with VXB result, appoint c =
3 as the optimal c. After determined the optimal c
= 3, we fed the clustering result to the BP neural net-
work. From 25 months sales data, we got 13 input and
target pattern, as shown in Table 1. We used pattern
1 to 10 as training data and pattern 12 to 13 as test-
ing data. We tested and compared forecasting result
using data with 3 clusters with original data set and
data with 2 clusters. Table 4 shows deviation (dev)
between forecast result with actual data.
Table 4: Deviation between forecasting result with actual
data.
Data set Clus-
ter
Total
of dev
Average
of dev
in one
cluster
Average
of dev
in data
set
Original
data
- 7,2854 0,1699 0,1699
Data with
2 clusters
1 3,8027 0,0288
0,1706
2 4,6871 0,3125
Data with
3 clusters
1 1,7704 0,0155
0,0603
2 4,9655 0,1655
3 0 0
Deviation (dev) is the difference between the pre-
dicted value and the actual value. Table 4 shows data
with 3 cluster have smallest average of deviation in
data set. That means forecasting using data with 3
cluster have a better accuracy than original data and
data with 2 cluster.
5 CONCLUSIONS
Fuzzy c-means algorithm (FCM) has good perfor-
mance for grouping data. Validating FCM using Xie-
Beni (XB) index method helps determine the optimal
number of clusters which improve accuracy of FCM.
XB method has good performance for cluster vali-
dation and has same result with Partition Coefficient
(PC) and Partition Entropy (PE). In this research, XB,
PC, and PE appoint number cluster 3 as the optimal
number of cluster, with XB value 0.25915, PC value
0.812205, and PE value 0.47235. Use data with 3
cluster as training and testing data set for Backpropa-
gation (BP) neural network can improve the accuracy,
better than original data which is not grouped into any
cluster. Data with 3 cluster has smallest average de-
viation in data set. Grouping data into cluster with
optimal number of cluster makes data in one cluster
more uniform. Data uniformity in one cluster helps
the BP neural network learns the pattern of the data
and forecast based on that pattern better. So, the BP
neural network can have better accuracy, better than
original data set which is less uniform.
ICCETIM 2019 - International Conference on Creative Economics, Tourism Information Management
76

REFERENCES
Duan, L., Yu, F., and Zhan, L. (2016). An improved fuzzy
c-means clustering algorithm. In 2016 12th Inter-
national Conference on Natural Computation, Fuzzy
Systems and Knowledge Discovery (ICNC-FSKD),
pages 1199–1204. IEEE.
Hicham, A., Mohamed, B., et al. (2012). A model for
sales forecasting based on fuzzy clustering and back-
propagation neural networks with adaptive learning
rate. In 2012 IEEE International Conference on Com-
plex Systems (ICCS), pages 1–5. IEEE.
Kesemen, O., Tezel,
¨
O.,
¨
Ozkul, E., Tiryaki, B. K., and
A
˘
gayev, E. (2017). A comparison of validity indices
on fuzzy c-means clustering algorithm for directional
data. In 2017 25th Signal Processing and Commu-
nications Applications Conference (SIU), pages 1–4.
IEEE.
Kumar, N. P., Sriram, A., Karuna, Y., and Saladi, S. (2018).
An improved type 2 fuzzy c means clustering for mr
brain image segmentation based on possibilistic ap-
proach and rough set theory. In 2018 International
Conference on Communication and Signal Processing
(ICCSP), pages 0786–0790. IEEE.
Mota, V. C., Damasceno, F. A., Soares, E. A., and Leite,
D. F. (2017). Fuzzy clustering methods applied to
the evaluation of compost bedded pack barns. In
2017 IEEE International Conference on Fuzzy Sys-
tems (FUZZ-IEEE), pages 1–6. IEEE.
Muranishi, M., Honda, K., and Notsu, A. (2014). Ap-
plication of xie-beni-type validity index to fuzzy co-
clustering models based on cluster aggregation and
pseudo-cluster-center estimation. In 2014 14th In-
ternational Conference on Intelligent Systems Design
and Applications, pages 34–38. IEEE.
Puspitaningrum, D. (2006). Pengantar jaringan syaraf
tiruan.
Singh, M., Bhattacharjee, R., Sharma, N., and Verma, A.
(2017). An improved xie-beni index for cluster valid-
ity measure. In 2017 Fourth International Conference
on Image Information Processing (ICIIP), pages 1–5.
IEEE.
Yejun, X. (2015). Optimization of the clusters number of an
improved fuzzy c-means clustering algorithm. In 2015
10th International Conference on Computer Science
& Education (ICCSE), pages 931–935. IEEE.
Zhang, X.-b. and Jiang, L. (2009). Vehicle types recogni-
tion based on neural network. In 2009 International
Conference on Computational Intelligence and Natu-
ral Computing, volume 1, pages 3–6. IEEE.
Zhao, Y., Zan, Y., Wang, X., and Li, G. (2010). Fuzzy
c-means clustering-based multilayer perceptron neu-
ral network for liver ct images automatic segmenta-
tion. In 2010 Chinese control and decision confer-
ence, pages 3423–3427. IEEE.
Combination of Fuzzy C-Means, Xie-Beni Index, and Backpropagation Neural Network for Better Forecasting Result
77
