
Patient Visit Forecasting at Emergency Department using
Autoregressive Integrated Moving Average (ARIMA) and
Exponential Smoothing Method in RSUD Kembangan
Nurul Asri Baharsyah and Mieke Nurmalasari
Department of Health Information Management, Universitas Esa Unggul, Jl. Arjuna Utara No. 9, Jakarta, Indonesia
Keywords: Forecasting, Autoregressive Integrated Moving Average (ARIMA), Exponential Smoothing, Best Model,
Emergency Department.
Abstract: The situation in the Emergency Department (ED) at RSUD Kembangan is generally overcrowded where many
patient’s arrival is unpredictable. Based on the results data in 2015-2019, patient visits to the emergency
department tend to increase by around 42% per year. The limited number of beds and medical personnel
causes a decrease in productivity and mobility when conducting health services. Therefore, forecasting for
patient visit is needed to minimize these problems. This study aims to predict patient visits at the Emergency
Department in RSUD Kembangan using Autoregressive Integrated Moving Average (ARIMA) and
Exponential Smoothing. Secondary data obtained from April 2015 to June 2019 retrieved from RSUD
Kembangan. The results showed that the ARIMA model (1,1,2) was chosen as the best model with MSE
22600.3 and MAPE 10.6 while Exponential Smoothing from Brown showed MSE 26900.6 and MAPE 11.8.
ARIMA (1,1,2) has the smallest error size parameter so that a suitable model is applied in forecasting the
number of emergency patient visits at RSUD Kembangan in the future.
1 INTRODUCTION
General hospitals provide excellent service for 24
hours non-stop which is marked by the availability of
Emergency Department (ED). Emergency
Department is a clinical treatment that requires
immediate medical treatment to save lives and replace
disability further (Republik Indonesia, 2009).
Carrying out these activities distributed to various
reports made to improve hospital services, one of
which is visit reporting.
Patient visit reports are reported periodically
every month. This needs to be done as an evaluation
of management regarding decision making, strategic
planning, and indicators of workload calculations for
health workers.
The results of Warijan's research (2018) showed
that the number of outpatient visits at RAA
Soewondo Hospital each year has increased by an
average of 21.67%. (Warijan et al., 2018). The
increase in the number of patient visits is likely to
occur every year so forecasting needs to be done in
the future.
Forecasting is an activity of predicting future
events based on prior knowledge obtained through a
systematic process or intuition (Makridakis, 2010).
Forecasting is an attempt to predict something that
will happen based on previous data and related
variables. Forecasting is important for health care
institutions that can be used as parameters or
references in planning and making decisions
significantly.
The purpose of forecasting is to find patterns in
historical data series and extrapolate these patterns
into the future, to reduce management risk and errors
in decision making (Makridakis, 2010). Forecasting
has several models that can be adjusted to the actual
data and events. Among them are the Autoregressive
Integrated Moving Average (ARIMA) and
Exponential Smoothing models.
The results of Choudhury's research (2019) stated
that ARIMA (3,0,0) (2,1,0) was chosen as the
appropriate model for forecasting and fulfilling the
requirements with the Box-Ljung correlation test and
Jarque-Bera test for normality so that it can estimate
arrivals the number of patients in the emergency room
234
Baharsyah, N. and Nurmalasari, M.
Patient Visit Forecasting at Emergency Department using Autoregressive Integrated Moving Average (ARIMA) and Exponential Smoothing Method in RSUD Kembangan.
DOI: 10.5220/0009590302340239
In Proceedings of the 1st International Conference on Health (ICOH 2019), pages 234-239
ISBN: 978-989-758-454-1
Copyright
c
2020 by SCITEPRESS – Science and Technology Publications, Lda. All rights reserved
accurately and also as an indicator of decision support
systems in the health industry (Choudhury, 2019).
In line with Putri's research (2018), the
exponential smoothing model that shows the
possibility of hypertension cases shows a MAPE
value of 25.71% for men and 19.63% for women so
that it can be concluded that this forecasting model
can help the decision making process for a long
period of time will come based on forecast data that
has similarities with actual data (Putri, Herawati and
Ramani, 2018).
Based on Choudhury's research (2019), the
density in the ED is triggered by various factors
including the patient population, physical capacity,
practical capacity, functional capacity, and fiscal
capacity. Density in the emergency room can
potentially hinder patient care which causes treatment
delay and the possibility of errors in the medical
treatment process (Choudhury, 2019).
RSUD Kembangan is a hospital that has
emergency services. The situation in the Emergency
Department is generally overcrowded where many
patients come and are unpredictable. The overcrowded
emergency room also results in reduced productivity
and mobility of services for doctors and nurses so as to
reduce the quality of excellent health services.
Based on the results of preliminary observational
data in 2015-2019, patient visits in the emergency
room tend to increase with an increase of 42% per
year and the average number of patients who come
per day in the span of the year is 29 patients. With a
limited number of beds which are as many as 6 units,
this is considered less effective in conducting
emergency services. Moreover, the problem that
occurs is that patients in the ED are generally queued
like in a polyclinic and not infrequently they are
served in the patient's waiting chair. This condition if
left unchecked can trigger many errors in medical
services. Therefore, there is a need for modeling and
forecasting of patient visits in the emergency room so
that health care providers can have anticipation when
there is excessive density.
However, it is necessary to conduct research on
modeling and forecasting of patient visits in
emergency departments using the Autoregressive
Integrated Moving Average (ARIMA) and
Exponential Smoothing methods at RSUD
Kembangan.
2 METHOD
This research is a time-series study that uses the
Autoregressive Integrated Moving Average
(ARIMA) and Exponential Smoothing method to
predict patient visits in Emergency Departments
based on observations of data from April 2015 to June
2019 to forecast the number of IGD patient visits in
July 2019 to December 2020.
The population in this study is the data of the
number of patient visits Emergency Services at
RSUD Kembangan in 2015-2019 as many as 53,633
patient data with details of 3,992 patients in 2015,
10,939 patients in 2016, 13,482 patients in 2017,
14,842 patients in 2018 and 10,378 patients until June
2019. This research using total sampling.
Collected data derived from secondary data
namely emergency patient visit data by looking
directly at the annual report data and the daily report
book of the emergency department of RSUD
Kembangan in 2015-2019. The instrument used in
this study was a checklist sheet.
Data processing techniques in this study were
done manually and computerized. The data
processing stage is started from editing, income,
categorization, cleaning, and presentation data.
3 RESULT
3.1 Identify of ED Patient Visit Data
Pattern in RSUD Kembangan
Historical data on patient visits in the ED for the past
5 years starting from April 2015 to June 2019 can be
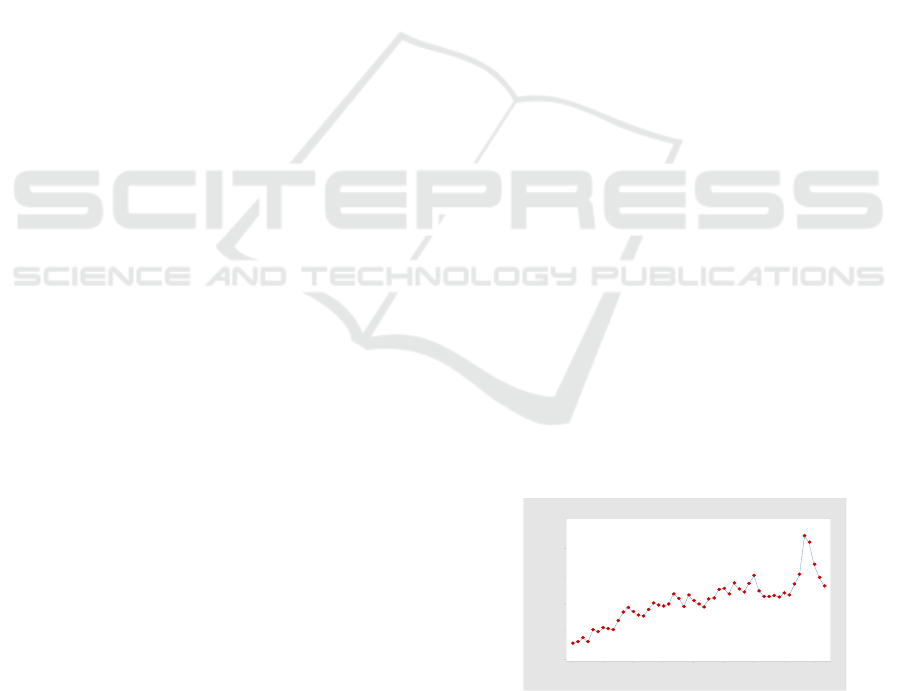
seen in figure 1.
Based on Figure 1, overall the actual data tends to
increase even though there are some values that show
a decrease. The lowest patient visit data occurred in
April 2015 with 289 patients while the highest patient
visit during the study period occurred in February
2019 with a total of 2227 patients due to cases of
Dengue Hemorrhagic Fever (DHF).
Figure 1: Total Patient Visits in RSUD Kembangan 2015-
2019.
Before forecasting, it is necessary to know the
decomposition of data patterns to determine whether
Year
Month
20192018201720162015
AprOktAprOktAprOktAprOktApr
2500
2000
1500
1000
500
0
JumlahKunjungan
Plot Jumlah Kunjungan Pasien IGD di RSUD Kembangan Tahun 2015-2019
Patient Visit Forecasting at Emergency Department using Autoregressive Integrated Moving Average (ARIMA) and Exponential Smoothing
Method in RSUD Kembangan
235
the type of data pattern contains elements of trends,
seasonal, cyclical, or random and in accordance with
the historical data of emergency room patient visits at
RSUD Kembangan.
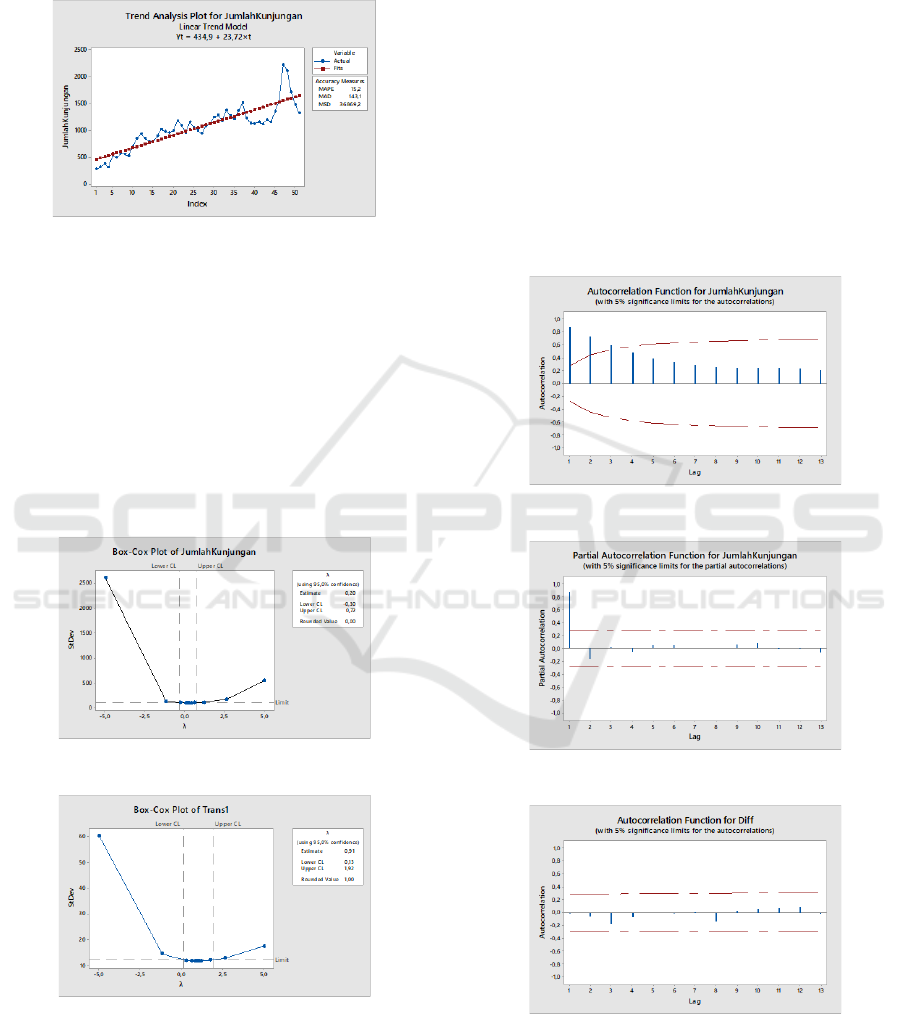
Figure 2: Data Pattern Type of Patient Visit.
Figure 2 shows a straight red line that goes up. It
can be concluded that the types of data patterns that
are consistent with historical data only contain trend
elements.
3.2 Arima Model
3.2.1 Stationarity
1. Box-Cox Transformation Test
It needs to know that stationarity data to variant.
Figure 3: Unstationary Variant.
Figure 4: Stationary Variant.
Box-Cox Transformation test results obtained
after the first data transformation by converting into a
log form so that it gets a value of λ = 0.00 and
indicates that the data is not stationary because
stationarity in the variant if the value λ ≠ 1. Therefore
it is necessary transformation is performed again and
the value λ = 1. It concluded that the data is stationary
for the variant.
2. ACF and PACF Test
These test necessary to know stationary data to mean.
Based on the figure 4 Lag on the ACF touches the
number 3 and exceeds the 95% confidence level so
the data is not stationary and a differencing process
must be performed.
The ACF plot results show that the
autocorrelation value forms a cut of the pattern on the
lag and the pacf plot results after differencing show a
pattern that does not cross the line of trust so that the
data has been stationary.
Figure 5: ACF historical data.
Figure 6: PACF historical data.
Figure 7: ACF after differencing.
ICOH 2019 - 1st International Conference on Health
236
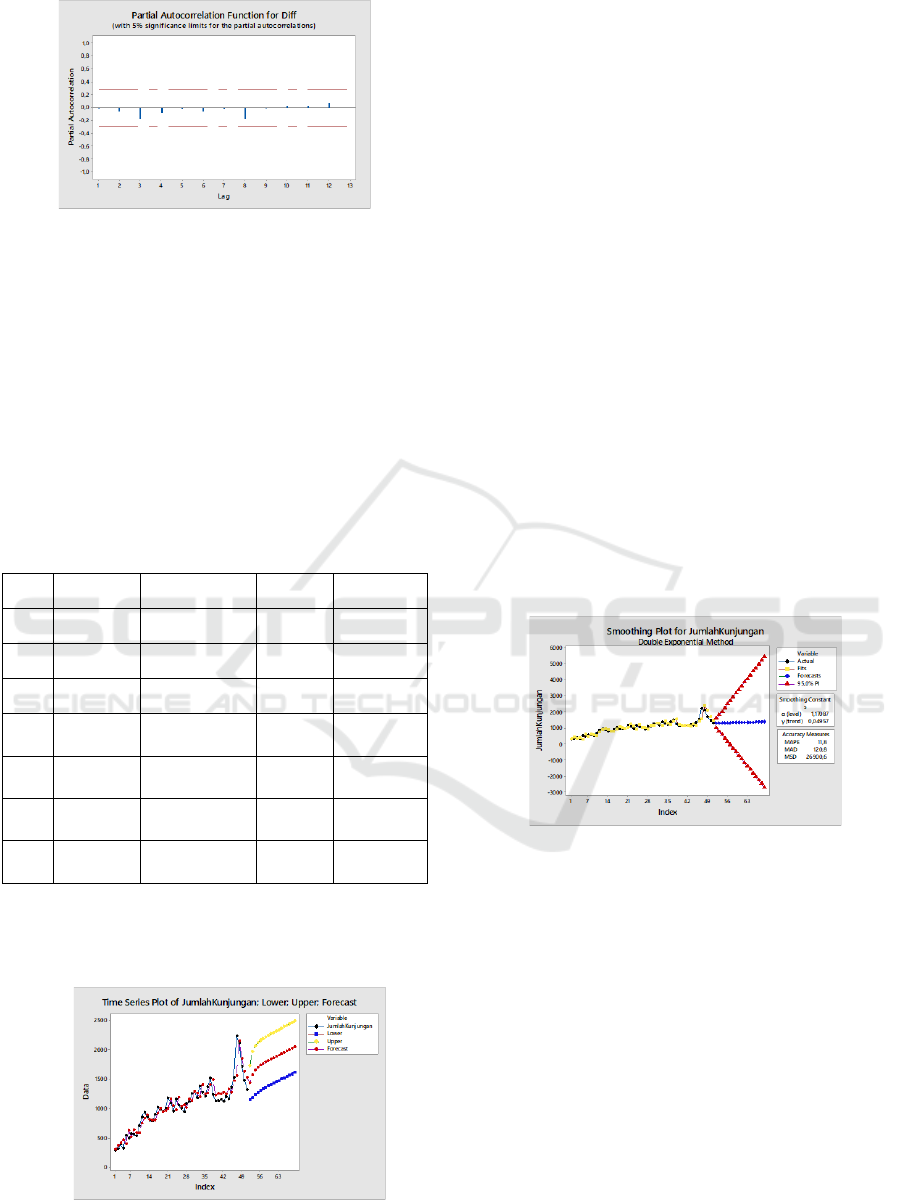
Figure 8: PACF after differencing.
3.2.2 ARIMA Result Forecast
Forecasting the number of patient visits in the
emergency room at RSUD Kembangan using the
Autoregressive Integrated Moving Average
(ARIMA) method with the best model p, d, q (1,1,2),
AR parameters (1) 0.05 ma (1) 0.03 and MA (2) 0.05
significant with constant value 0.00 and has a MSE
value of 22600.3. Diagnostic checking is carried out
to determine the level of significance of the arima
model, can be seen in the following table:
Table 1: Patient Visit in ED with Diagnostic Checking.
Model
AR
MA
MSE
Result
0,1,1
0,28
26984,4
1,1,0
0,42
27128,7
1,1,1
0,81
0,67
27462,8
1,1,2
0,05
(1) 0,03
(2) 0,05
22600,3
Significant
2,1,0
(1) 0,36
(2) 0,22
26831,0
2,1,1
(1) 0,20
(2) 0,64
0,12
28272,2
2,1,2
(1) 0,00
(2) 0,06
(1) 0,00
(2) 0,71
21979,0
* p-value (p <0,05)
So the forecasting plot using ARIMA (1,1,2) can
be seen in the figure below:
Figure 9: Forecasting of ED with ARIMA (1,1,2).
3.3 Exponential Smoothing Model
The actual data of emergency room patient visits
contain trend values, so it can be concluded that the
model used is Brown's double exponential
smoothing. This technique uses two smoothes that
can be calculated with only three data values and one
alpha value.
Based on Figure 10, the graph shows a trend
pattern shown by the blue line. While the red color
chart shows the value of the upper and lower limit of
forecasting with 95% CI. The trend value in this
model is significant at 0.04957 so that the <p-value is
0.05. The average MSE error value is 26900.6. An
increase in the average number of patient visits in this
forecast each month is 4 patients starting from July
2019-December 2020.
3.4 Comparison between ARIMA and
Exponential Smoothing Model
The ARIMA and Exponential Smoothing models
have in common that is only using univariate data
containing trend patterns. Both of these models also
assume that values and errors from the past can be
used as the basis for forecasting.
Figure 10: Forecasting of ED with Exponential Smoothing.
The weakness of the ARIMA model is that it
cannot produce good predictions in the long run
whereas double exponential smoothing brown
requires alpha, beta, and gamma values by trial and
error but the complexity level is lower than ARIMA.
Based on table 2, between the two forecasting
models, namely ARIMA and exponential smoothing
have the same upward trend. But each month the
difference between both is quite significant.
Therefore, it is necessary to measure the MSE and
MAPE parameters to determine the best model that
can be used as an indicator of forecasting the number
of emergency patient visits at RSUD Kembangan in
the future.
Patient Visit Forecasting at Emergency Department using Autoregressive Integrated Moving Average (ARIMA) and Exponential Smoothing
Method in RSUD Kembangan
237
3.5 Determining Best Model
The results of parameter measurements for
determining the forecasting model for the number of
emergency patient visits at Kembangan Hospital can
be seen in the table 3.
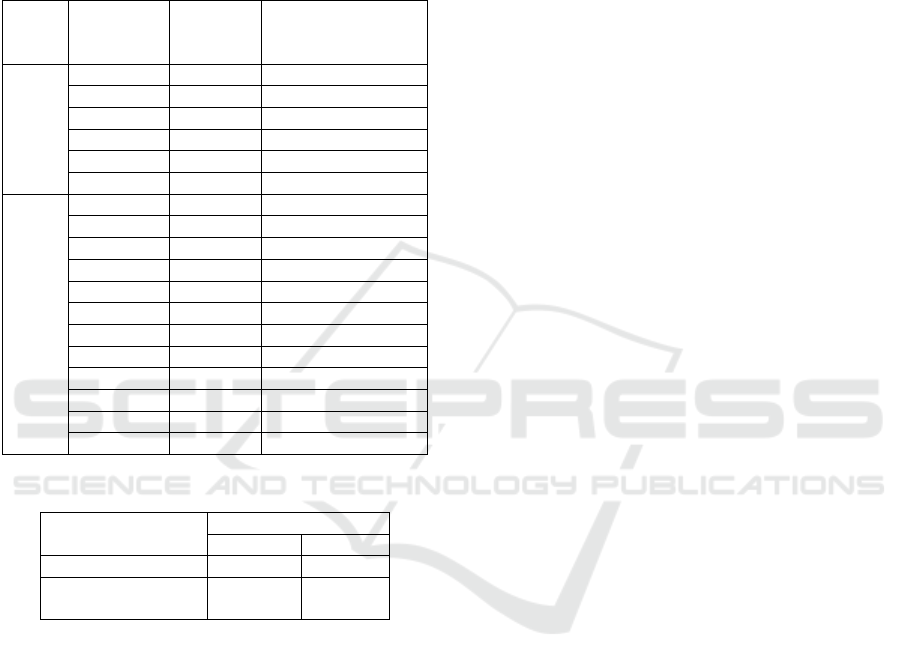
Table 2: Comparison forecasting data of Patient Visit at ED
using ARIMA AND Exponential Smoothing.
Year
Month
Forecasting
Result in
ARIMA
Forecasting Result in
Exponential
Smoothing
2019
July
1431
1299
August
1571
1303
September
1648
1307
October
1696
1312
November
1731
1316
December
1760
1320
2020
January
1785
1324
February
1810
1329
March
1834
1333
April
1858
1337
May
1881
1341
June
1905
1346
July
1928
1350
August
1952
1354
September
1975
1358
October
1998
1363
November
2021
1367
December
2045
1371
Table 3: Parameter Measurement Best Model.
Model
Parameter Measurement
MSE
MAPE
ARIMA (1,1,2)
22600,3
10,6
Exponential
Smoothing
26900,6
11,8
According to Ningtiyas’s journal states that with
the limitations of MSE as a measure of forecasting
accuracy, an alternative measure is used as an
indication of accuracy in forecasting, namely MAPE
(Ningtiyas, 2018).
For make sure, the research did a significant test
using Akaike Information Criterion (AIC) to know
the lowest value of this result. Then, it got 650.86 for
ARIMA and 710.67 for Exponential Smoothing.
From the research that has been done, it is known
that the error value from ARIMA is smaller than
Exponential Smoothing. So it can be concluded that
forecasting accuracy with ARIMA (1,1,2) is better
than Exponential Smoothing.
4 CONCLUSIONS
The number of ED patient visits at the RSUD
Kembangan period of April 2015 to June 2019 has
increased every month. The largest surge in patients
was in February 2019 with a total of 2227 people due
to an Extraordinary Event of Dengue Hemorrhagic
Fever (DHF) or commonly referred to as Dengue
Fever. Whereas the least number of patient visits
occurred in April 2015 amounted to 289 patients
because the Kembangan Regional Hospital had just
been inaugurated which was previously the
Kembangan District Health Center.
Forecasting is done with two models namely
ARIMA and Exponential Smoothing. The results
obtained by the ARIMA model (1,1,2) were chosen
because they have MSE values of 22600.3 and MAPE
10.6. Whereas in the Exponential Smoothing Model
because the data contained trend elements,
Exponential Smoothing was chosen, which received
MSE 26900.6 and MAPE 11.8. For make sure, the
research did a significant test using Akaike
Information Criterion (AIC) to know the lowest value
of this result. Then, it got 650.86 for ARIMA and
710.67 for Exponential Smoothing.
Determination of the best model is done by
looking at the smallest error value so that the ARIMA
model (1,1,2) is chosen because it has a smaller value
compared to Exponential Smoothing.
REFERENCES
Choudhury, A. (2019) ‘Hourly Forecasting of Emergency
Department Arrivals– Time Series Analysis’, Stevens
Institute of Technology. Available at:
https://arxiv.org/pdf/1901.02714.
Makridakis, S., Wheelwright, S. C. and McGee, V. E.
(2010) Metode dan Aplikasi Peramalan Jilid 1.
Tangerang: Binarupa Aksara.
Ningtiyas, S. R. (2018) ‘Aplikasi Metode Double
Exponential Smoothing Holt dan Arima Untuk
Meramalkan Voluntary Counseling and Testing (VCT)
ODHA di Provinsi Jawa Timur’, Fakultas Kesehatan
Masyarakat Universitas Airlangga, (December), pp.
156–168. doi: 10.20473/ijph.vl13il.2018.156-168.
Putri, N. G., Herawati, Y. T. and Ramani, A. (2018)
‘Peramalan Jumlah Kasus Penyakit Hipertensi di
Kabupaten Jember Dengan Metode Time Series’,
Journal of Health Science and Prevention, (2549–919X
(e)), pp. 39–46. Available at:
http://jurnalfpk.uinsby.ac.id/index.php/jhsp/article/vie
w/161/143.
Republik Indonesia (2009) Undang-Undang Republik
Indonesia Nomor 44 Tahun 2009 Tentang Rumah Sakit.
ICOH 2019 - 1st International Conference on Health
238

Warijan et al. (2018) ‘Prediksi Kunjungan Pasien Rawat
Jalan Tahun 2018-2022’, Jurnal Rekam Medis dan
Informasi Kesehatan, 1(Oktober), pp. 88–95. Available
at: http://ejournal.poltekkes-smg.ac.id/ojs/index.php/
RMIK/article/download/3847/1038.
Patient Visit Forecasting at Emergency Department using Autoregressive Integrated Moving Average (ARIMA) and Exponential Smoothing
Method in RSUD Kembangan
239
