
The Simple Method for Immunohistochemistry (IHC) Analyzing of
Intensity using Corel Photo-Paint® with CMYK Split-channel
Fajar Shodiq Permata, Dyah Ayu Oktavianie Ardhiana Pratama and Albiruni Haryo
Faculty of Veterinary Medicine, Universitas Brawijaya, Puncak Dieng Eksklusif Kalisongo Dau, Malang, Indonesia
Keywords: Corel Photo Paint, Image Processing, Immunohistochemistry, Intensity, Quantitive Method.
Abstract: Immunohistochemistry (IHC) is a popular method to detect protein in the tissue. But, determining protein
level in tissue is using ELISA which needs more cost. Although, the intensity of IHC color relates to an
amount in tissue. Therefore, image processing to measure the intensity of IHC quantitively was developed
using much software. The common software used in Indonesia is Corel Photo-Paint® (CCP). This article
described the simple method to measure the IHC intensity using CCP based on Cyan-Magenta-Yellow-
Black (CMYK) Split channel. The conclusions were CCP could be used for image processing software to
measure the IHC intensity. The higher intensity has fewer grey level, the lower intensity has a higher grey
level
1 INTRODUCTION
Immunohistochemistry (IHC) is a popular technique
to detect a specific protein in the tissue. The IHC
was conducted by pathologists or histologist to
determine the expression of the protein (Kaliyappan
et al. 2012). The disadvantage of IHC is that can not
measure the protein in the tissue so that it has to use
another technique such as Enzyme-linked
Immunosorbent Assay (ELISA) (Drijvers et al.
2017). It will make more cost due to the use of
ELISA. However, if there has more contained
protein in the tissue will have more intensity in IHC
expression. Therefore, the amount of protein inside
the tissue relates to increasing the intensity of IHC
expression. Many software such as Image J (Jensen
2013), QuPath (Bankhead et al. 2017), ImunoRatio
(Tuominen et al. 2010), and IHC profiler (Varghese
et al. 2014) is developed to be image processing of
tissue pictures to quantitive measurements. These
software result in the number based on IHC pictures
then continue to statistic analysis. The quantitive of
IHC expression could be area percentages, number
of expressed cells, and intensity level. The image
processing of IHC expression would be reduced
more cost to check other parameter associated
protein in tissue(Kaczmarek, Górna, and Majewski
2004).Goldy chocolate of IHC expression in the
picture is composed of Magenta and Yellow color.
Yellow and Magenta color could be split from a
picture using CMYK split-channel (Pham et al.
2007) into a grey mode. The intensity is measured
based on the grey level using a histogram. Grey
level is described from 0 (black) until 255 (white)
(Padmavathi and Thangadurai 2016).
Corel Photo Paint® is a popular software for
image processing in Indonesia accompanied by
Corel Draw®. Corel Photo Paint® has the ability to
Cyan-Magenta-Yellow-Black (CMYK) split-channel
and measuring grey level with Histogram. Thus, this
article explained the simple method using Corel
Photo Paint® with CMYK split-channel for intensity
measurement of IHC expression in tissue pictures.
2 MATERIALS AND METHODS
2.1 Material
Materials for this research were Corel Photo-Paint
(CCP) ® Software version X7 and one photo of IHC
result of Positive Dopamine expression in neurons
of the brain.
2.2 Method
1. Open the Corel Photo Paint® Software (Figure 1)
Permata, F., Pratama, D. and Haryo, A.
The Simple Method for Immunohistochemistry (IHC) Analyzing of Intensity using Corel Photo-Paint
R
with CMYK Split-channel.
DOI: 10.5220/0009587000530057
In Proceedings of the 6th International Conference on Advanced Molecular Bioscience and Biomedical Engineering (ICAMBBE 2019) - Bio-Prospecting Natural Biological Compounds for
Seeds Vaccine and Drug Discovery, pages 53-57
ISBN: 978-989-758-483-1
Copyright
c
2020 by SCITEPRESS – Science and Technology Publications, Lda. All rights reserved
53
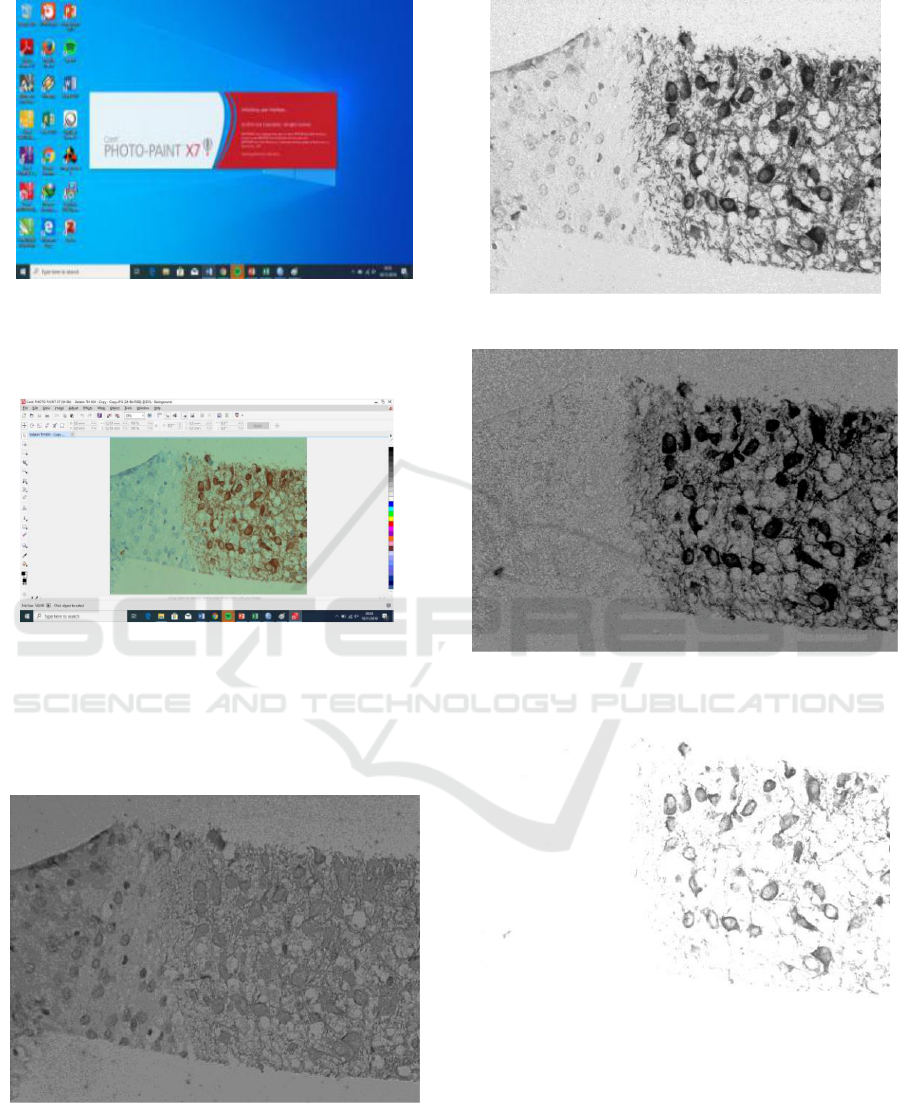
Figure 1: Opening Corel Photo Paint®
2. Click Open in Menu, please choose the file of the
figure 2
Figure 2: Opening the picture file
3. Click Image in Menu > Split Channel > CMYK.
The result would be as extraction into 4 pictures in
Cyan, Magenta, Yellow and Black picture in grey
mode (Figure 3-6).
Figure 3. The cyan channel result in grey mode
Figure 4. The magenta channel result in grey mode
Figure 5. The yellow channel result in grey mode
Figure 6. The black channel result in grey mode
4. Combining the Magenta channel and Yellow
channel with click Image > Calculation (Fig 7).
Choose the magenta channel in source 1 and the
yellow channel in source 2 and then click OK.
ICAMBBE 2019 - 6th ICAMBBE (International Conference on Advance Molecular Bioscience Biomedical Engineering) 2019
54
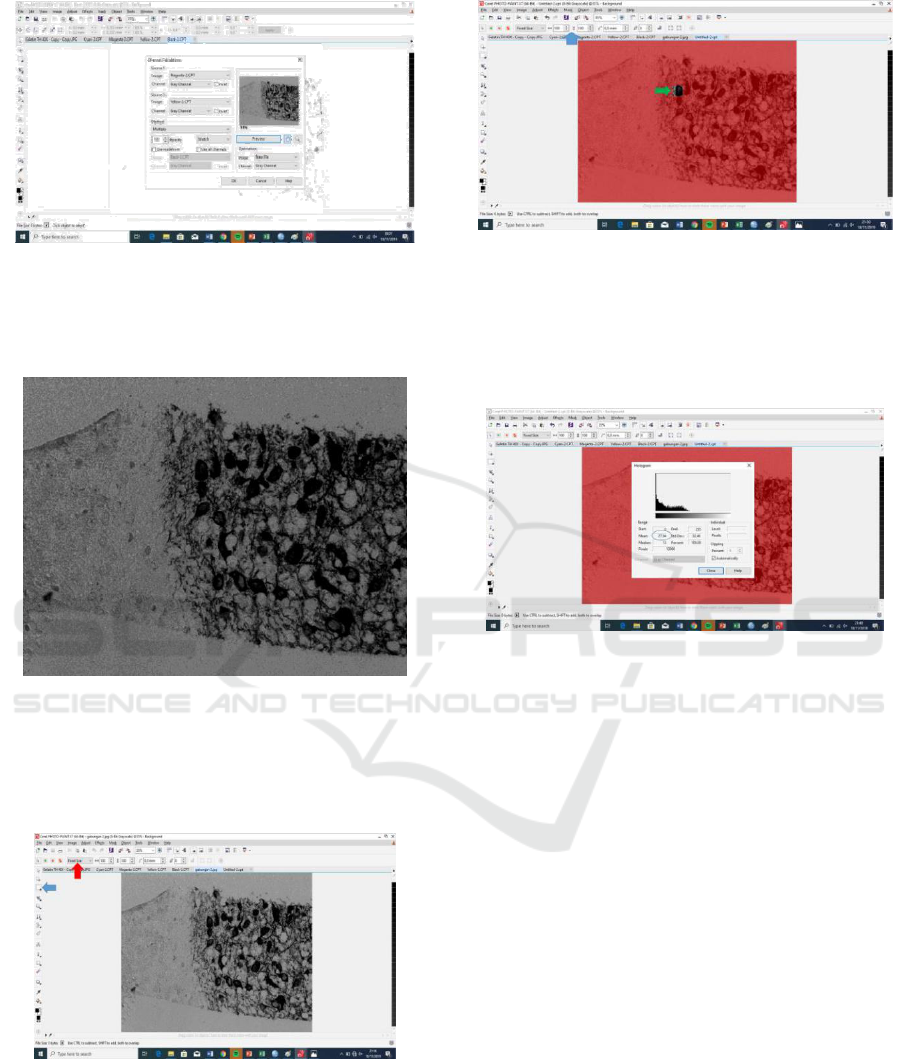
Figure 7. Calculation image as combining the Yellow
channel and the magenta channel
5. The outcome was grey mode picture combination
the yellow and the magenta channel (Figure 8)
Figure. 8. Picture as the result of calculation processing
combining the Yellow and the Magenta channel
6. Click Rectangle Mask (in the Left Side) >
Normal (upper side) and change to Fixed Sized
(Figure 9)
Figure 9. Rectangle mask (blue arrow) and Fixed sized
(red arrow)
7. Please determine the size example 100x100, and
please choose the area or cell which want to be
calculated its intensity (Figure 10)
Figure 10. Determining the size 100x100 (blue arrow), and
choose the area or the cell which want to be measured the
intensity (green arrow)
8. Please click Image > Histogram to know the mean
grey level (Figure 11). Please record the mean grey
level into the data
Figure 11. The calculation of IHC intensity of cells based
on the mean grey level (blue circle).
2.2.1 Measurement the Neuron and the
Dendrit Intensity of IHC expression
As many as 10 areas randomly were calculated
either of neuron and dendrite by the method for
intensity measurement.
2.2.2 Data Analysis
Data were analyzed using an independent T-test with
significance 95% (p<0.05) comparing the intensity
IHC expression of the neuron and that of dendrites.
3 RESULTS AND DISCUSSIONS
3.1 Results
3.1.1 Comparison of the Intensity of IHC
Expression between the Neuron and
the Dendrites
Based on the measurement, there was significantly
different (p<0.05) of intensity between neuron and
The Simple Method for Immunohistochemistry (IHC) Analyzing of Intensity using Corel Photo-Paint
R
with CMYK Split-channel
55
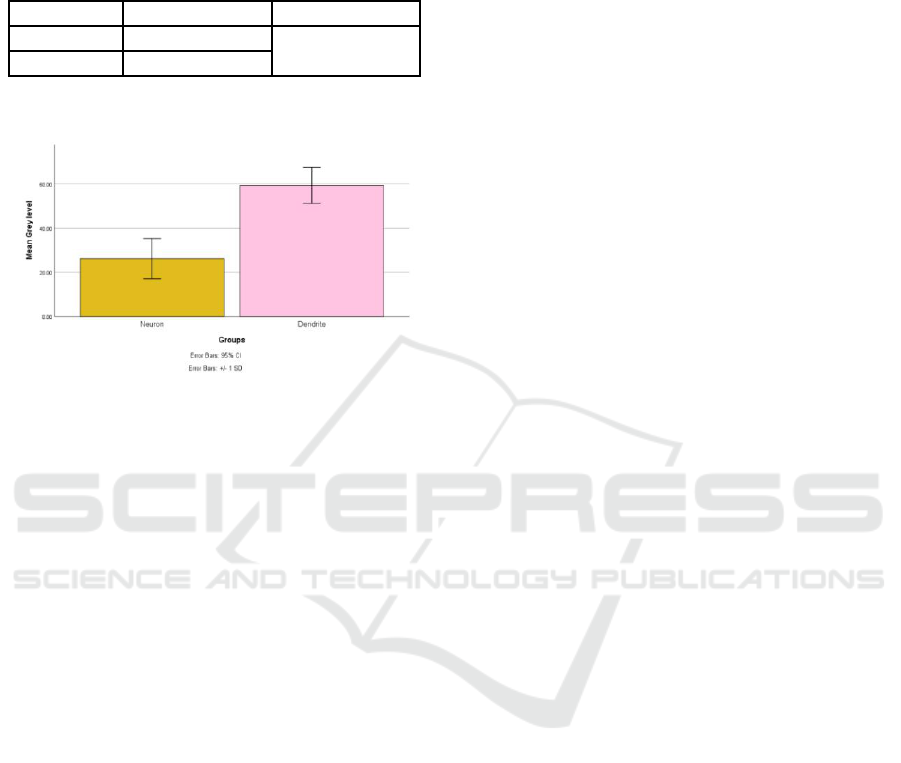
dendrite associated IHC expression (Table 1, Figure
12).
Table 1: The comparison of the intensity of IHC
expression between neuron and dendrite
Group Grey level p-value T-test
N
euron 26,13±9,05 0.000
Dendrite 52,96±8,09
N
otes: p-value showed under 0.05 indicate
a
significant difference between group
Figure 12: The graph of the mean of grey level between
neuron and dendrite for IHC expression of intensity.
3.2 Discussions
The software for image processing of the IHC
picture was developed in many forms. CPP® is the
popular software used in Indonesia for photo editing
besides Adobe Photoshop®. This article was showed
another function of CPP® to image processing relate
to medical or biological aspects for examining IHC
pictures.
Analyzing IHC picture give benefits such as
reduce the cost of other technique to tissue protein
measurement. This article explained the simple way
to measure the intensity of IHC expression
(Kaczmarek, Górna, and Majewski 2004).
This method was similar to Pham et al. 2007,
using the CMYK method but this method was
simpler to apply. The differences between
expression in the neuron (high expression) and the
dendrite (less expression) were significantly
different (p<0.05, Table 1). The higher expression
showed the lower grey level and the less expression
showed the higher grey level. It was indicated that
the CPP® could be used as a software to IHC
expression analysis for intensity. This article was
also be a module to operate CPP® to analyze IHC
picture to intensify expression.
4 CONCLUSIONS
The conclusions of this method were :
• Corel Photo Paint® could be used easily to
measure the intensity of IHC expression using
CMYK Split channel
• higher intensity is the fewer grey level, the less
intensity is the higher grey level
REFERENCES
Bankhead, Peter, Maurice B. Loughrey, José A.
Fernández, Yvonne Dombrowski, Darragh G. McArt,
Philip D. Dunne, Stephen McQuaid, et al. 2017.
“QuPath: Open Source Software for Digital Pathology
Image Analysis.” Scientific Reports 7 (1): 16878.
https://doi.org/10.1038/s41598-017-17204-5.
Drijvers, Jefte M., Imad M. Awan, Cory A. Perugino, Ian
M. Rosenberg, and Shiv Pillai. 2017. “The Enzyme-
Linked Immunosorbent Assay.” In Basic Science
Methods for Clinical Researchers, 119–33. Elsevier.
https://doi.org/10.1016/B978-0-12-803077-6.00007-2.
Jensen, Ellen C. 2013. “Quantitative Analysis of
Histological Staining and Fluorescence Using ImageJ:
Histological Staining/Fluorescence Using ImageJ.”
The Anatomical Record 296 (3): 378–81.
https://doi.org/10.1002/ar.22641.
Kaczmarek, E., A. Górna, and P. Majewski. 2004.
“Techniques of Image Analysis for Quantitative
Immunohistochemistry.” Roczniki Akademii
Medycznej W Bialymstoku (1995) 49 Suppl 1: 155–58.
Kaliyappan, Karunakaran, Murugesan Palanisamy,
Jeyapradha Duraiyan, and Rajeshwar Govindarajan.
2012. “Applications of Immunohistochemistry.”
Journal of Pharmacy and Bioallied Sciences 4 (6):
307. https://doi.org/10.4103/0975-7406.100281.
Padmavathi, K., and K. Thangadurai. 2016.
“Implementation of RGB and Grayscale Images in
Plant Leaves Disease Detection – Comparative
Study.” Indian Journal of Science and Technology 9
(6). https://doi.org/10.17485/ijst/2016/v9i6/77739.
Pham, Nhu-An, Andrew Morrison, Joerg Schwock, Sarit
Aviel-Ronen, Vladimir Iakovlev, Ming-Sound Tsao,
James Ho, and David W. Hedley. 2007. “Quantitative
Image Analysis of Immunohistochemical Stains Using
a CMYK Color Model.” Diagnostic Pathology 2
(February): 8. https://doi.org/10.1186/1746-1596-2-8.
Tuominen, Vilppu J., Sanna Ruotoistenmäki, Arttu
Viitanen, Mervi Jumppanen, and Jorma Isola. 2010.
“ImmunoRatio: A Publicly Available Web
Application for Quantitative Image Analysis of
Estrogen Receptor (ER), Progesterone Receptor (PR),
and Ki-67.” Breast Cancer Research: BCR 12 (4):
R56. https://doi.org/10.1186/bcr2615.
Varghese, Frency, Amirali B. Bukhari, Renu Malhotra,
and Abhijit De. 2014. “IHC Profiler: An Open Source
Plugin for the Quantitative Evaluation and Automated
ICAMBBE 2019 - 6th ICAMBBE (International Conference on Advance Molecular Bioscience Biomedical Engineering) 2019
56

Scoring of Immunohistochemistry Images of Human
Tissue Samples.” Edited by Syed A. Aziz. PLoS ONE
9 (5): e96801.
https://doi.org/10.1371/journal.pone.0096801.
Bankhead, P., Loughrey, M.B., Fernández, J.A.,
Dombrowski, Y., McArt, D.G., Dunne, P.D.,
McQuaid, S., Gray, R.T., Murray, L.J., Coleman,
H.G., James, J.A., Salto-Tellez, M., Hamilton, P.W.,
2017. QuPath: Open source software for digital
pathology image analysis. Sci Rep 7, 16878.
https://doi.org/10.1038/s41598-017-17204-5
Drijvers, J.M., Awan, I.M., Perugino, C.A., Rosenberg,
I.M., Pillai, S., 2017. The Enzyme-Linked
Immunosorbent Assay, in: Basic Science Methods for
Clinical Researchers. Elsevier, pp. 119–133.
https://doi.org/10.1016/B978-0-12-803077-6.00007-2
Jensen, E.C., 2013. Quantitative Analysis of Histological
Staining and Fluorescence Using ImageJ: Histological
Staining/Fluorescence Using ImageJ. Anat. Rec. 296,
378–381. https://doi.org/10.1002/ar.22641
Kaczmarek, E., Górna, A., Majewski, P., 2004.
Techniques of image analysis for quantitative
immunohistochemistry. Rocz. Akad. Med. Bialymst.
49 Suppl 1, 155–158.
Kaliyappan, K., Palanisamy, M., Duraiyan, J.,
Govindarajan, R., 2012. Applications of
immunohistochemistry. J Pharm Bioall Sci 4, 307.
https://doi.org/10.4103/0975-7406.100281
Padmavathi, K., Thangadurai, K., 2016. Implementation
of RGB and Grayscale Images in Plant Leaves Disease
Detection – Comparative Study. Indian Journal of
Science and Technology 9.
https://doi.org/10.17485/ijst/2016/v9i6/77739
Pham, N.-A., Morrison, A., Schwock, J., Aviel-Ronen, S.,
Iakovlev, V., Tsao, M.-S., Ho, J., Hedley, D.W., 2007.
Quantitative image analysis of immunohistochemical
stains using a CMYK color model. Diagn Pathol 2, 8.
https://doi.org/10.1186/1746-1596-2-8
Tuominen, V.J., Ruotoistenmäki, S., Viitanen, A.,
Jumppanen, M., Isola, J., 2010. ImmunoRatio: a
publicly available web application for quantitative
image analysis of estrogen receptor (ER), progesterone
receptor (PR), and Ki-67. Breast Cancer Res. 12, R56.
https://doi.org/10.1186/bcr2615
Varghese, F., Bukhari, A.B., Malhotra, R., De, A., 2014.
IHC Profiler: An Open Source Plugin for the
Quantitative Evaluation and Automated Scoring of
Immunohistochemistry Images of Human Tissue
Samples. PLoS ONE 9, e96801.
https://doi.org/10.1371/journal.pone.0096801
The Simple Method for Immunohistochemistry (IHC) Analyzing of Intensity using Corel Photo-Paint
R
with CMYK Split-channel
57
