
Factors Associated with Iodine Deficiency Disorders (IDD)
in Elementary School 4 Krebet, Ponorogo, East Java
Nadiyah, Mahdian and Laras Sitoayu
Department of Nutrition Science, Universitas Esa Unggul, Jl. Arjuna Utara No.9, Jakarta, Indonesia
Keywords: IDD, Jambon, Krebet, Iodine, Protein.
Abstract: One of the problems being faced in Ponorogo district is the phenomenon of Idiot Village. One of the
villages known by the nickname is the Krebet Village in Jambon sub-district. Jambon is an endemic area
due to Iodine Deficiency Disorders (IDD). The purpose of this study is to examine the factors associated
with IDD in Elementary School 4 Krebet. This cross-sectional study was conducted from February to June
2016. The population is all students in Elementary School 4 Krebet. The total sample was 72 students. IDD
status was identified using the palpation. Salt iodine content was measured using the iodine test. The
frequency of food consumption from outside the village (FFCO) was collected by a food frequency
questionnaire. Energy and protein intake were assessed using food recall. Nutritional status was measured
using a height for age (HFA) index. The results of multiple logistic regression tests showed that significant
factors associated with the incidence of IDD were iodine salt content (OR=8.7; p=0.003), protein intake
level (OR=6.7; p=0.004), and FFCO (OR=5.8; p=0.009). It is very important for the Government of the
Ponorogo Regency to ensure that used salt truly contains iodine.
1 INTRODUCTION
Iodine deficiency (ID) causes poor school
performance, decreased resistance to infection, lack
of physical strength of children (WHO, 2013),
preventable mental retardation (Egli et al., 2004),
and inhibits the socio-economic growth of the nation
in general (Andersson, Karumbunathan and
Zimmermann, 2012).
The most vulnerable groups to ID are school
children and pregnant women, compared to other
population segments (Benoist et al., 2008).
According to the International Council for Control
of Iodine Deficiency Disorders (ICCIDD), there
were 32 countries with iodine deficiency in 2011,
declined from 54 countries in 2003 (World Health
Organization, 2013).
Iodine Deficiency Disorders (IDD) is still a
public health problem in Indonesia. National
prevalence was still above 5% in 2010 and varied
between provinces. There were still found sub-
districts with a prevalence of IDD above 30%. It was
estimated that around 18.16 million people live in
moderate and severe endemic areas, and 39.24
million people live in mild endemic areas (National
Institute of Health Research and Development,
2010).
According to the Basic Health Research 2013.,
urine iodine concentration (UIC) with a risk of
iodine deficiency among children aged 6-12 years as
14.9μg/L. Classified as endemic when it is observed
that population suffering from goiter enlargement
with the following classification, severe if the Total
Goiter Rate/TGR is or greater than 30%, moderate
if TGR ranges from 20% to 29.9%, mild if TGR
ranges from 5 to 19.9%, and non-endemic if TGR is
less than 5% (Ministry of Health, 2001).
Based on the result of the IDD survey in East
Java, it was found that TGR as 24.8%, classified as
mild endemic. One of the endemic areas in East Java
is Ponorogo Regency, it has a TGR of 12.27%. (East
Java Provincial Health Office, 2009).
Nutrition mapping 2008, which was conducted in
Ponorogo Regency to a sample of 6300 elementary
school children using the palpation, found that 9.7%
of children with grade I goiter, and 0.9% of children
with grade II goiter, as a result, Total Goiter Rate
(TGR) is 10.6% (Ponorogo Regency Health Office,
2010).
One of the endemic areas in the Ponorogo
Regency is Jambon Sub-district. The population in
Nadiyah, ., Mahdian, . and Sitoayu, L.
Factors Associated with Iodine Deficiency Disorders (IDD) in Elementary School 4 Krebet, Ponorogo, East Java.
DOI: 10.5220/0009573001730178
In Proceedings of the 1st International Conference on Health (ICOH 2019), pages 173-178
ISBN: 978-989-758-454-1
Copyright
c
2020 by SCITEPRESS – Science and Technology Publications, Lda. All rights reserved
173

Jambon suffering from IDD as 315 people, the most
are found in Krebet and Sidoharjo Village
(Ponorogo Regency Health Office, 2015). Sidoharjo
Village is located at the end of Jambon Sub-district
and is area expansion from Krebet Village since
September 2007.
Sidoharjo Village is often known as the idiot
village. Out of 6257 total population of Sidoharjo
Village, approximately 249 people have mental
disabilities. It is caused by many factors, including
the location of the village on the slopes of the
limestone mountains with barren land so that it only
can be planted cassava as a staple food that is daily
consumed. Second, the lack of iodine content, even
none, contained in the salt consumed every day
(Ponorogo Regency Health Office, 2014).
Elementary School 4 Krebet is a public primary
school located in Dusun Sidowayah, Sidoharjo
Village, Jambon Sub-district, Ponorogo Regency.
This school accepts all children either normal or
with special needs. Although the Ministry of Health
has developed regulations and guidelines for the
availability of iodized salt, IDD prevalence is still a
significant public health problem. Therefore, this
study aims to examine factors related to IDD among
school children in Elementary School 4 Krebet,
Sidoharjo Village, Jambon, Ponorogo, East Java.
2 METHOD
2.1 Study Design, Time and Location
A school-based cross-sectional study was conducted
in Elementary School 4 Krebet, Dusun Sidowayah,
Sidoharjo Village, Jambon Sub-District, from
February to June 2016. The sub-district is found in
Ponorogo Regency, 20 km from the Ponorogo City.
The village, which is located at the end of Jambon
Sub-district, is area expansion from Krebet Village
since September 2007. Sidoharjo Village is located
at an altitude of 325 meters above sea level, in a
barren land and gets an average rainfall of 2000-
2500 mm once a year, with temperatures of 21-23ºC
(Ponorogo Regency Health Office,2014).
2.2 Sampling Procedure
The sample size was calculated by G-Power
software 3.1.9.2 considering the following
assumptions: 50% expected prevalence of IDD, a
5% error margin and at a 95% confidence level.
After adding a non-response rate of 10%, a sample
size of 72 was obtained. To select study participants,
this study used a systematic sampling technique. The
number of children from each class was divided by
the total number of samples to get the sampling
fraction. In addition, the total number of children
who meet the criteria chosen from each class was
proportional to the population size.
Study participants should meet the inclusion and
exclusion criteria. The inclusion criteria are the child
has lived in the village at least for the last year and
able to communicate. The exclusion criteria are the
child consumed iodine supplement for the last six
months and not present during data collection.
2.3 Data Collection and Procedure
The palpation method of the thyroid gland indicates
the enlargement, surface, and consistency of the
thyroid (Benoist et al., 2008). The palpation was
performed by trained health officers to assess the
size of the thyroid gland. According to the WHO
criteria, goiter was clinically defined: grade-0 when
there is no palpable goiter and categorized as not
suffering from IDD, grade-1 when there is palpable
and visible goiter with extended neck, and grade-2
when visible goiter with the head in normal position
is found (WHO, UNICEF, ICCIDD, 2001). In this
study, grade-1 and grade-2 were categorized as
suffering from IDD.
To specify the iodine content of salt, the
enumerators took the used salt for cooking at the
participant home. Iodine test was used to assess the
iodine content of the salt. Compared with the chart
color, the iodine content of salt was ensured. Iodine
concentration in salt is classified eligible or meet the
requirement when ranging between 30-80 ppm and
ineligible when less than 30 ppm (Ministry of
Health, 2001).
Information on food frequency from outside the
village was collected using a 30 items-Food
Frequency Questionnaire (FFQ). The questionnaire
was completed in the presence of skilled
enumerators. The tool was previously developed and
validated in a preliminary study. Each sample was
asked to answer the details of food in the
considerations column. At first, the reported answer
in FFQ was changed to a frequency score. Score 50
when consumed more than once a day, score 25
when consumed once a day, score 15 for four to six
times a week, score 10 for two to three times a week,
score 1 when consumed once a week, and score 0
when never consumed. Then, the total score from
each sample was divided by total sample to find the
average score, the average is 316.27. Classified to
frequently consumed when the sample’s score is or
ICOH 2019 - 1st International Conference on Health
174

greater than the average score and infrequently
consumed when the sample’s score is less than the
average score (Nadimin, 2011).
Energy and protein intake level was collected by
a 24-hour food recall to record the information of all
foods and beverages consumed by study participant
for two in consecutive days. Energy and protein
intake level was measured by percentage to the
Recommended Dietary Allowance (RDA) 2013.
Good when the intake level is or greater than 80%
RDA and poor when the level is less than 80%
RDA.
The used nutritional status is the Height for Age
(HFA) index, which is used to identify chronic
malnutrition. Z-score was calculated by WHO
Anthroplus software. Classified to stunted when the
HFA index is below -2SD value of z-scores and
normal when the index is or above -2SD (World
Health Organization, 2015).
2.4 Data Analysis
Frequencies and proportions were used to describe
variables as descriptive statistics. A bivariate
analysis using the chi-square test was used to show
the crude odds ratio of each independent variable on
IDD (grade I and II of a goiter). In multivariate
analysis, multiple logistic regression was applied
using a backward method to overcome the presence
of multicollinearity (Santoso et. al., 2005). With the
backward method, the best model is obtained by
eliminating insignificant variables. With a
corresponding 95% confidence interval, crude odds
ratio and adjusted odds ratio were calculated to
exhibit the power of the relationship. A p-value of
<0.05 was chosen to assert statistical significance.
3 RESULTS
More than half (51.4%) of the children were male
and aged ranging between 11-16 years. Nearly half
(41.7%) of the children were stunted and had IDD
(grade 1 and 2 goiter). About three-fourth (76.4%)
of the children had poor energy intake levels. More
than half (56.9%) of children had poor protein intake
levels. Almost one-third (27.8%) of the household
used ineligible iodized salt. About two-thirds
(63.9%) of children infrequently consumed food
from outside the village (Table 1).
The proportion of children who frequently
consumed food from outside the village in the last
week as following, most (94.4%) of them frequently
consumed rice and 76.4% ate tempeh and tofu,
followed by egg (65.3%) as their common animal
food source, then vegetables (46.9 %) and banana
(36.1 %) as the major fruit source. About one-third
(30.5%) of them frequently ate chicken. However,
the consumption of animal food products was low,
in which 17.0, and 9.7 %, respectively of children
ate dairy products and meat such as beef (Figure 1).
The prevalence of goiter was 41.7 %, in which
about 33.4 and 8.3 %, were found with grade 1 and
grade 2 goiter, respectively. The result of the
bivariate logistic regression analysis showed that
energy and protein intake level, iodine concentration
in salt and frequency of food consumption from
outside the village were significantly associated with
IDD. In the multivariate logistic regression analysis,
protein intake level, iodine concentration in salt and
frequency of food consumption from outside the
village remained significantly associated with IDD.
The odds of IDD among children with poor protein
intake level 6.7 times [AOR = 6.7; 95% CI: 1.8,
24.7] higher as compared to children with good
protein intake level. Those used ineligible salt 8.7
times [AOR = 8.7; 95% CI: 2.1, 35.7] higher as
compared to those used eligible iodized salt.
Likewise, the likelihood of IDD among children
infrequently consumed food from outside the village
was 5.9 times [AOR = 5.9; 95% CI: 1.5, 22.3] higher
than that of frequent counterparts (Table 2).
4 DISCUSSION
In this study, the prevalence of IDD or goiter was
41.7%, showed that there is a severe public health
problem. According to the World Health
Organization (WHO), the total goiter rate above 5%
reflects a public health problem (World Health
Organization, 2001).
This study also showed that the application of
iodized salt (72.2%) was lower than the WHO
recommendation (>90%) (World Health
Organization, 2013). Iodine concentration in salt
was found as the most dominant associated factor to
IDD [AOR = 8.7; 95% CI: 2.1, 35.7]. It is known
that the provision of iodine intake through daily
consumption of salt is the most commonly used
method. It has proven its success and has been
recommended by WHO and UNICEF. To accelerate
the achievement of IDD elimination, an agreement
was reached that iodized salt is the best tool to
increase iodine consumption in the effort to
eliminate IDD problems (WHO, UNICEF, ICCIDD,
2001).
Factors Associated with Iodine Deficiency Disorders (IDD) in Elementary School 4 Krebet, Ponorogo, East Java
175
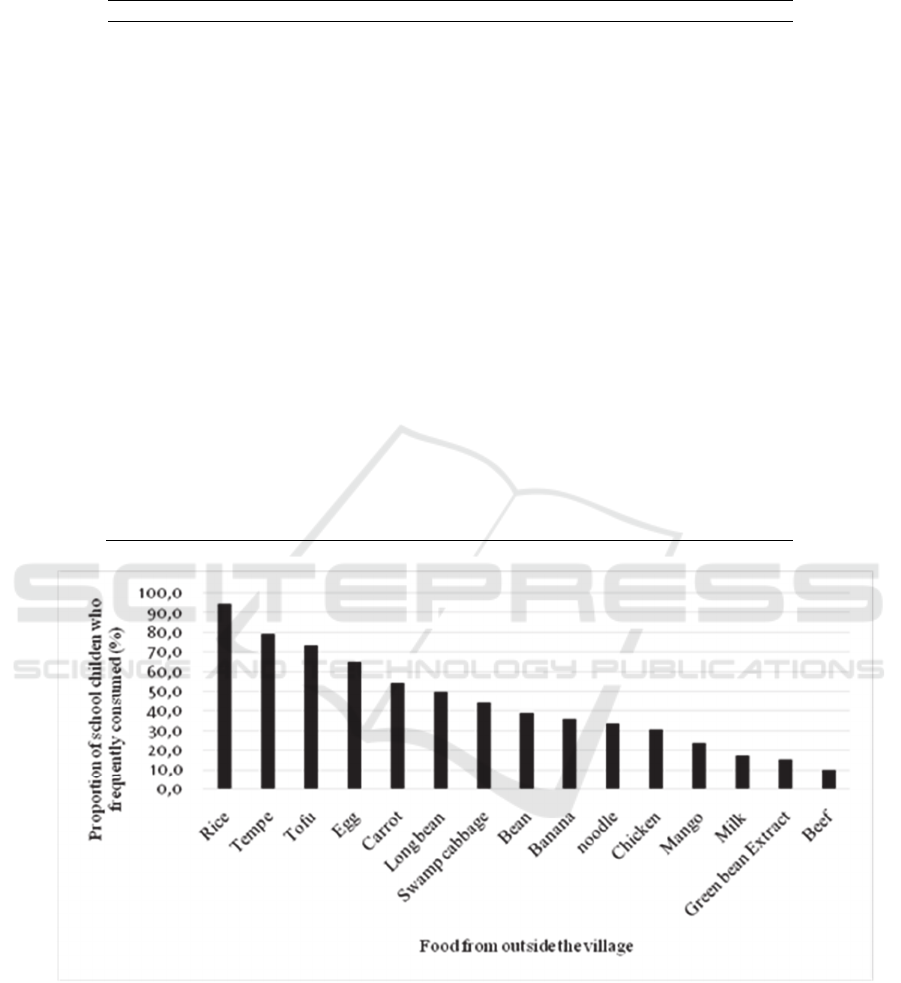
Table 1: Characteristics of school children in Elementary School 4 Krebet, Jambon sub-district, Ponorogo, East Java, 2016.
Characteristics Frequency Percent
Sex
Male 37 51.4
Female 35 48.6
Age (in years)
5-10 35 48.6
11-16 37 51.4
Nutritional status (height for age)
Normal (-2SD to +2SD) 42 58.3
Stunted (<-2SD) 30 41.7
Energy intake level
Good (≥ 80% RDA) 17 23.6
Poor (<80% RDA) 55 76.4
Protein intake level
Good (≥ 80% RDA) 31 43.1
Poor (<80% RDA) 41 56.9
Iodine concentration in salt
Eligible (30-80 ppm) 52 72.2
Ineligible (< 30 ppm) 20 27.8
Frequency of food consumption from outside the
village
Frequent(≥ mean score) 26 36.1
Infrequent (<mean score) 46 63.9
Iodine Deficiency Disorders (IDD)
Yes (grade I and II goiter) 30 41.7
No (grade 0) 42 58.3
Figure 1: Proportion of respondents frequently consumed food from outside the village in the last week.
The majority of children have poor energy and
protein intake levels. Poor energy intake causes
protein anabolism to produce energy and inhibit the
metabolism of the thyroid hormone (Hetzel, 1989).
Poor protein intake level among children is a
significantly associated factor to IDD [AOR = 6.7;
95% CI: 1.8, 24.7]. Based on the dietary survey in
this study, the common dietary protein sources are
tempeh and tofu. Animal sources were not
frequently consumed because it is expensive and the
traditional market is far away.
According to Sauberlich (1999), protein
deficiency inhibits the production of thyroid
hormones, both triiodothyronine (T3) and thyroxine
(T4) are bound to serum proteins. In the production
of thyroid hormone, the initial step is the merger of
ICOH 2019 - 1st International Conference on Health
176

Table 2: Factors associated with iodine deficiency disorder/IDD (grade 1 and 2 goiters) among school children in
Elementary School 4 Krebet, Jambon Sub-District, Ponorogo Regency, East Java, 2016 (n =72).
Charactersitic
Iodine deficiency
disorders
COR
1
(95 % CI)
AOR
2
(95 % CI)
Yes No
Nutritional status
Stunted 10 20 0.5 (0.1, 2.5)
Normal 20 22 1
Energy intake level
Poor 27 28 4.5 (1.3, 9.6)*
Good 3 14
1
Protein intake level
Poor 23 18 4.4 (1.9, 25.1)* 6.7 (1.8, 24.7)*
Good 7 24
1
1
Iodine concentration in salt
Ineligible 14 6 5.2 (2.2, 35.8)* 8.7 (2.1, 35.7)*
Eligible 16 36 1 1
Frequency of food
consumption from outside the
village
Infrequent 25 21 5.0 (1.6, 22.6)* 5.9 (1.5, 22.3)*
Frequent 5 21 1 1
*p< 0.05,
1
Crude Odds Ratio,
2
Adjusted Odds Ratio
iodide into a large protein. In a state of decreased
protein will cause total hormone levels to decrease.
A decrease in released hormones from the thyroid
gland (especially T4) will cause feedback barriers in
the pituitary gland to produce Thyroid Stimulating
Hormone (TSH). The role of protein is also to
neutralize the effect of thiocyanate (Brody, 1993).
The frequency of food consumption from outside
the village was observed as a significantly associated
factor [AOR =5.9; 95% CI: 1.5, 22.3]. Iodine
content in the soil used in agriculture associated with
the incidence of iodine deficiency. Serious
deficiencies still take place in certain regions, even
though iodine supplementation programs have been
able to combat iodine deficiency in many regions of
the world (Brody, 1993).
As located in the highlands, Sidoharjo village has
a lack of food diversity. In order to get other
foodstuffs than local foodstuffs commonly grown,
they should go to traditional markets in other
regions. In addition, the large amount of local food
that commonly can be planted and grown have
goitrogenic substances such as spinach, cassava,
cabbage, and corn.
As research by Ningtyas et al., (2014), another
cause of iodine deficiency disorders (IDD) in Jember
Regency that was identified is the thiocyanate
goitrogenic factor. Papaya leaves, cassava leaves,
cabbage, and bamboo shoot are vegetables with
goitrogenic substances that were consumed daily.
The consumption of foods containing goitrogens
aggravates the development of goiter among children
with iodine deficiency (Brody, 1993). Goitrogens are
substances interfering with the incorporation of iodine
into a protein in the thyroid gland thus disrupt the
production of thyroid hormones.
Lack of food diversity consumed in Sidoharjo
causes a lack of nutrients intake such as selenium
that is important for thyroid metabolism. The
deiodinases are enzymes containing selenium that
are important for the activation of thyroid hormones.
These enzymes catalyze the deiodination of T4 and
produce the active form of thyroid hormone (T3) to
the bloodstream (Brody, 1993).
The study has some limitations. First, this study
used only school children as respondents. Second,
the study used a cross-sectional design thus the
results may not demonstrate the causality.
Factors Associated with Iodine Deficiency Disorders (IDD) in Elementary School 4 Krebet, Ponorogo, East Java
177

5 CONCLUSIONS
The prevalence of iodine deficiency disorders was
high, showing a severe public health problem. The
application of iodized salt in this study was lower
than the WHO recommendation. Moreover, The
dominant associated factor of IDD was ineligible
iodized salt. Hence, there is a necessity to strengthen
the application of salt iodization by the Government
of the Ponorogo Regency and concern must be
directed to schoolchildren to eradicate IDD
efficiently.
ACKNOWLEDGMENTS
The authors would like to deliver their gratefulness
to the study respondents for their participation and
Elementary School 4 Krebet for the study location
support.
REFERENCES
Andersson, M., Karumbunathan, V., Zimmermann,
MB.,2012. Global iodine status in 2011 and trends
over the past decade. J Nutr.,142(4):744–50.
National Institute of Health Research and Development,
2010.Basic Health Research Report2010. Jakarta:
Indonesian Ministry of Health.
National Institute of Health Research and Development,
2013.Basic Health Research Report2013. Jakarta:
Indonesian Ministry of Health.
Benoist, B., McLean, E., Andersson, M., Rogers, L., 2008.
Iodine deficiency in 2007: global progress since 2003.
Food Nutr Bull., 29(3):195–202.
Brody, T., 1993. Nutritional Biochemistry, Academic
Press. San Diego, Orlando, Second Edition.
Ministry of Health, 2001.Guidelines for Implementing
Iodized Salt Monitoring at the Community Level.
Jakarta: Indonesian Ministry of Health.
East Java Provincial Health Office, 2009. East Java
Province Health Profile, 2009. Surabaya: East Java
Provincial Health Office.
Ponorogo Regency Health Office, 2014. Profile of
Sidoharjo Village, JambonSub-District, Ponorogo
Regency. Ponorogo Regency: Ponorogo Regency
Health Office.
Ponorogo Regency Health Office, 2010. IDD Issues in
Ponorogo Regency.Ponorogo Regency: Ponorogo
Regency Health Office.
Ponorogo Regency Health Office, 2015. Overview of
Eradicating Iodine Deficiency Disorder Problems in
PonorogoRegency 2015. Ponorogo Regency:
Ponorogo Regency Health Office.
Egli, I. M., Allen, H., El Bahi, T., Andersson, M., De
Benoist, B., 2004. Iodine status worldwide: WHO
global database on iodine deficiency, World Health
Organization. Geneva
Hetzel, B. S.,1989. An Overview of the Prevention and
Control of Iodine Deficiency Disorder. In: Hetzel, J.T.
Dunn and J. B. Stanbury (ed), New York: Elsevier
Science Publisher, pp. 7-29
Nadimin, 2011. Diet Pattern, Physical Activity and
Nutritional Status among South Sulawesi Provincial
Health Office Staffs. Media GiziPangan, 11(1).
Ningtyas, F. W., Asdie, A.H., Julia, M., Prabandari, Y.S.,
2014. Local Wisdom Exploration of Community in
Goitrogenic Food Consumption to Iodium Deficiency
Disorder. JurnalKesehatanMasyarakatNasional, 8(7).
Santoso, P. B., et al., 2005. Statistical Analysis with
Microsoft Excel and SPSS. ANDI Publisher.
Yogyakarta.
Sauberlich, H. E., 1999. Assessment of Nutritional Status,
CRC Press. New York. Second Edition
WHO, UNICEF, ICCIDD, 2001. Assessment of iodine
deficiency disorders and monitoring their elimination:
a guide for programme managers, WHO/NHD/01.1.
Geneva
World Health Organization, 2013. Urinary iodine
concentrations for determining iodine status
deficiency in populations. Vitamin and Mineral
Nutrition Information System, WHO. Geneva
World Health Organization, 2015. Global Database on
Child Growth and Malnutrition. Available at:
https://www.who.int/nutgrowthdb/en/. [Accessed
25September 2019).
ICOH 2019 - 1st International Conference on Health
178
