
Comparative Economic between Bat Algorithm (Ba) and Particle
Swarm Optimization (Pso) for Solving Economy Dispatch
Vicky Andria Kusuma
1
, Restu Mukti Utomo
2
, Lucky Dwi Saputra
1
, Yuli Prasetyo
2
1
Institut Teknologi Kalimantan
2
Politeknik Negeri Balikpapan, Electrical Engineering, East Kalimantan, Indonesia
Keywords: Artificial Intelligent, Bat algorithm, Economy dispatch, Particle Swarm Optimization (PSO)
Abstract: Artificial intelligence is intelligence made using the program and added to a system to efficiently accomplish
human work. In this research utilizing an artificial intelligence that is the bat algorithm method to solve
economic dispatch problems in PT. PERTAMINA RU V BALIKPAPAN This study consists of determining
the configuration of the generation of power in eight generators and steam requirements, the efficiency of the
configuration produced. In the 10 MW load variation, the bat algorithm produces a generation cost of 195.88
tons / h while the algorithm The PSO generates 196.83 tons / h. This shows that the bat algorithm can obtain
a generation cost that is smaller than the PSO, whereas the convergent speed of the bat algorithm is faster than
the PSO algorithm, this is shown from the 865-iteration algorithm in the bat can converge whereas at PSO
requires iteration to 956. At 20 MW load variation the bat algorithm is better than the PSO algorithm in terms
of the generation cost value and the speed of this is shown from the bat algorithm generation value is 201.96
tons / h and the iteration speed is 669 while the large PSO algorithm generation is 203.23 tons / h and speed
the iteration is 976
1 INTRODUCTION
Electricity is an important component in the
household, industrial, and commercial activities.
Electricity is obtained from the activity of converting
primary energy, which is then converted through
generators (Kautsar and Nugroho, 2017). A generator
is an electrical device used to convert mechanical
energy into electrical energy. Companies like PT.
PERTAMINA RU V has its own generator to meet its
own electricity needs. Many things affect the amount
of electricity generation expenditure itself, one of
which is the operating costs of a generator or
generator. The operation of a generator or generator
is very dependent on fuel, so this can be a special
concern because some of the operating costs incurred
are for fuel purposes (Ilyas, 2010). Analysis of
optimal power is needed to be able to minimize the
cost of generation, commonly known as economic
dispatch. Economic dispatch is the distribution of the
load on generating units in the system optimally
economic at a certain system price (Ilyas, 2010). The
optimization algorithm is one method that can be
applied to solve economic dispatch problems. In the
previous research, a modified improve particle swarm
optimization algorithm was applied to the Java Bali
500kV thermal system generator. This method can
reduce generation costs by 4.64% (Ilyas, 2010).
Contraction factor-based particle Swarm
optimization is an algorithm used to solve problems
in the Java Bali 500kV thermal generator system.
This method can reduce the cost of the generation of
Rp 995,318,000.00 per hour (Kanata, 2013). The Bat
algorithm can provide accuracy using Naive Bayes as
its evaluator, which is quite promising at 98.29%
when compared to the Exhaustive Search and Genetic
Search methods, which respectively yield 82.97%
and 82.55% results (Pallavi, 2013). Economic
dispatch problems are experienced by various
companies that have their own generators. PT.
PERTAMINA RU V Balikpapan has the same
problem because of PT. PERTAMINA RU V
Balikpapan has a generator to operate refineries to be
able to process the products they process. These
problems form the background of this study. The
author implements the bat algorithm at PT.
272
Kusuma, V., Utomo, R., Saputra, L. and Prasetyo, Y.
Comparative Economic between Bat Algorithm (Ba) and Particle Swarm Optimization (Pso) for Solving Economy Dispatch.
DOI: 10.5220/0009490402720280
In Proceedings of the 1st International Conference on Industrial Technology (ICONIT 2019), pages 272-280
ISBN: 978-989-758-434-3
Copyright
c
2020 by SCITEPRESS – Science and Technology Publications, Lda. All rights reserved

PERTAMINA RU V Balikpapan. The bat algorithm
was chosen because the bat algorithm is included in
the new algorithm method and based on previous
research the bat algorithm has a more optimal
optimization result, so it can produce more
economical costs (Kautsar, 2017) The bat algorithm
provides better performance when compared to some
other algorithms such as the algorithm Genetics,
Particle Swarm Optimization and Geometric Particle
Swarm Optimization (Ahmad, 2013) and based on
research in economic dispatch optimization problem
bat algorithm able to save 1,23% compare to actual
cost and 0.12% to firefly algorithm (Wulandhari et
al., 2018), that's the reason why bat a was chosen. The
target to be achieved by the author is the bat algorithm
can determine the configuration of the generator
power distribution PT. PERTAMINA RU V
Balikpapan, knowing the efficiency of the
configuration produced in terms of expenditure. The
results obtained will be compared using Particle
Swarm Optimization (PSO).
2 THEORETICAL BASIS
Work on this research requires information -
information that can help the process of doing
research well. This information is written in this
section. Information about the definition of economic
dispatch, bat algorithm, and particle swarm
optimization.
2.1 Economic Dispatch
The operation of a power plant is very dependent on
fuel because most of the operating costs incurred are
for fuel purposes. Therefore, saving fuel costs in a
small percentage can have a very large effect on
saving operating costs. To produce electricity in a
power system requires a way how to make the cost of
generator fuel consumption or operating costs of the
whole system as minimum as possible by determining
the combination of the output power of each
generating unit under the constraints of the demands
of the system load and the generation capability limit
of each generating unit. This method is known as the
Economic Dispatch (ED). A power system consisting
of various thermal generating units used to meet the
electricity needs to be carried out optimally and
economically among the generating units in order to
obtain a minimum overall generation cost (Dewa,
2016). The economic dispatch problem commonly
found in a thermal generation is determining the
power output of each power plant that can meet the
demand for power at a minimum cost while still
considering the limits of generator generation (Rajab
and Faharuddin, 2014). The following is modeling
used for economic dispatch problems.
1
()
N
ii
i
Ct C P
(1)
2
()
ii iiiii
CP a bP cP
(2)
Where:
Ct: = Large costs required in the form of rupiah
or steam consumption
N = Total generator available
CiPi = Generation cost from generator i (RP /
hour) or (Ton / hour)
ai, bi, ci = Coefficient of generator i
Pi = Large power generator (MW)
i: = Index of dispatchable units
2.2 Bat Algorithm
The bat algorithm is an algorithm that was introduced
by Xin-She Yang in 2010. The bat algorithm is found
based on modeling of the behavior of bats in nature.
Bats use echolocation or the ability to use waves to
determine distances and differences between food or
prey and obstacles; bats fly irregularly, taking into
account the speed, position, and frequency,
wavelength, and loudness to search for food. Bats can
adjust wavelengths automatically (Yang, 2010). The
bat algorithm can adjust the frequency (f) and
loudness (A) values when hunting for prey, and if the
bat encounters a close prey then the bat will increase
the pulse rate (r) so that the echolocation frequency
will increase while the loudness level will decrease to
prevent the prey from escaping self. The bat
algorithm has several parameters that are determined
based on the characteristics of the bat. These
parameters are written in equation 3 to equation 10.
min max min
()
i
ff f f
( 3)
1
()
tt t
ii i i
vv xxf
( 4)
1tt t
ii i
x
xv
(5)
1tt
ii
A
( 6)
10
(1 exp( ))
t
ii
rr t
( 7)
min max min
()
i
ff f f
( 8)
()*(1, )
ref
i
x
lb ub lb rand population
( 9)
(1, )
ref
i
v random population
(10)
Where:
fi = Bat frequency i.
β = Random numbers from 0 to 1.
Comparative Economic between Bat Algorithm (Ba) and Particle Swarm Optimization (Pso) for Solving Economy Dispatch
273
t
i
v
= Bat velocity i on t-iteration.
t
i
x
= Bat position i in the t-iteration.
1t
i
A
= Bat loudness in the t-iteration.
1t
i
r
= Bat pulse rate i on the t-iteration.
i = Index of bat members.
t = Index of iteration.
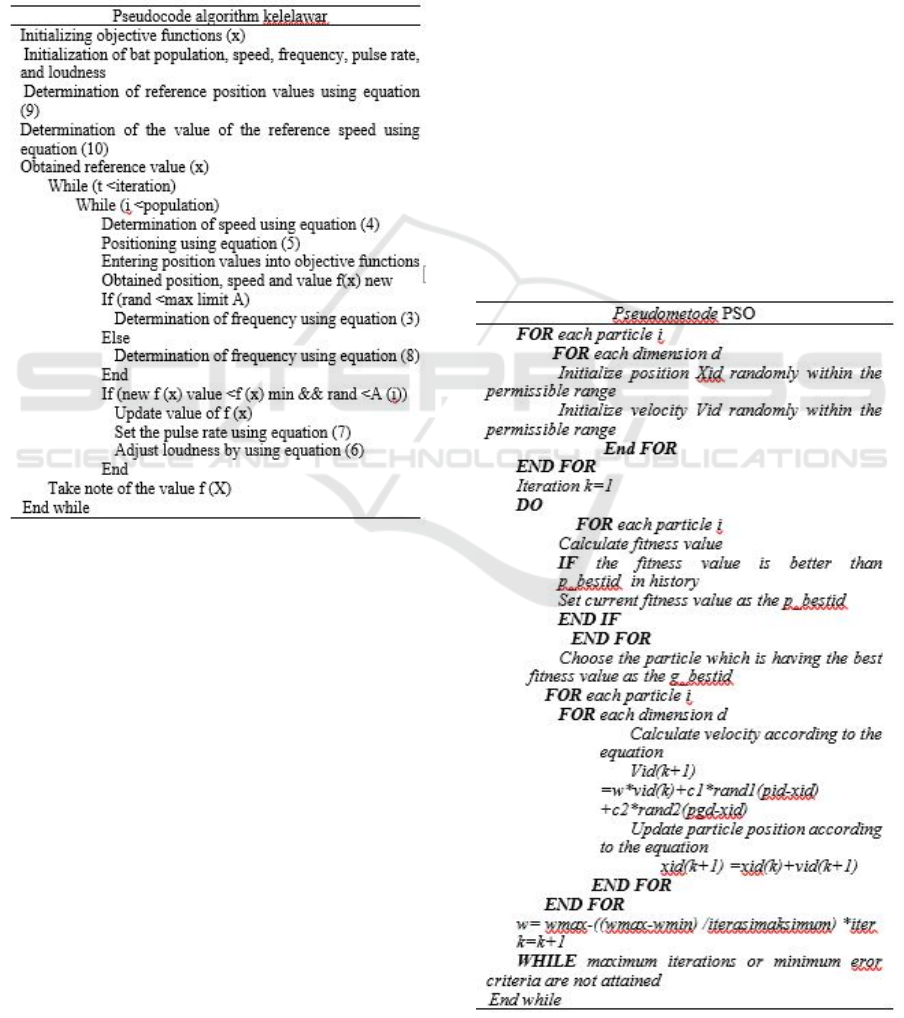
Table 1: Pseudocode bat algorithm
The equations found in Tables 3 to 10 are formed
in a program arrangement so that they can solve the
problem. The use of these equations will be discussed
in pseudocode. The bat algorithm pseudocode is in
Table 1.
2.3 Particle Swarm Optimization
PSO is a population-based optimization technique
developed by James Kennedy and Russ Eberhart in
1995, inspired by the behavior of flocks of birds or
fish. This method uses a set of particles that work
together, where each particle represents a candidate
solution to explore possible solutions to optimization
problems. Each particle is initialized randomly, and
then the particles are allowed to "fly." At each
optimization step, each particle will evaluate its
ability and the ability of the surrounding particles.
Each particle can store the solution that produces the
best capability as one of the best solution candidates
for all the particles around it.
(1)
11 2 2
()()
kkkkkkkk
id i d id id d id
v v c r Pbest x c r Gbest x
(11)
11kk
id id
k
id
x
xv
(12)
Where:
k
id
x
= particle position i, dimension d on
iteration k
12
,
kk
rr
= random values between 0 and 1
12
,cc
= coefficient of repetition
k
id
Pbest
= the best local position of particle i, on
iteration
k
d
Gbest
= the best global position on particle i, on
Iteration
k
id
v
= particle velocity i, dimension d in
iteration k
Explanation of equations 11 and 12 is discussed
with the Pseudocode PSO method in table 2 (Yang,
2010).
Table 2: Pseudocode PSO
ICONIT 2019 - International Conference on Industrial Technology
274
3 APPLICATION OF THE
METHOD
The method used to conduct research in this journal
is to determine the cost function and determine the
maximum and minimum generator limits.
3.1 Minimum and Maximum
Generator Limits
PT PERTAMINA RU V BALIKPAPAN has eight
steam turbine generator (STG) generation systems,
with four generators in power plant 1 and 4 generators
in power plant 2.
Table 3: Minimum and maximum limit generator
Generator
Limit
Minimum
(MW)
Maximum
(MW)
Power Plant 2
Steam Turbine Generator 2.1 0 8
Steam Turbine Generator 2.2 0 8
Steam Turbine Generator 2.3 0 8
Steam Turbine Generator 2.4 0 8
Generator
Limit
Minimum
(MW)
Maximum
(MW)
Power Plant 1
Steam Turbine Generator 1.5 0 8
Steam Turbine Generator 1.6 0 8
Steam Turbine Generator 1.4 0 8
Steam Turbine Generator 1.3 0 8
Table 3 shows the maximum and minimum
generation limits for each generator. The following is
an example explanation of table 3.1 Steam turbine
generator 2.1 has a minimum generation limit of 0
MW or is considered not to be used, and the
maximum limit of generation is 8 MW, so a steam
turbine generator 2.1 may not be generated more than
8 MW.
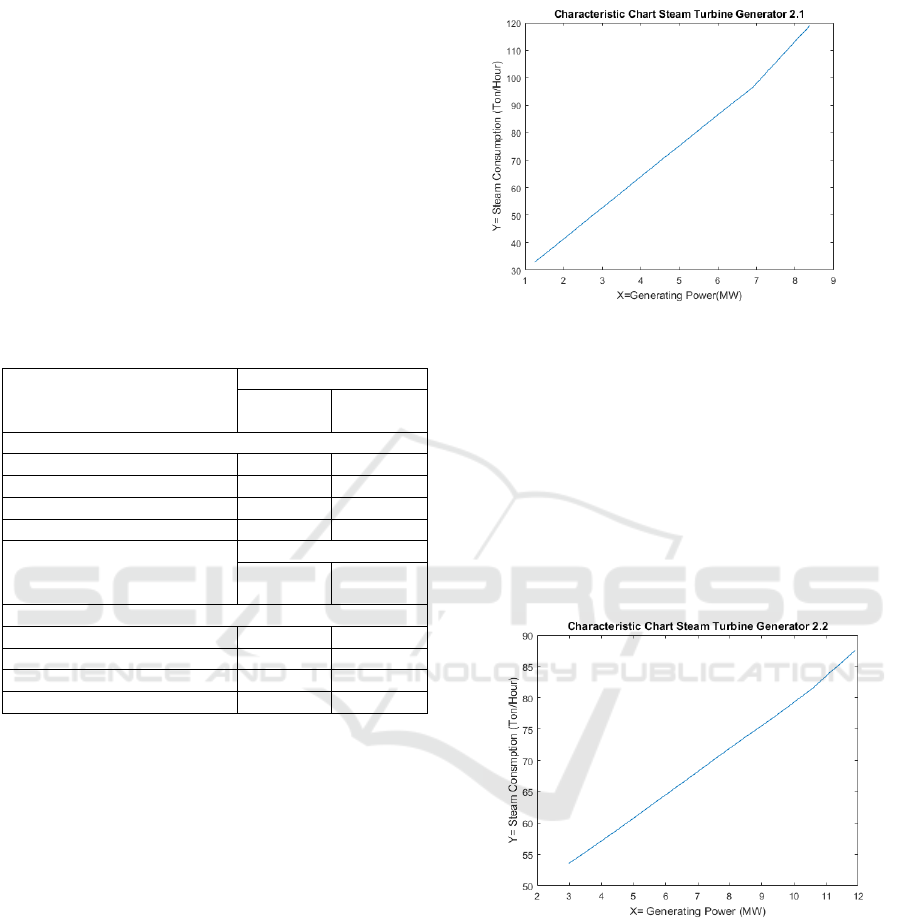
3.2 Cost Function STG 2.1
Figure 1 shows a graph of the ratio of power to steam
consumption in a steam turbine generator 2.1. From
the picture, we can take the following example for
STG 2.1, generating 3 MW of power. It takes 48.1-
tons of steam in one hour, whereas to generate 6 MW
of electricity requires 82.2-tons in one hour. The
formation of the cost function can be done using the
data in Figure 1, in equation 13 it is a form of the cost
function of Steam Turbine Generator 2.1.
2
0.24209 9.3967 21.838yxx
(13)
Figure 1: Characteristics STG 2.1
3.3 Cost Function STG 2.2
Figure 2 shows a graph of the ratio of power to steam
consumption in a steam turbine generator 2.2. It can
be seen that generating power starts from 3 MW and
requires the consumption of 43 tons in one hour while
generating 6 MW requires 63 tons in one hour. The
formation of the cost function on Steam Turbine
Generator 2.2 can be done using data 2. The results of
the cost function are in equation 14.
2
0.034 3.25 43.6yxx
(14)
Figure 2: Characteristics STG 2.2
3.4 Cost Function STG 2.3
Figure 3 shows the graph of the comparison of power
with steam consumption in a 2.3 2.3 steam turbine
generator. It can be seen that the generation power
starts from 3 MW and requires the consumption of 43
tons in one hour, whereas to generate 6 MW requires
63 tons in one hour in one hour, whereas to generate
6 MW requires 63-tons in one hour. The formation of
Comparative Economic between Bat Algorithm (Ba) and Particle Swarm Optimization (Pso) for Solving Economy Dispatch
275
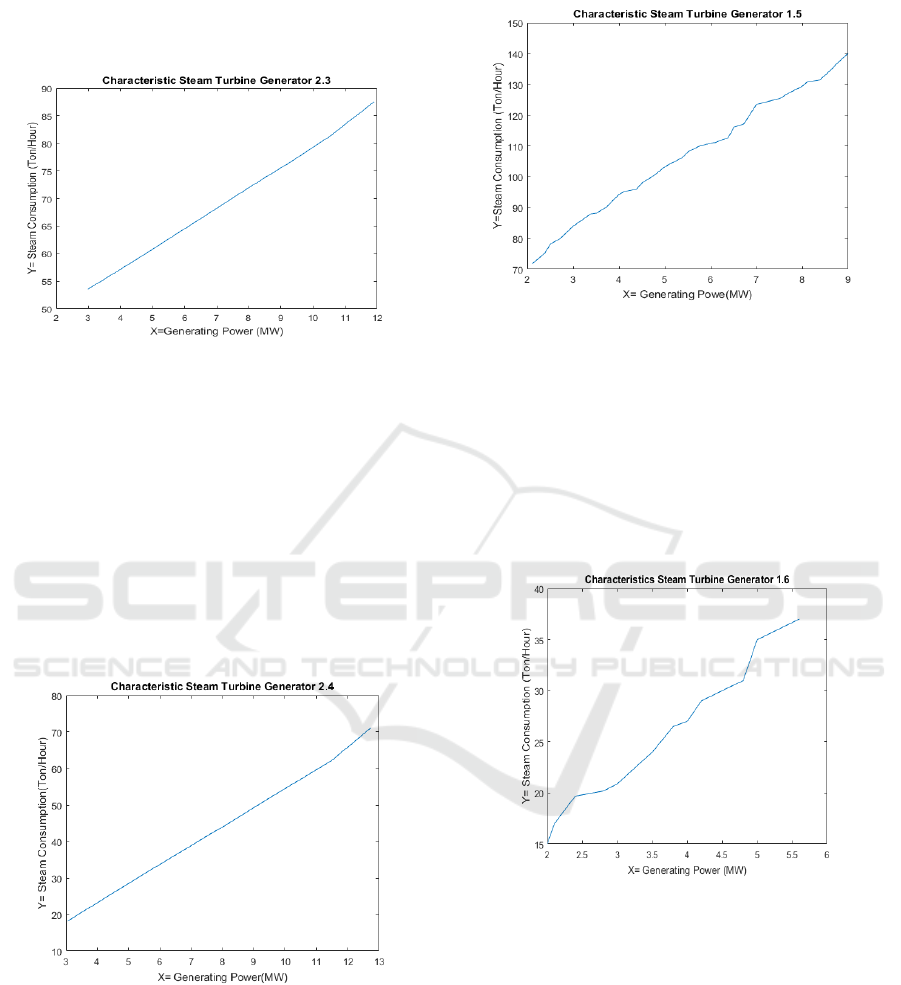
the cost function on Steam Turbine Generator 2.2 can
be done using data 2. The results of the cost function
are in equation 15.
2
0.034 3.25 43.6yxx
(15)
Figure 3: Characteristics STG 2.3
3.5 Cost Function STG 2.4
Figure 4 shows a graph comparing the power with
steam consumption in a 2.4 steam turbine generator.
From the picture, we can take the following example
for STG 2.4 generating 3 MW of power required
steam of 19-tons in one hour. The cost function can
be done using the data in Figure 4, in equation 16, a
form of the cost function of Steam Turbine Generator
2.4.
2
0.047 4.6 4.3yxx
(16)
Figure 4: Characteristics STG 2.4
3.6 Cost Function STG 1.5
Based on Figure 5, the cost function of Steam Turbine
Generator 1.5 can be established. In equation 17 is the
result of forming a cost function from Steam Turbine
Generator 1.5.
2
0.17 11 51yxx
(17)
Figure 5: Characteristics STG 1.5
3.7 Cost Function STG 1.6
Based on Figure 6, the cost function of Steam
Turbine Generator 1.6 can be established. In
equation 18 is the result of forming a cost function
from Steam Turbine Generator 1.6.
2
0.16 4.7 6.1yxx
(18)
Figure 6: Characteristics STG 1.6
3.8 Cost Function STG 1.4
Based on Figure 7, the cost function of Steam Turbine
Generator 1.4 can be established. In equation 19 is the
result of forming the cost function of Steam Turbine
Generator 1.4.
2
2.5 20 16yxx
(19)
ICONIT 2019 - International Conference on Industrial Technology
276
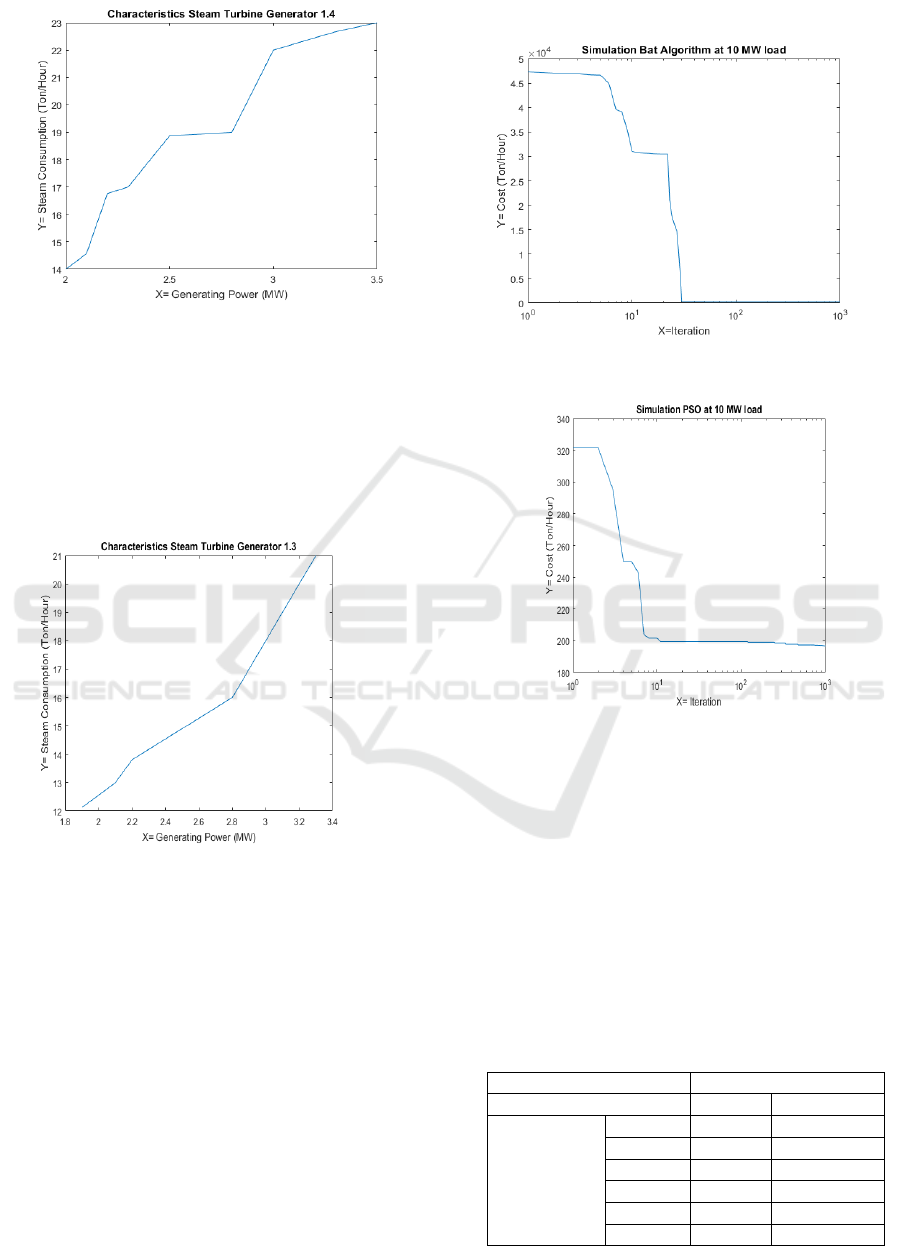
Figure 7: Characteristics STG 1.4
3.9 Cost Function STG 1.3
Based on Figure 8, the cost function of Steam Turbine
Generator 1.3 can be established. In equation 20 is the
result of forming the cost function of Steam Turbine
Generator 1.3.
2
3.1 10 21yxx
(20)
Figure 8: Characteristics STG 1.3
4 RESULT AND ANALYSIS
Economic dispatch simulation is performed using the
bat algorithm method and the PSO algorithm. The
simulation is carried out using MATLAB software.
4.1 Results of Simulations for 10 MW
Loads
Determination of the bat algorithm convergence
curve in solving economic dispatch is simulated with
1000 iterations, and the load requirement is 10 MW.
The convergence curve of the economic dispatch
problem is shown in Figure 9, while in Figure 10
shows the simulation results of the PSO algorithm.
Figure 9: The result of simulation bat algorithm at 10 MW
load
Figure 10 The result of simulation PSO at 10 MW load
Based on Figure 9, the bat algorithm can converge
at 865 iterations with a total expenditure of 195.88
Tons/hour. Figure 10 shows that the PSO algorithm
can converge at 956 iterations, while the generation
cost is 196.83 tons/hour. Based on the speed of the
algorithm to reach the convergence point, the bat
algorithm is better than the PSO algorithm and to
obtain the minimum expenditure costs obtained by
the bat algorithm with a difference of 0.95 Ton /
Hours. Table 4 shows the distribution of load on the
generator at a power requirement of 10 MW.
Table 4: Distribution load generator at 10 MW load
Load (MW) 10
Algorithm PSO BA
Load
distribution
(MW)
STG 2.1 0 0
STG 2.2 4,83 0,16
STG 2.3 1,48 7,61
STG 2.4 1,50 0,04
STG 1.5 0 0,01
STG 1.6 0 0
Comparative Economic between Bat Algorithm (Ba) and Particle Swarm Optimization (Pso) for Solving Economy Dispatch
277
STG 1.4 0 0
STG 1.3 2,20 2,18
Cost (ton/h) 196,83 195,88
Iteration 956 865
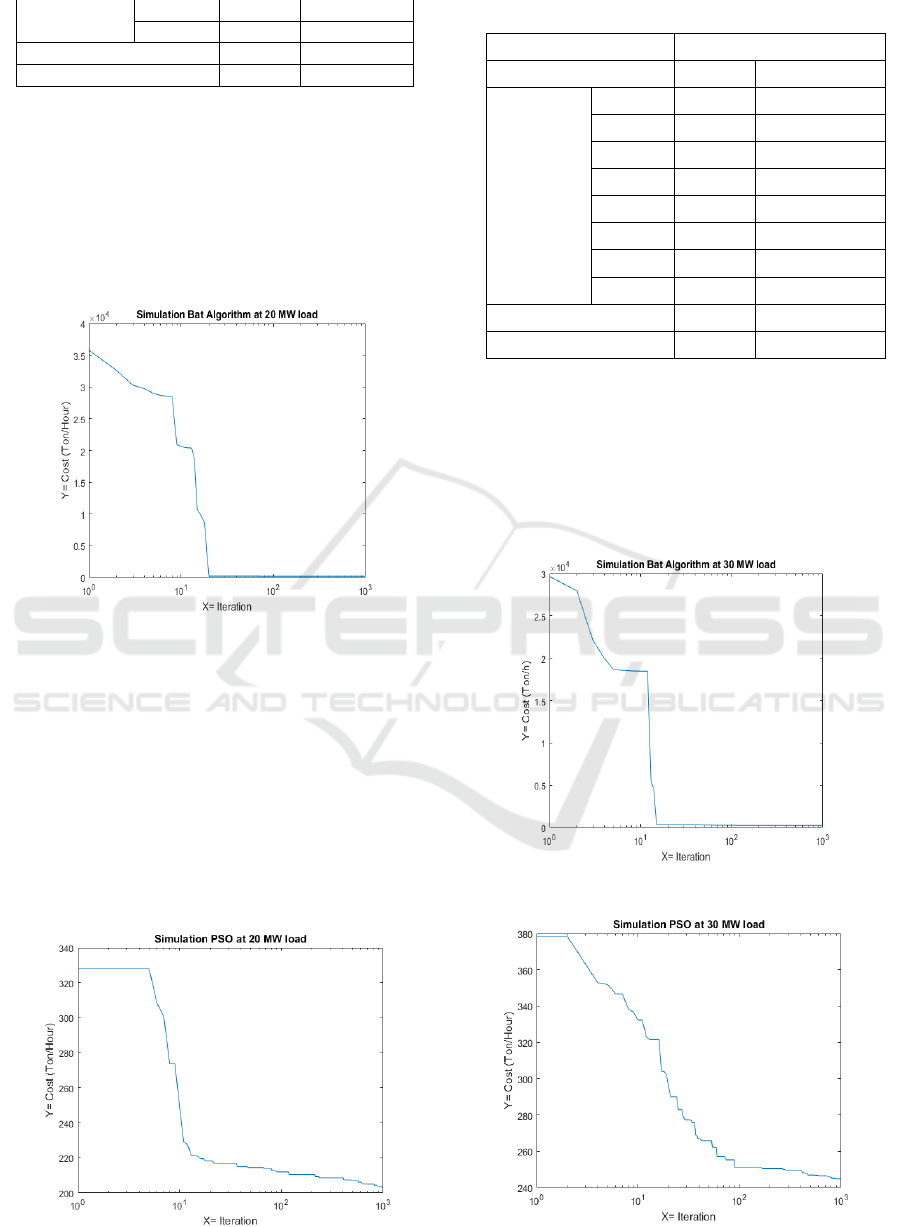
4.2 Results of Simulations for 20 MW
Loads
This simulation is carried out using a power
requirement of 20 MW. Figure 11 shows the
convergence curve of the bat algorithm at a load of 20
MW, while in Figure 12 shows the convergence curve
of the PSO algorithm.
Figure 11: The result of simulation Bat Algorithm (BA) at
20 MW load
Based on Figure 3, the bat algorithm convergence
curve is obtained at 669 iterations while the required
cost is 201.95 Tons / Hour. Figure 4 shows that PSO
can converge at 976 iterations with a cost of 203.23
ton/hour. By comparing the simulation results, it is
obtained that from the speed of the superior bat
algorithm with converging at 669 iterations while
PSO converges at 976 iterations. From the results
side, the bat algorithm is better than the PSO
algorithm. Table 5 shows the distribution of generator
power at a load of 20 MW.
Figure 12: The result of simulation PSO at 20 MW load
Table 5: Distribution load generator at 20 MW load
Load (MW) 20
Algorithm PSO BA
load
distribution
(MW)
STG 2.1
0 0
STG 2.2
4,00 4,66
STG 2.3
4,93 5,13
STG 2.4
0,38 0
STG 1.5
0 0
STG 1.6
0,50 0,01
STG 1.4
8,00 8
STG 1.3
2,20 2,20
Cost (ton/h)
203,23 201,96
Iteration
976 669
4.3 Results of Simulations for 30 MW
Loads
Figure 13 shows the results of the bat algorithm
simulation in the form of convergent curves, while in
Figure 14 shows the simulation results of the PSO
algorithm.
Figure 13: The result of simulation Bat algorithm at 30 MW
load
Figure 14: The result of simulation PSO at 30 MW load
ICONIT 2019 - International Conference on Industrial Technology
278

From Figure 13 and Figure 14, it can be seen that
in terms of speed, the bat algorithm is superior to the
PSO algorithm. Based on Figure 13, the bat algorithm
converges at 359 iterations. Figure 14 shows that the
PSO algorithm converges at 967 iterations. In terms
of the value generated, the bat algorithm is better than
the PSO algorithm. The value generated by the bat
algorithm is 242,765 Tons / Hour. In the PSO
algorithm, the resulting value is 244.98 Tons/hour.
From the two values, it can be seen that the results
issued by the bat algorithm are smaller. Table 6 shows
the distribution of generator power at a load of 30
MW.
Table 6: Distribution load generator at 30 MW load
Load (MW) 30
Algorithm PSO BA
load
distribution
(MW)
STG 2.1
0 0
STG 2.2
6,90 8
STG 2.3
7,30 8
STG 2.4
4,26 3,29
STG 1.5
0 0
STG 1.6
1,28 0,28
STG 1.4
8 8
STG 1.3
2,26 2,43
Cost (ton/h)
244,99 242,77
Iteration
967 359
4.4 Comparison of Algorithmic
Statistical Data
Statistical data consists of the best value, the worst
value, the average and the standard deviation of the
cost of expenditure by carrying out five times the data
collection with 1000 iterations and the load used is
32.7 MW. Statistical data is shown in table 7.
Table 7: Comperasion algorithm at statistic value
Algorithm
Best
value
(ton/h)
Worst
value
(ton/h)
Average
value
(ton/h)
STD
BAT 256,20 256,45 256,26 0,10
PSO 256,50 258,71 257,12 0,82
Based on statistical data in table 7, the minimum
cost (best value) is obtained by the bat algorithm
while the highest minimum cost (worst value) is
obtained by the PSO method, on average the bat
algorithm is superior compared to the PSO method
fixed at the standard deviation algorithm bat at 5
times of data retrieval the data difference is very small
at 0.09 while the PSO method is very large for data
differences in the data collection process that is equal
to 0.82 standard deviations the more the value is close
to zero then the better the program is made better.
5 CONCLUSIONS
Based on the results of experiments by comparing the
bat algorithm with the PSO algorithm. A comparison
of the two algorithms is made using three load
variations. The variations used are 10 MW, 20 MW,
and 30 MW. Statistical testing was carried out using
a load of 32.7 MW. In the 10 MW load variation the
bat algorithm produces a generation cost of 195.88
tons / h while the PSO algorithm generates 196.83
tons / h this shows that the bat algorithm can obtain a
generation cost that is less than the PSO, whereas at
the convergent convergence speed bats faster than the
PSO algorithm this is shown from the 865 iterations
to the bat algorithm can converge whereas the PSO
requires an iteration to 956. At 20 MW load variations
the bat algorithm is better than the PSO algorithm in
terms of the cost of generation and speed it is shown
from the value bat algorithm generation is 201.96 tons
/ h and iteration speed is 669 while the PSO algorithm
is 203.23 tons / h and iteration speed is 976. At 30
MW load variation, the bat algorithm is also better on
both sides. In the generation of 242.77 tons / h and for
iteration speed is 359. While in the PSO algorithm,
the generation rate is 244.99 tons / h, and the iteration
speed is 967. Based on the static test conducted by the
bat algorithm also obtained good values with STD of
0.1 while the PSO algorithm of 0.82.
REFERENCES
Ahmed Majid, Taha and Alicia Y.C. Tang. (2013) “Bat
Algorithm for Rough Set Attribute Reduction”. Journal
of Theoretical and Applied Information Technology,
Vol 51, No.1
Dewa, M., 2016. Perancangan Operasi Optimal Pembangkit
Listrik Tenaga Diesel (PLTD) dan Pembangkit Listrik
Tenaga Biogas (PLTBiogas) di Kabupaten Kepulauan
Meranti Menggunakan Metode Ekonomi Dispatch,
Jurnal Jom FTEKNIK, Volume 3, No 2
Ilyas, A., Penangsang, O., Soeprijanto, A., 2010.
Optimisasi Economic Dispatch Pembangkit Termal
Sistem 500 kV Jawa Bali Menggunakan Modified
Improved Particle Swarm Optimization, National
Conference: Design and Application of Technology,
Kanata, S., 2013. CFBPSO sebagai Solusi Economic
Dispatch pada Sistem Kelistrikan 500 kV Jawa-Bali,
Jurnal JNTETI, Vol 2, No 4
Comparative Economic between Bat Algorithm (Ba) and Particle Swarm Optimization (Pso) for Solving Economy Dispatch
279

Kim, S., 2016." A new metric of absolute percentage eror
for intermittent demand forecasts", International
Journal of Forecasting, Vol 32
Kautsar, F.M., Nugroho, A., 2017. Optimasi Ekonomis
Pembangkit PLTG di PLTGU Tambak Lorok
Menggunakan Algoritma Kelelawar, Jurnal Transient,
Vol 6, No 2.
Nugroho, A., 2006. Metode Pengaturan Penggunaan
Tenaga Listrik dalam Upaya Penghematan Bahan
Bakar Pembangkit dan Energi, Jurnal Transmisi, vol
11, No.1.
Rajab, A., Faharuddin, A., 2014. Pembagian Beban Secara
Ekonomis Pembangkit-Pembangkit Listrik Unit Termal
Menggunakan Kombinasi Metode Pemrograman
Dinamis dan Penyelesaian Secara Analitis, Artikel
Penelitian Dosen Muda, Vol 1
Syah, K., Dachlan, H.S., Hasanah, R.N., 2012. Analisis
Perbandingan Economic Dispatch Pembangkit
Menggunakan Metode Lagrange dan CFPSO, Jurnal
EECCIS, Vol 6, No.1.
Wulandhari, L.A., Komsiyah, S., Wicaksono, W., 2018. Bat
Algorithm Implementation on Economic Dispatch
Optimization Problem. Procedia Computer Science
135, 275–282.
https://doi.org/10.1016/j.procs.2018.08.175
Yang, X.-S., 2010. A New Metaheuristic Bat-Inspired
Algorithm, in: González, J.R., Pelta, D.A., Cruz, C.,
Terrazas, G., Krasnogor, N. (Eds.), Nature Inspired
Cooperative Strategies for Optimization (NICSO
2010). Springer Berlin Heidelberg, Berlin, Heidelberg,
pp. 65–74.
ICONIT 2019 - International Conference on Industrial Technology
280
