
Shipyard Employees’ Motivation towards Safety Behavior: Factor
Analysis with Social Cognitive Theory Approach
Dyah Santhi Dewi, Fasya Hana Zahda, Adithya Sudiarno
Department of Industrial Engineering, Institut of Teknologi Sepuluh Nopember (ITS)
Jl. Arief Rahman Hakim, Surabaya 60111 Indonesia
Keywords: Safety Behavior, Social Cognitive Theory, Shipyard, Structural Equation Modeling
Abstract: Ships are important transportation modes used in the logistics and maritime industry in general. Many
accidents have occurred in the maritime industry, and the root cause of those accidents is the unsafe behavior
done by the employees. This research aims to analyze the factors that motivate the safety behavior of shipyard
employees. The model that will be used refers to Social Cognitive Theory (SCT). In SCT, the variables used
to construct the model are environmental factors (FL), management commitment (KM), safety-efficacy (SE),
employee involvement in safety (TK), and work safety behavior (PA). From those five variables, 11 research
hypotheses are established. Data is collected by distributing offline questionnaires to field employees,
supervisors, and safety management at PT. DTPS. The number of respondents involved was 173 respondents,
which is then modeled by using the structural equation modeling (SEM) method. The result shows that four
of the eleven hypotheses are rejected. In addition to that, TK has an important role in motivating safety
behavior in the workplace, which is subsequently followed by SE. Therefore, it is needed to change the
behavior and culture of an individual at the workplace to improve safety behavior.
1 INTRODUCTION
Many accidents have occurred, triggered by unsafe
behavior. Many attempts have been made to reduce
accidents. However, the number of accidents is not
automatically decreasing. In the logistics and
maritime industry, ships are one of the important
transportation modes, and its quality should be a
priority. Ships should be made through reliable
processes as it guarantees the safety of the passenger,
product, as well as, employees who operate the ships.
While the safety of employees who makes the ships
is also important in many shipyard companies,
employees’ motivation in regard to safety is still low.
Factors that influence shipyard employee motivation
toward safety behavior need to be identified so that
the shipyard company can take corrective actions to
promote safe behavior and reduce the number of
accidents. Based on this, this research wants to focus
on analyzing factors that influence the safety behavior
of shipyard employees. This research aims to develop
a model to identify factors that motivate shipyard
employees’ safety behavior, to identify the social
cognitive variables that are most influential in
motivating safety behavior towards shipyard
employees, and provide recommendations to the
company in improving occupational safety and
health. For the case study, this research is conducted
at PT. DTPS, a ship construction, and reparation
company. PT. DTPS has implemented OHSAS
18001: 2007 safety management and ISO 14001:2015
environmental management system. However, there
are still many employees who currently do not
comply with work occupational health and safety
(OHS) regulations, especially regarding the use of
personal protective equipment (PPE). The field
workers have the potential to experiencing work
accidents related to physical hazards, falls, and
scratches, slipping, or bumping. A condition where
employees are not wearing PPE indicates the lack of
supervision and awareness of employees towards
safety behavior. Unsafe behavior is identified when
employees are operating the machine. The operation
is not performed based on the procedures, which
might lead to work accidents. Moreover, the lack of
communication between employees is also an issue
that occurs in the company. The contribution of this
research is to identify the factors that are most
influential towards the safety behavior of shipyard
employees. As a result, the company is able to take
244
Dewi, D., Zahda, F. and Sudiarno, A.
Shipyard Employees’ Motivation towards Safety Behavior: Factor Analysis with Social Cognitive Theory Approach.
DOI: 10.5220/0009445702440251
In Proceedings of the 1st International Conference on Industrial Technology (ICONIT 2019), pages 244-251
ISBN: 978-989-758-434-3
Copyright
c
2020 by SCITEPRESS – Science and Technology Publications, Lda. All rights reserved

action to increase the safety awareness of the
employees and minimize the level of work accidents.
This research focuses on field employees and
management related to OHS in the company.
2 RESEARCH METHODOLOGY
2.1 Modeling
The first stage of research methodology is modeling.
At this stage, variables are identified, and the model
is conceptualized. The identification of latent
variables is carried out by using the theoretical
framework of SCT (Bandura, 1986, 1997; Compeau,
Higgins and Huff, 1999; Huang and Lin, 2008) and
information from previous studies (Cui et al., 2013;
Guo, Yiu and González, 2016; Hald, 2018). From
previous studies, some latent variables that may
influence the safety behavior of employees are
identified. These include five latent variables, which
are environmental factors (FL), commitment
management (KM), safety-efficacy (SE), employee
involvement (TK), and work safety behavior (PA).
Indicators or variables are able to represent the latent
variables for the model.
The conceptualization of the model is depicted in
the form of a path diagram that shows the causality
relationship between the tested variables. Subsequent
to the path diagram, the hypothesis is then
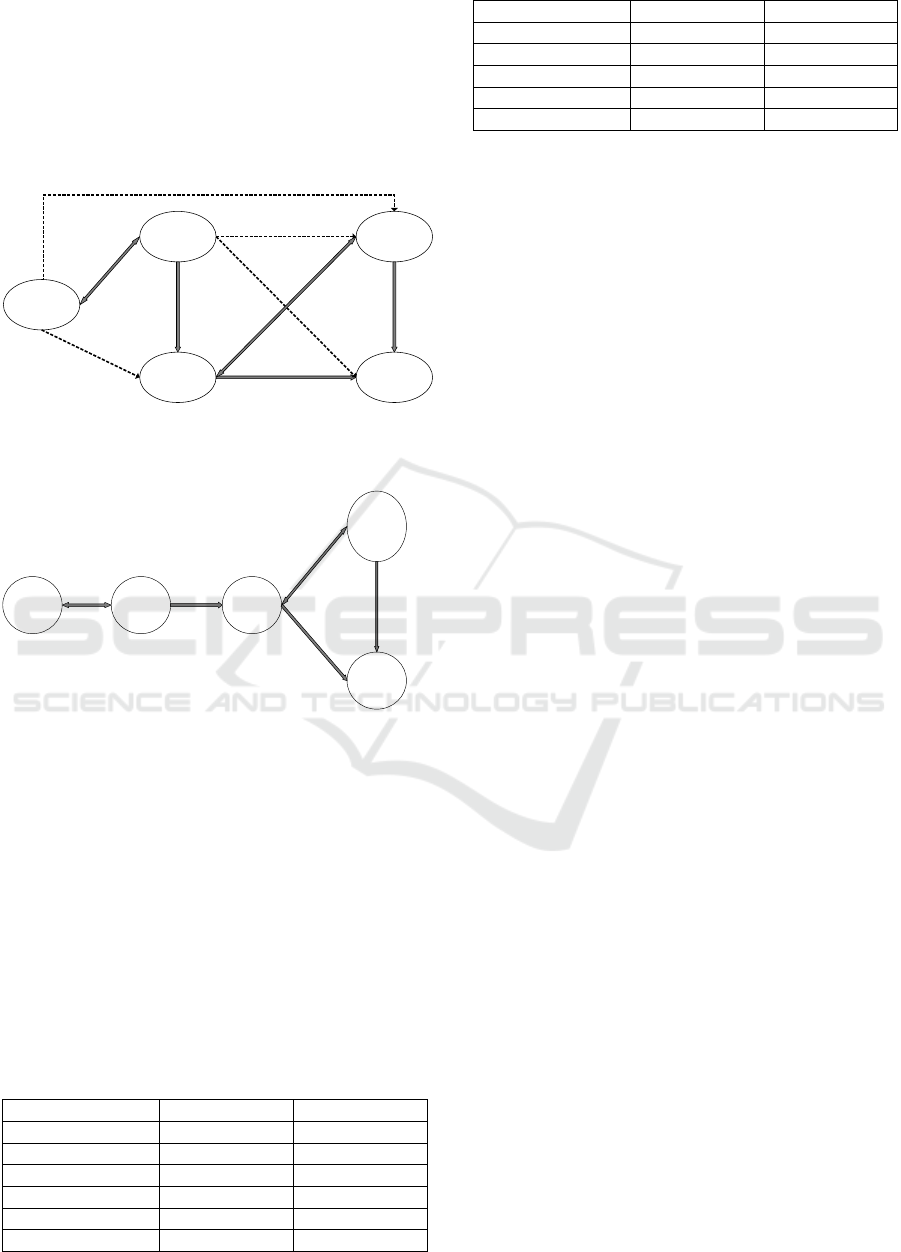
formulated. Figure 1 presents the conceptual model
used in this research.
Figure 1: Conceptual Model.
2.2 Data Collection
The next stage of the research is designing and
distributing questionnaires. The questions are
developed based on the variables and indicators
defined from the previous stage. The questionnaire
uses a Likert scale of 1-7.
Questionnaires are directly distributed to field
employees who are involved in the shipyard
production process. The determination of sample
number is based on the model constructed by (Hair et
al., 2007), which stated that the number of samples
which must be obtained for SEM is 5-10 times the
number of indicators. This research uses 5 variables
and 25 indicators. As a result, the minimum number
of samples that must be obtained is 125 data.
2.3 Statistical Testing
After the data is collected, the following step is to test
the proposed model. At this stage, the structural
equation modeling (SEM) is applied to test the
hypotheses. SEM is a set of statistical techniques that
able to test a series of relationships simultaneously.
The main reason for the use of SEM is because of its
ability to estimate the relationship between multiple
connected variables. SEM allows a more accurate
analysis compared to other methods such as multiple
regression, factor analysis, and covariance analysis
because it could consider interaction modeling,
nonlinearity, correlated independent variables,
measurement error, and correlated error (Byrne,
2010). In addition to that, Linear Structural
Relationship (LISREL) software is used for testing.
This test aims to determine the consistency and
validity of the proposed model. SEM testing uses
several goodnesses of fit criteria. If the model does
not match the data, the model needs to be modified to
obtain a better match.
The first step of SEM is to conduct an initial
measurement test. This test is carried out by using the
confirmatory factor analysis (CFA) method. The
purpose of this test is to identify whether the
indicators used are relevant to the variables. Initial
measurements are performed by running the LISREL
software to ensure that all indicators meet several
sub-criteria such as error variance, t-value,
standardized loading factor (SLF), and standard error.
In this case, several iterations are required to declare
the model as fit. If the indicator does not meet the sub-
criteria, the indicator must be removed, and the next
iteration is performed until the model is fit. After all,
indicators are fit, and a reliability test is performed to
measure the consistency of latent variable indicators.
The greater the value of reliability means that the
indicator has a higher consistency in measuring latent
variables. The validity test is then performed, which
aims to see the level of accuracy achieved by an
indicator in measuring the concept.
The second step is testing the structural model.
This test uses multiple regression analysis, which
assesses whether there is a significant or insignificant
Environment
Factor
Employee
Involvement
Management
Commitment
Safety-
Efficacy
Work Safety
Behavior
H1 (+)
H3 (+)
H6 (+)
H2 (+)
H4 (+)
H5 (+)
H7 (+)
H8 (+)
H9 (+)
H11 (+)
H10 (+)
Shipyard Employees’ Motivation towards Safety Behavior: Factor Analysis with Social Cognitive Theory Approach
245
relationship between variables (independent) with
endogenous variables (dependent).
2.4 Data Analysis and Interpretation
The data analysis and interpretation phase are carried
out by analyzing latent variables that have been
formulated in SEM. Data analysis is in the form of a
relationship from each variable and social factor that
influences the safety behavior of an employee the
most. These factors are motivations for employees in
implementing safety behavior in the workplace.
3 RESULT
3.1 PT DTPS and Respondent Profiles
PT. DTPS is a company involved in the shipping
industry (construction of new ships and ship repairs).
PT. DTPS has a vast experience in constructing new
ships. Until now, the total construction that has been
carried out is 97 ships of various types and sizes. As
for ship repair, the company has cooperated with
government agencies as well as private companies.
PT. DTPS is committed to implementing all the
clauses specified in the ISO 9001: 2008 Quality
Management System standards, OHSAS 18001: 2007
OHS Management System, and ISO 14001: 2004
environmental management system.
In this research, the process of data collection is
carried out by directly distributing questionnaires to
OHS management and field employees. Respondents
who fill out the questionnaire are permanent
employees or contractors of PT. DTPS. The
respondents involved in this study are 173
respondents.
The majority of respondents who participate in
this research are between 31 and 40 years old. The
age of respondents describes the behavior and action
of an employee. The level of education is one of the
factors that influence the level of understanding in
answering questions and performing activities. Based
on the collected and processed data, it showcases that
the majority of respondents involved in this research
are high school graduates. In other words, most of the
respondents have an average level of education.
Moreover, none of the respondents have a degree
below the junior high. The majority of respondents
have positions as permanent or field staff because the
focus of this research is the safety behavior of field
employees in the workplace. Work accident
experience is defined as work-related accidents and
health problems experienced by the employee that
originate from previous work. Experiences are
derived from personal injuries or work accidents, and
experience with the safety and health of employees,
in particular, can be related to behavioral intentions
towards work safety. Zhou and Jiang (2015) stated
that personal experience factors related to safety were
strong predictors in shaping behavior safety. The
majority of respondents involved in this research have
experienced a mild category work accident.
3.2 Data Processing Result
Initial measurements were carried out using LISREL
software and produce output in the form of error
variance, t-value, and Standardized Loading Factor
(SLF) values. The following are the results of the first
iteration of LISREL running software, presented in
Table 1.
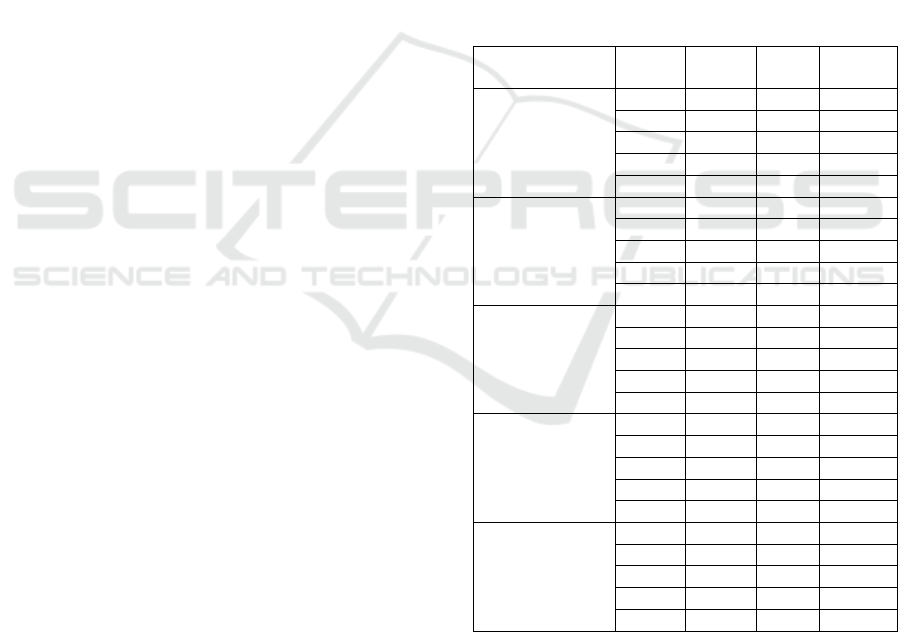
Table 1: The 1st Iteration of CFA Running Result.
Latent Variable
Indica
tor
Error
Var
SLF t-value
Environmental
Factor
FL1 0,066 0,97 17,37
FL2 0,14 0,92 15,82
FL3 0,098 0,95 16,82
FL4 0,097 0,94 16,34
FL5 0,2 0,88 14,6
Commitment
Management
KM1 0,45 0,08 1,01
KM2 0,48 0,59 7,72
KM3 0,38 0,48 6,02
KM4 0,96 -0,57 -7,38
KM5 0,22 -0,66 -8,72
Safety-Efficacy
SE1 0,23 0,82 12,81
SE2 0,23 0,82 12,84
SE3 0,11 0,93 15,49
SE4 0,35 0,53 7,28
SE5 0,37 0,3 3,93
Employee
Involvement in
Safety
TK1 0,28 0,68 9,57
TK2 0,39 0,56 7,47
TK3 0,24 0,8 11,97
TK4 0,57 0,52 6,92
TK5 0,95 0,57 7,6
Work Safety
Behavior
PA1 0,13 0,91 14,9
PA2 0,23 0,75 11,07
PA3 0,72 0,28 3,53
PA4 0,83 0,26 3,3
PA5 0,25 0,8 12,3
The second iteration result of the CFA test after
the six indicators omitted is presented in Table 2.
Based on Table 2, it is known that all indicators have
positive error variance. A measurement model can be
said to be good if it meets several requirements. A
good indicator is if the error variance is positive, the
SLF value ≥ 0.45, and the t-value meets the minimum
ICONIT 2019 - International Conference on Industrial Technology
246
standard ≥ 1.96 (Hair et al., 2007). The result of the t-
value for all indicators in this research has values ≥
1.96, and for SLF, all indicators have values ≥ 0.45.
So, from the second iteration result, it can be said that
the model was valid. The test can proceed to the next
stage.
The goodness of fit test is now performed on
models. The goodness of fit test is performed using
the results of LISREL running software. The
goodness of fit test results can be seen in Table 3.
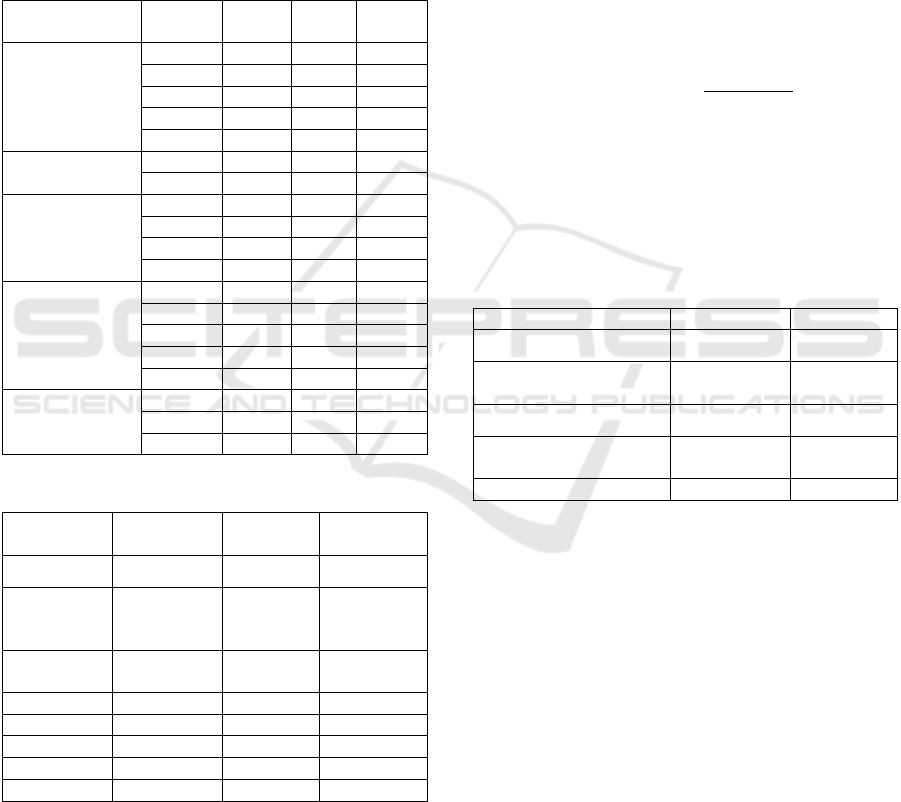
Table 2: The 2nd Iteration of CFA Running Result.
Table 3: Goodness of Fit CFA Model Result.
Sub Criteria
Analysis
Cut Off
Value
Test
Results
Information
RMSEA ≤ 0,08
0,045 Model fit
90%
Conf.Interv.
for RMSEA
Expected to
be small
0,019-
0,021
Model fit
NFI ≥ 0,90
0,82
Model less
fit
NNFI ≥ 0,90 0,92 Model fit
RFI ≥ 0,90 0,97 Model fit
IFI ≥ 0,90 0,97 Model fit
CFI ≥ 0,90 0,97 Model fit
PGFI ≥ 0,60 0,66 Model fit
Test results with LISREL software in Table 3
show that all criteria meet the cut-off value, except
NFI. The NFI in the model is still less than 0.90,
which is 0.82. This can occur because of the
possibility that the small NFI value is caused by the
complexity of the model, so to eliminate the influence
of the complexity of the model, a more appropriate
measure is NNFI. NNFI on the model is fit where the
cut off value has exceeded 0.90. The validity test aims
to see the level of accuracy achieved by an indicator.
An indicator can be said to be good if it has a t-value
≥ of 1.96 and has an SLF value of ≥ 0.45 (Hair et al.,
2007). The result of this research found that all
indicators had met the required criteria so that all
indicators were declared capable of measuring the
dimensions of the variables. The reliability test is a
test to determine the consistency of measurement
indicators of a latent variable. The greater the value
of composite reliability, the better the indicator or has
high consistency in measuring latent variables.
Following is the formula used in the reliability test:
∑
∑
∑
(1)
SLF values obtained from the results of running
LISREL software, while ej is a measurement error on
each indicator. A construct has good reliability if it
has a composite reliability value (CR) ≥ 0.70 (Hair et
al., 2007). The reliability test results can be seen in
Table 4.
Table 4: Reliability Test Result.
Latent Variable CR Information
Environmental Factor 0,97267 Reliable
Commitment
Management
0,86157 Reliable
Safety-Efficacy 0,91306 Reliable
Employee Involvement
in Safety
0,7993 Reliable
Work Safety Behavior 0,90913 Reliable
It was found that the composite reliability (CR)
value of all variables showed ≥ 0.70. This indicates
that the indicators attached to the latent variable
already have the expected reliability.
The second test is a structural model test. Before
starting the structural model test, a goodness of fit test
of the overall model is required. The purpose of the
goodness of fit test is to ensure that the structural
model can accurately explain the direction of the
relationship and influence. If the test value meets the
cut off value of each criterion, then the whole model
considered as fit.
It was found that the test results with LISREL
software showed that all criteria met the cut off value.
After testing the goodness of fit, a structural model
test is performed using the LISREL running software.
The criteria used are the t-value. The t-value is useful
to see the significance between latent variables. The
Variable
Indicato
r
Error
Var
SLF
t-
value
Environmental
Factor
FL1 0,06 0,97 17,47
FL2 0,14 0,92 15,79
FL3 0,095 0,95 16,88
FL4 0,1 0,93 16,25
FL5 0,21 0,87 14,48
Commitment
Management
KM2 0,091 0,93 7,86
KM3 0,3 0,63 6,45
Safety-Efficacy
SE1 0,25 0,81 12,48
SE2 0,22 0,83 13,03
SE3 0,091 0,94 15,67
SE4 0,36 0,53 7,2
Employee
Involvement in
Safety
TK1 0,24 0,73 10,5
TK2 0,4 0,55 6,34
TK3 0,3 0,75 10,82
TK4 0,54 0,55 7,36
TK5 0,98 0,55 7,33
Work Safety
Behavior
PA1 0,11 0,92 15,22
PA2 0,24 0,73 10,81
PA5 0,25 0,8 12,21
Shipyard Employees’ Motivation towards Safety Behavior: Factor Analysis with Social Cognitive Theory Approach
247
following are the t-value results obtained from
running the LISREL software, presented in Figure 2.
Based on Figure 2, it can be seen that from the
eleven research hypotheses, four hypotheses did not
meet the t-value ≥ of 1.96 (error value of 5%).
Therefore, the four hypotheses, which are H2, H3,
H5, and H6, were rejected. So, the path diagram used
after the hypothesis test is as presented in Figure 3.
Figure 2: The t-value Structural Model Result.
Figure 3: Structural Model after Testing.
Then the composition of the influence of each
variable is determined. The composition of the effects
of each variable is used to determine which latent
variables are most influential in the model. The total
effect is the sum of the direct and indirect effects
obtained from the LISREL software output. The
following are the results of the composition of the
effects of each variable that can be seen in Table 5.
It was found that employee involvement in safety
(TK) had the greatest total effect on all variables. This
indicates that employee involvement has the most
influence in producing work safety behavior in the
workplace.
Table 5: Influence Composition of Each Variable.
Hypothesis Path Total Effect
H1 FL-KM 0,34
H2 FL-SE -0,04
H3 FL-TK -0,53
H4 KM-SE 0,1
H5 KM-TK -0,2
H6 KM-PA -0,21
Hypothesis Path Total Effect
H7 SE-TK 0,26
H8 SE-PA 0,48
H9 TK-PA 0,7
H10 KM-FL 0,35
H11 TK-SE 0,65
4 DISCUSSION
4.1 Hypothesis Analysis
H1 states that environmental factors (FL) have a
positive influence on commitment management
(KM). After structural test models, the results of H1
is accepted. This shows that the hazardous
environment encourages management to carry out
and make a policy, procedure, and safety practice,
which the management seeks to continue in reducing
the dangerous environment that occurs in the
company. This finding supports the argument of
Nielsen et al. (2006) that commitment management in
work safety is usually considered the most important
dimension of the safety climate. Organizational
support and supervision are needed because
employees' perceptions about commitment
management to safety can be related to safety-related
behavior. Commitment management that has been
made by PT. DTPS for work safety is OHSAS
18001:2007 standardization. The standardization is a
regulation regarding the obligation to use PPE in the
field, the existence of periodic inspections by
supervision, the existence of education and training
programs on OHS, and so on. However, PT. DTPS
has not implemented a penalty program or
punishment for employees who do not follow the
procedures and regulations regarding OHS.
H2 and H3 stated that environmental factors (FL)
have a positive effect on safety-efficacy (SE) and
employee involvement on safety (TK). After
structural model testing, it was found that H2 and H3
were rejected. The test results indicate that
environmental factors do not have a positive effect on
self-efficacy and employee involvement. This is in
accordance with the results of previous studies
conducted by Cui et al. (2013). Several possibilities
cause environmental factors does not have a positive
influence on self-efficacy and employee
involvement; for example, employees continue to feel
confident even though working in a dangerous work
environment.
H4 shows that commitment management (KM)
has a positive effect on safety-efficacy (SE).
Management's commitment to safety is a major factor
Environment
Factor
Employee
Involvement
Management
Commitment
Safety-
Efficacy
Work Safety
Behavior
H1: 4,28
H3: -4,12
H6: -0,67
H2: -4,37
H4: 4,03
H5: -1,87
H7: 3,06
H8: 4,54
H9: 7,87
H10: 3,33
H11: 2,96
Environment
Factor
Employee
Involvement
Management
Commitment
Safety-
Efficacy
Work Safety
Behaviour
H1: 4,28 H4: 4,03
H7: 3,06
H8: 4,54
H9: 7,87
H10: 3,33
H11: 2,96
ICONIT 2019 - International Conference on Industrial Technology
248

influencing the success of an organization's safety
program. This indicates that commitment
management influences on the internal aspects of
individual attitudes and beliefs about safety. It is
noteworthy that no direct relationship was found
between hazardous environments and safety-efficacy.
Instead, the results show that the relationship between
the two is mediated by management's commitment to
safety. This shows that the disconnect between the
environment that is considered dangerous and the
internal beliefs of employees in shaping the safety
climate can be caused by deficiencies in the role of
leaders and authority in handling safety potential.
Although employees are required to follow safety
procedures and are given channels to communicate
with their managers regarding safety issues, the
manager is less responsive and passive to safety
threats when observing the lack of commitment from
supervision, especially senior company managers.
Given that field employees have limitations in safety
measures, it is unlikely that they can respond
individually towards the hazardous environment and
handle the case immediately.
H5 and H6 state that commitment management
(KM) has a positive influence on employee
involvement in safety (TK) and work safety behavior
(PA). After structural model testing, it was found that
H5 and H6 were rejected. The test results indicate that
commitment management does not have a positive
effect on involvement and work safety behavior. This
is following the research of Cheyne et al. (2002),
which stated that a person's attitude or behavior tends
to be obtained through observations from others and
then duplicate it. Several possibilities cause
commitment management do not have a positive
influence on employee involvement in workplace
safety behavior. For example, management is less
committed to implementing OHS programs that make
employees underestimate the importance of safety for
themselves and others.
H7 shows that safety-efficacy (SE) has a positive
effect on employee involvement in safety (TK), while
H11 shows that employee involvement (TK) has a
positive effect on safety-efficacy (SE). Employees'
perceptions of safety affect work safety behavior.
Safety-efficacy and employee involvement are one
unity because both are individual cognitive behaviors.
SCT (Bandura, 1986) asserted that an individual
acquires behavior through observations from others,
then mimics what they have observed, which shows
that people's behavior is influenced by their cognitive
processes. Employee involvement, in this case, is to
show the relationship of employees related to safety
and their acceptance of personal responsibility for
achieving safety, such as helping colleagues in
dangerous conditions. Thus, it can be seen as the
extent to which the role of self-efficacy is reflected in
safety behavior. It is noteworthy that no direct
relationship was found between management
commitment and employee involvement in safety. On
the contrary, the results show that the relationship
between the two is mediated by safety-efficacy.
These results provide empirical evidence about the
role of employee self-efficacy in safety management.
This is in line with the argument of SCT Bandura
(1986). The findings show that self-efficacy is not
directly affected by management aspects but rather is
controlled by their beliefs and observations of others
that lead them to take similar actions. An individual's
behavior will affect the behavior of other individuals.
This finding is in line with the statement of Cui et al.
(2013) that the normative aspects of an organization,
through the influence of management attitudes,
determined the behavior and expected the
involvement of its employees. If organizational
norms are affected by a low managerial commitment
to safety, employees will also exhibit negative safety
attitudes and accept risks related to the work received.
This hypothesis is also similar to previous studies
conducted by Guo, Yiu, and González (2016), where
the results of the research showed that SE has a
positive influence on employee involvement in
safety.
H8 and H9 show that safety-efficacy (SE) and
employee involvement in safety (TK) have a positive
effect on work safety behavior (PA) in the workplace.
After structural test models have been obtained, the
results that hypotheses 8 and 9 are accepted. This
indicates that employee confidence and involvement
has a positive influence on the occurrence of work
safety behavior.
H10 states that commitment management (KM)
has a positive influence on environmental factors
(FL). After the structural model tested, it was found
that H10 was accepted. This shows that commitment
management encourages or seeks to reduce the
presence of hazardous environments in the workplace
by establishing policies, procedures, and other
regulations. The higher the level of management's
safety commitment, the lower the level of perceived
production pressure. The commitment to safety
management has an indirect influence on safety
behavior (participation and safety compliance).
Social support from management to employees is
very important to do.
Shipyard Employees’ Motivation towards Safety Behavior: Factor Analysis with Social Cognitive Theory Approach
249

4.2 Recommendations
This research uses an integrated model and underlines
psychological perspectives in safety management that
focus on the cognitive processes of an employee. This
perspective enables the management and company to
comprehend the understanding of human error and
the sociological environment as the cause of accidents
in the workplace. The causal chain from a
psychological point of view begins with the
employee’s perception of a dangerous environment,
which is an initial trigger for potential accidents. This
is the cognitive process of an individual, which
includes the external safety climate perception and
the formation of an individual's trust (internal) in
shaping behavior safety.
The first variable is the hazardous environmental
factors. The most dominant indicator in this variable
is the presence of safety threats related to lighting
levels. A proper lighting level can be increased by
providing an additional flashlight on the employee's
helmet.
In the commitment management variable, the
most dominant indicator in this variable is the
management does not allow shortcuts when a threat
occurs. Management's commitment has been
demonstrated by the company through PPE
regulations. But, in practice, there are employees who
still do not wear PPE. The management, therefore,
must consistently show leadership in safety.
Continuous and consistent efforts must be made to
ensure safety becomes the priority.
Punishment and reward systems are options to be
applied, which aims to improve the discipline of
employees. An example of this system is by creating
a violation control sheet of PPE usage and procedures
in the work area. OHS supervisor and management
are required to fill out forms/control sheets that
contain any violations committed by employees. The
results of the violation will be announced in front of
all the employees per each department. Safety talk is
a meeting that is routinely held between supervision
and employees to discuss issues regarding OHS. The
purpose of this program is to inform the risks of this
particular job and how to anticipate any unexpected
incidents. Safety talk is recommended to be held
regularly at least once a month in the morning before
work starts The delivery of safety talk does not
require much time, which is enough to last between
5-15 minutes with a concise and clear message.
Topics covered in this program are related to
hazardous conditions during work, types of work
accidents or near misses that often happen, work
guidelines related to work, types of PPE that should
be used, and the latest issues or information about
OHS.
In the safety-efficacy and employee involvement
variables, recommendations that can be given are by
conducting morning briefing, delivering periodic
aspiration, and displaying posters related to work
injuries. Morning briefings are face-to-face
communications that unite leaders with their staff.
This program is carried out every day in the morning
with a duration of around 5-10 minutes. Morning
briefings are conducted in each department and led by
each head of department and employees. The
company is suggested to apply the rules of leadership
where each employee will take turns speaking in the
morning briefing. This aims to increase the
involvement of employees and encourage leadership
in every employee. In briefings, leaders provide the
latest information, advise employees to be more
careful and comply with the existing regulations. The
leaders should also discuss OHS implementation in
the company, work procedures, conditions of work
equipment as well as punishment and reward.
Delivering regular aspirations or feedback provides
employees with various information, which results in
two-way communication between the leader and
employees. This aspiration program is carried out by
providing suggestion boxes for employees and
requiring them to fill in the boxes at least once a
month. This suggestion box is placed near the
entrance gate of PT. DTPS. Contents within the
suggestion or feedback box shall be in the form of
complaints, recommendations, and findings
regarding the violations committed by colleagues.
The purpose of the suggestion box is to improve the
communication and aspirations of all employees.
Other than that, the suggestion box is also able to
represent employees who are timid and keep their
suggestions anonymous.
Designing a poster related to work injuries will
give information on how to prevent accidents. The
poster designs refer to minor, moderate, and severe
injuries, such as fracture, finger cuts, and other
injuries. These posters will be posted on each
production process walls. The purpose of this poster
is to increase the awareness of employees about
injuries that may occur. Employees are expected to be
more attentive and aware in order to avoid similar
injuries shown in the poster.
5 CONCLUSION
The conclusions that can be obtained from this
research are as follows:
ICONIT 2019 - International Conference on Industrial Technology
250

1. Based on the social cognitive theory
approach from Bandura (1986), factors that motivate
shipyard employees of PT. DTPS consists of five
variables, which are environmental factors (FL),
commitment management (KM), safety-efficacy
(SE), employee involvement in safety (TK), and work
safety behavior (PA). Those five variables are used to
analyze how variables can affect the safety behavior
of employees.
2. The eleven research hypothesis is defined
and tested. Based on the hypothesis test, there are four
hypotheses that are rejected.
3. Employee involvement is the most
influential factor that motivates employees towards
safety behavior. This is in line with social cognitive
theory (SCT), where people tend to mimics other
people's behavior. Besides employee involvement,
another factor that has significant influence is self-
efficacy.
4. Some recommendations are proposed for
PT. DTPS Shipyards Surabaya to increase employee
motivation towards safety. These include
implementing good punishment and praising
programs, organizing open talks about safety
awareness, and implementation of the OHS
management system. Moreover, providing a
flashlight or additional lighting on the employee's
helmet, aspiration delivery programs, daily morning
briefings, and designing posters related to safety are
other options of solutions to change employee safety
behavior.
REFERENCES
Bandura, A. (1986) Social Foundations of Thought and
Action: A Social Cognitive Theory. New Jersey:
Prentice-Hall.
Bandura, A. (1997) Self-efficacy: The Exercise of Control.
New York: Freeman.
Byrne, B. M. (2010) Structural equation modeling with
AMOS: Basic concepts, applications, and
programming, 2nd ed., Structural equation modeling
with AMOS: Basic concepts, applications, and
programming, 2nd ed. New York, NY, US:
Routledge/Taylor & Francis Group (Multivariate
applications series.).
Cheyne, A. et al. (2002) The Architecture of Employee
Attitudes to Safety in the Manufacturing Sector.
Compeau, D., Higgins, C. A. and Huff, S. (1999) ‘Social
Cognitive Theory and Individual Reactions to
Computing Technology: A Longitudinal Study’, MIS
Quarterly, 23(2), pp. 145–158.
Cui, L. et al. (2013) ‘An integrative model of organizational
safety behavior’, Journal of Safety Research.
Pergamon, 45, pp. 37–46. doi:
10.1016/J.JSR.2013.01.001.
Guo, B. H. W., Yiu, T. W. and González, V. A. (2016)
‘Predicting safety behavior in the construction industry:
Development and test of an integrative model’, Safety
Science. Elsevier, 84, pp. 1–11. doi:
10.1016/J.SSCI.2015.11.020.
Hair, J. F. et al. (2007) Multivariate Data Analysis. 6th edn.
New Jersey: Pearson Education Inc.
Hald, K. S. (2018) ‘Social influence and safe behavior in
manufacturing’, Safety Science. Elsevier, 109, pp. 1–
11. doi: 10.1016/J.SSCI.2018.05.008.
Huang, C. C. and Lin, T. C. (2008) ‘Understanding
knowledge management system usage antecedents: An
integration of social cognitive theory and task
technology fit.’, Inf. Manage., 46(6), pp. 410–417.
Nielsen, K. J. et al. (2006) ‘Changes in Safety Climate and
Accidents at Two Indetical Manufacturing Plants’,
Safety Science, 46(3), pp. 440–449.
Zhou, F. and Jiang, C. (2015) ‘Leader-member Exchange
and Employees’ Safety Behavior: The Moderating
Effect of Safety Climate’, Procedia Manufacturing.
Elsevier, 3, pp. 5014–5021. doi:
10.1016/J.PROMFG.2015.07.671.
Shipyard Employees’ Motivation towards Safety Behavior: Factor Analysis with Social Cognitive Theory Approach
251
