
Analysis of Voltage and Electric Current in a Web-based Solar Power
Plant
Riza Hadi Saputra, A. M. Miftahul Huda, Ain Sahara, Yohanes Robinson Deky Rohie
Sekolah Tinggi Teknologi Minyak dan Gas Bumi, East Borneo, Indonesia
Keywords: Solar Power Plant, Arduino Uno, Voltage, Current, GSM SIM800L
Abstract: Solar Power Plant utilizes solar energy into electricity. Important data generated from electrical energy can
be in the form of voltage and current where measurements are made by a multimeter in which its measurement
results cannot be done remotely and stored automatically. Therefore, it is necessary to design a tool that can
measure voltage and current from electrical energy over long distances in which its value can be automatically
stored in a database and displayed on the website. This system is built from GSM SIM800L as a data sender,
Arduino Uno as a data processor, Voltage Sensor as a voltage sensor, and ACS712-30A as a current sensor.
If the manual measurement is used as a reference, the level of accuracy of measurements on currents is 30%;
while, if the automatic measurement as a reference is used, it is 45%. In addition, if the manual measurement
is used as a reference in voltage measurements, the level of accuracy is 2%; while, if the automatic
measurement is used as a reference, it is 2%. Which is the lower the level of accuracy, the better the value;
on the contrary, the greater the level of accuracy, the worse the value?
1 INTRODUCTION
Solar Power Plant utilizes solar energy into electricity
where this type of power plant will never run out; it is
a power plant in which its main component is sunlight
that can always be renewable (Reatti, Kazimierczuk,
Catelani, & Ciani, 2017). In addition to solar power
as the main component, of course, there are several
other components used to support the conversion of
solar energy into electrical energy. Some components
commonly used include solar panels to capture solar
energy and convert it to electrical energy, the battery
as a storage place for electrical energy generated, the
inverter is used to convert current from DC to AC,
and several supporting cables for the installation of
the Solar Power Plant components so that it can work
well (Gurung et al., 2017).
When solar energy is converted to electrical
energy, we can measure the electrical energy obtained
through a multimeter (Unger et al., 2014). Usually,
the main thing that is measured in electrical energy is
the voltage and current generated. Because the
electrical energy produced will run continuously to
get data through the values that have been recorded
from observations of the power plant. Important data
that can be obtained include the amount of voltage
obtained and the current entering the battery or
battery (Mehne & Nowak, 2018).
From this background, a device that can display
data of voltage and current is made, the
communication of which data can be done wirelessly,
because so far the voltage and current measurements
made using a multimeter are limited to the length of
the multimeter cable that makes the measurements
must be made on the area to be measured (Adhya,
Saha, Das, Jana, & Saha, 2016). One of the options to
replace it is using GPRS as its data communication.
The advantage of the GPRS signal is its long-range
distance with a note that as long as there is a GPRS
signal in the area, then the data communication can
still be done and can run well. Therefore, GPRS
signals are used as data communication for devices
that will be built using Arduino Uno. Arduino Uno
functions to measure and retrieve data from electrical
energy obtained from solar power plants, and the
existing data is then sent by GSM SIM800L and will
be automatically stored in an already available
database. Furthermore, data that has been stored in a
database can be displayed on the website, and the data
can be seen at any time via the internet (Desima,
Ramli, Ramdani, & Rahman, 2018).
Saputra, R., Huda, A., Sahara, A. and Rohie, Y.
Analysis of Voltage and Electric Current in a Web-based Solar Power Plant.
DOI: 10.5220/0009444601910199
In Proceedings of the 1st International Conference on Industrial Technology (ICONIT 2019), pages 191-199
ISBN: 978-989-758-434-3
Copyright
c
2020 by SCITEPRESS – Science and Technology Publications, Lda. All rights reserved
191
2 METHODOLOGY
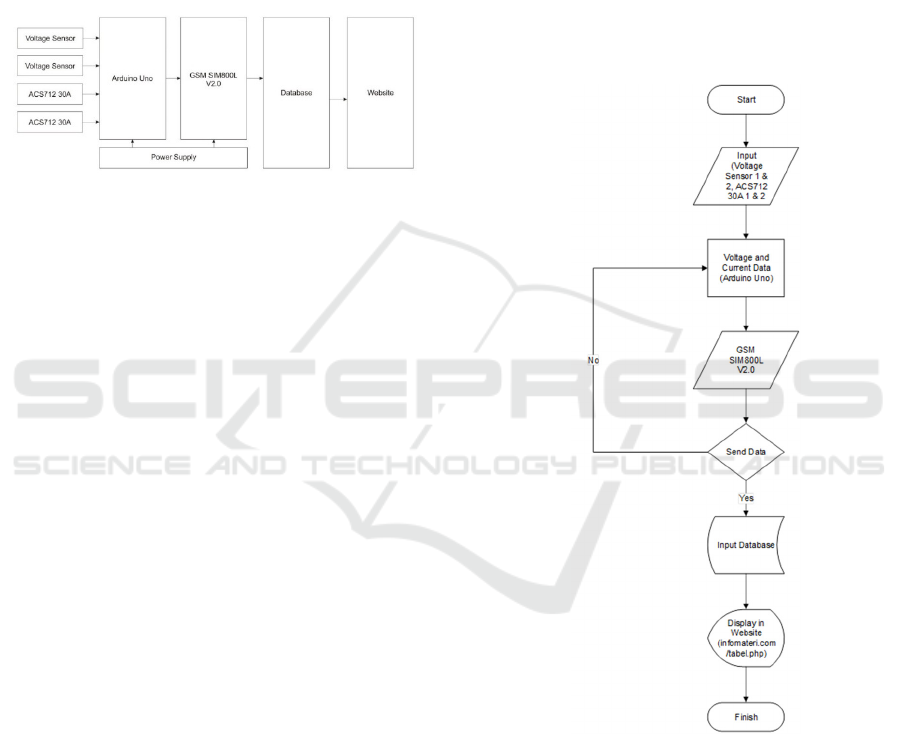
A series of block diagrams is one of the most
important parts of the design of an instrument. From
the block diagram, it can be seen the working
principle of the whole circuit. So that the whole series
of block diagrams will produce a system that can
function as the working principle of the design of an
instrument. The block diagram design can be seen in
Figure 1.
Figure 1: Block Diagram
a. Arduino Uno
Used for the calculation process and pin-
gathering place of the sensor, which will then
be inserted a script that will be able to calculate
the desired output value.
b. GSM SIM800L V2.0
As a tool used to send data to databases on the
internet.
c. Voltage Sensor
As a tool used to obtain the value of the voltage
of an electronic device that is powered by
electricity.
d. ACS712-30A
As a tool used to get the current value of a load.
e. Resistor
It is an electronic component that has two pins
and is designed to regulate electrical voltage
and electric current. The resistor in the device
to be built is used as a voltage divider that
serves to reduce the voltage from the voltage
source to be measured.
f. Breadboard/PCB
Used to install components and connect
electronic components with other electronic
components.
g. Power Supply
To convert AC into DC which is then converted
into power or energy needed by the
components
h. Cable
Used to connect electronic components
through pins on components.
i. Antenna
An electrical device that can convert an
electrical signal into electromagnetic waves
and then emit it into free space or vice versa,
namely capture electromagnetic waves from
free space and convert it into electrical signals.
j. Laptop
Used to add, delete, and edit program
languages that are used to send program
languages to Arduino devices.
k. USB Cable
As a connecting device between Arduino and
laptops.
Figure 2 shows a flowchart of research that has
been done.
Figure 2: Research Flowchart
It is designing a device that can send the results of
voltage and current measurements using a voltage
sensor and an ACS712-30A sensor where the voltage
and current values are sent to the database and
displayed on the website. The data that has been
obtained will be sent via GSM SIM800L V2.0
(Septiana, 2018). Sending the value obtained to the
database uses the GPRS network that has been set on
Arduino Uno will make the values occur continuously
to the database. On the website page, there are several
ICONIT 2019 - International Conference on Industrial Technology
192
columns namely the voltage column, the current
column, the voltage usage column, the time column
and the date column; where the last two columns are
automatically created when the value is stored in the
database(Moghimi, Bennett, Leskarac, Stegen, & Lu,
2016).
3 RESULT AND DISCUSSION
3.1 Instrument Design Result
The design of this tool uses a Voltage Sensor and
ACS712-30A to get the measured voltage and current
value, and the main component for data
communication is the GSM SIM800L V2.0 module,
which will be set to send the measurement results to
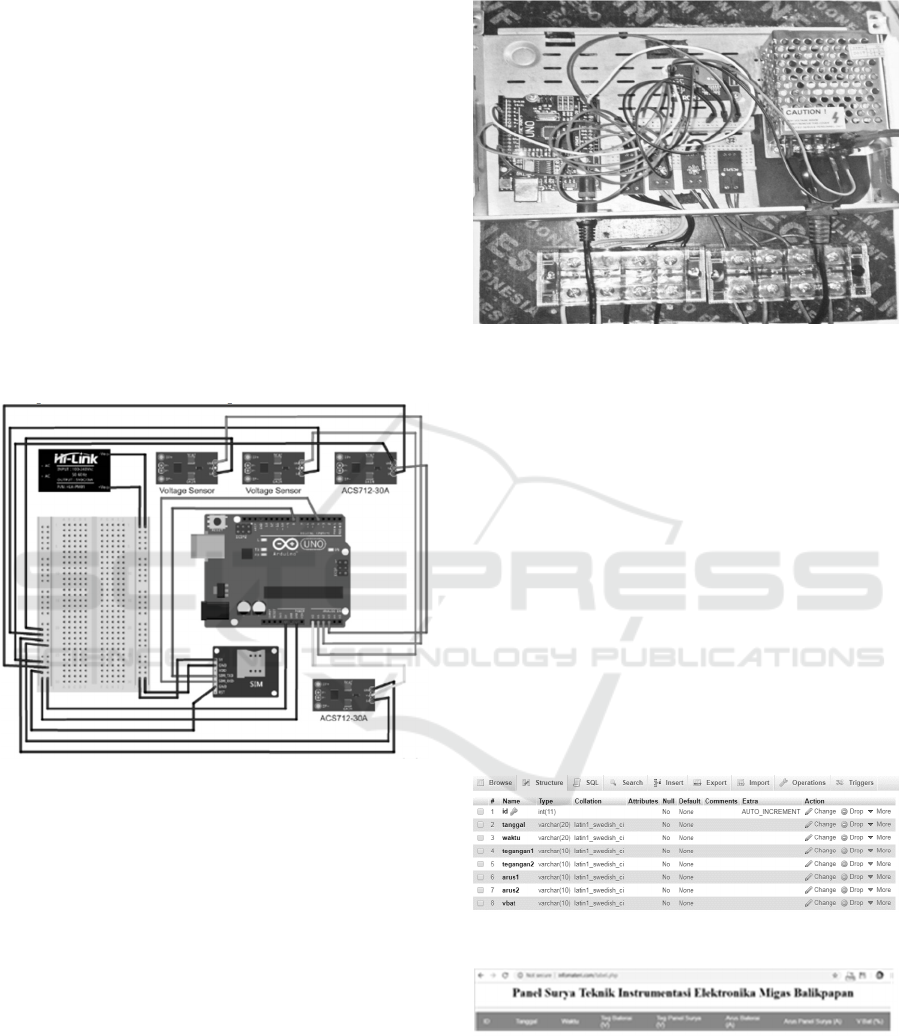
the database (Turahyo, 2017). Figure 3 shows the
design of a wireless data acquisition instrument.
Figure 3: Design of a Wireless Data Acquisition Instrument
Figure 3 shows a power supply with a 5VDC
voltage and 3A current to run the GSM SIM800L
V2.0 module. On the voltage sensor, there are three
pins, namely signal pins (S), plus pins (+) and minus
pins (-). At the end of the voltage sensor, there are two
wires to connect to the voltage source, which was
measured. For the current sensor, ACS712-30A uses
three pins on ACS712-30A, namely VCC pin, OUT
pin and GND pin. At the other end, there are two
wires connected to the load to measure the current.
The voltage sensor and ACS712-30A are assembled
on a breadboard that has been installed on the chassis.
Figure 4 shows an instrument that has been
created from the results of the design. Almost all pins
of the component are connected to Arduino Uno.
Arduino Uno sends the processed data through pin
four, which is received by GSM SIM800L V2.0. The
data that has been processed is sent to the database by
GSM SIM 800L V2.0 through the GPRS network.
Figure 4: Instrument created from the research design
3.2 Results of Design in Database and
Website
After the tool has been completed, as seen in Figure
4, the next step is to set the website to be used in this
study. The first step is to open a browser on a laptop
and then enter the database by filling in an existing
username and password (Abidin, Jusoh, James, Al
Junid, & Mohd Yassin, 2015). Select the database,
then select the table that has been saved in the
database. Figure 5 shows the names of the columns
made in the table named table tb_tes in the database.
In addition to the columns in the database, there is
also a list of columns on the website that has been
created and have been uploaded at
http://infomateri.com/tabel.php, as shown in Figure
6.
Figure 5: Names of columns in the database
Figure 6: Column that has been made
After the database and tables on the website have
been completed, the next step is to send the created
program to Arduino Uno. Figure 7 shows the Arduino
Uno source code that has been created to connect the
Arduino Uno with the database.
Analysis of Voltage and Electric Current in a Web-based Solar Power Plant
193
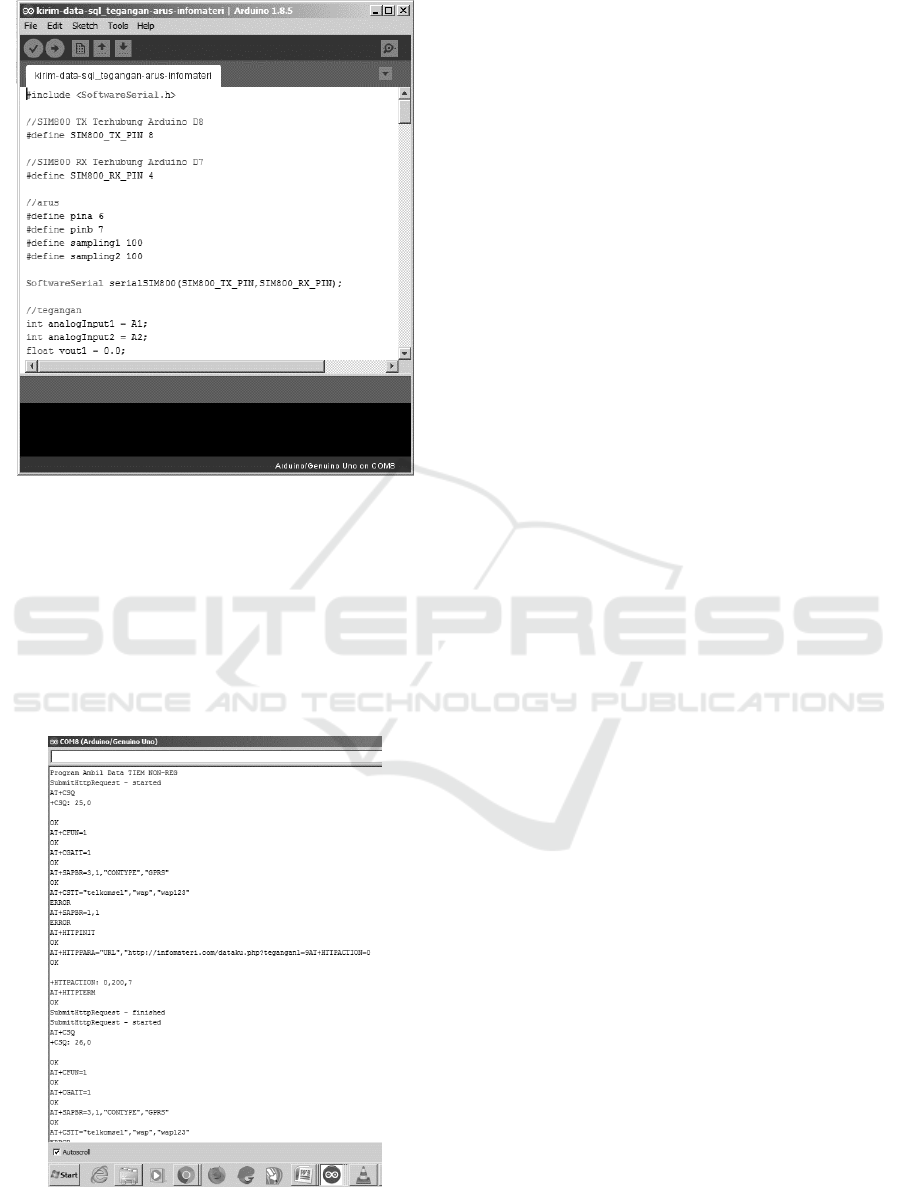
Figure 7: Source Code for Arduino Uno Connection to
Database
When the program has been successfully sent to
Arduino Uno, we can monitor the results of programs
that have been made through the Serial Monitor in the
Arduino IDE application. Besides, this application
can also see the course of programs that we have
made. Figure 8 shows the Serial Monitor results of a
successful connection between Arduino Uno and the
database.
Figure 8: Results of the Connection between Arduino Uno
and the Database
The following is a detailed explanation of the
source code in Figure 8.
a. TIEM NON-REG Data Download Program
The title when the program is first to run
b. Submit HTTP request - started
Program markers can run
c. AT+CSQ
Check the signal quality of the provider of the
SIM Card used
d. AT+CFUN=1
Prepare the function of the module, which has
value 1, where value 1 means “full
functionality," and the power taken is the
highest level.
e. AT+CGATT=1
The command is used to attach or disconnect
the device to the domain package service,
where command 1 is to activate the attachment.
f. AT+SAPBR=3,1,“CONTYPE”,“GPRS”
As a bearer regulator for IP-based applications,
where number 3 is the bearer parameter setting,
and number 1 is the identification of the
bearer’s profile. “CONTYPE” means a type of
internet connection, and “GPRS” means the
type of connection used.
g. AT+CSTT=“Telkomsel”,“wap”,“wap123”
To start setting APN, username, and password
on the SIM Card that is used. Since the service
used is Telkomsel, then the APN, username and
password settings follow Telkomsel settings
h. AT+SAPBR=1,1
Bearer settings, where the first 1 value to open
the bearer and the second 1 value to connect the
bearer.
i. AT+HTTPINIT
To initialize or activate the HTTP service, this
command must be used first before using the
HTTP service
j. AT+HTTPPARA=“URL”,“http://infomateri.c
om/dataku.php?tegangan”.
Set HTTP parameters and to regulate sending
data to the URL address on the website
k. AT+HTTPACTION=0
Delivering HTTP parameters that have been set
up, where the value 0 gives a command with
the POST Method, which means sending data
or values directly to the action to be contained,
without displaying the URL.
l. AT+HTTPTERM
Terminate the HTTP service
When the program successfully runs and sends
data, the table in the database will enter the data sent
ICONIT 2019 - International Conference on Industrial Technology
194
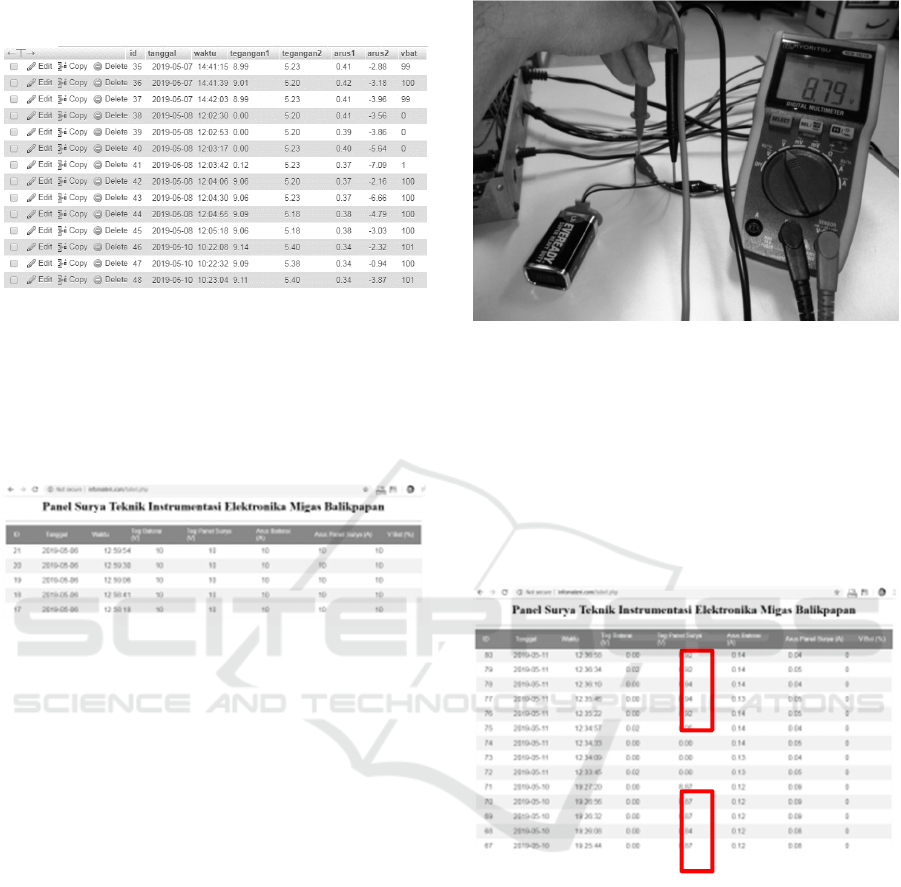
from GSM SIM800L V2.0. Figure 9 shows data that
has been successfully sent and stored in a database.
Figure 9: Data has been successfully sent to the database
When the data has been inputted to the database,
the data on the website will be automatically updated.
The data stored on the website can be seen at
http://infomateri.com/tabel.php. Figure 10 shows the
display of data on the website.
Figure 10: Data display on the website
In Figure 10, the incoming data is in the form of
Teg 1 (V) for voltage measurement 1, Teg 2 (V) for
voltage measurement 2, Current 1 (A) for current
measurement 1, Current 2 (A) for current
measurement 2 and V Bat (%)for the percentage of
battery conditions.
3.3 Measurement Tests on 9VDC
Batteries
This test was done to compare the value displayed on
the website with the value measured using a
multimeter. This started with a 9VDC battery as a
trial sample. The battery used is connected to a
voltage sensor. The first thing to do is to measure the
voltage value on the battery using a multimeter with
the voltage measurement result obtained is 8.79VDC.
Figure 11 shows the 9VDC Battery Voltage
Measurement.
Figure 11: 9VDC Battery Voltage Measurement
After the measurement using a multimeter, the
next step is to measure through a device that has been
made. The trick is to connect the battery to the voltage
sensor to calculate the voltage obtained. After all the
tools are installed, it needs to wait for 1 minute, and
the measurement results can be seen on the website
on http://infomateri.com/tabel.php. Figure 12 shows
a 9VDC battery data display.
Figure 12: 9VDC Battery Data Display
3.4 Voltage Divider
Because the voltage obtained from the solar panel is
in the range of 28-40 VDC and the voltage sensor can
only measure a maximum of 25 VDC, a voltage
divider is made using a resistor to avoid the value
entered into the voltage sensor exceeding 25 VDC. A
voltage divider is a simple circuit that converts large
voltages into smaller voltages. It functions to divide
the input voltage into one or several output voltages
needed by other components in the circuit. Using two
or more resistors and input voltage, a simple voltage
divider circuit can be made. Figure 13 shows an
example of a voltage divider that has been made.
Analysis of Voltage and Electric Current in a Web-based Solar Power Plant
195
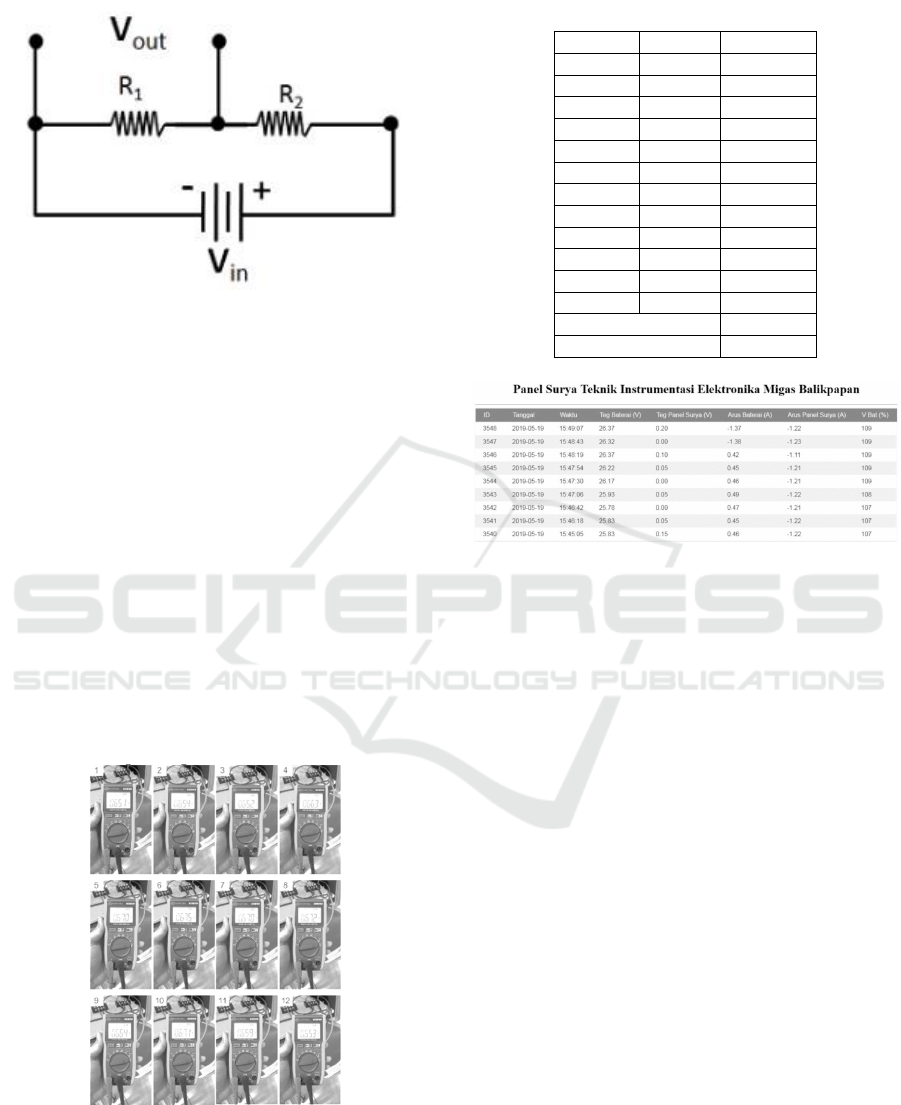
Figure 13: Voltage Divider
3.5 Deviation
In statistics and probabilities, the standard deviation
is the most common measure of statistical
distribution. In short, this method measures the values
of scattered data so that the values that have been
scattered can be seen whether close to the original or
not. In this study, the standard deviation is used to see
whether the values on the website are similar to those
on the multimeter.
3.5.1 Battery Current without Solar Power
Plant
Figure 14 shows the acquisition of battery current
data without solar panels taken 12 times. Meanwhile,
Figure 15 shows the display of battery current data
without a solar power plant on the website.
Figure 14: Battery Current Data Acquisition without Solar
power plant
Table 1: Standard Deviation of Battery Current Data
without Solar Panels
Sample Seconds Value (A)
1 0 0.651
2 2 0.654
3 4 0.652
4 6 0.663
5 8 0.670
6 10 0.675
7 12 0.670
8 14 0.672
9 16 0.664
10 18 0.671
11 20 0.659
12 22 0.653
Average 0.663
Standard Deviation 0.009
Figure 15: Data Display of Battery Current without Solar
power plant
It can be seen in Figures 14 and 15 that the
difference from the average value and the results on
the website is 0.19 A, and the deviation distance is
plus or minus 0.009 from the average value that can
be seen in Table 1. Therefore, the results of
comparison with multimeters towards the
measurements which are displayed on the web page
are not within the standard deviation range.
3.5.2 Battery Current with Solar Power
Plant
Figure 16 shows the acquisition of battery current
data with solar panels taken 12 times. Meanwhile,
Figure 17 shows the display of battery current data
with the solar power plant on the website.
ICONIT 2019 - International Conference on Industrial Technology
196
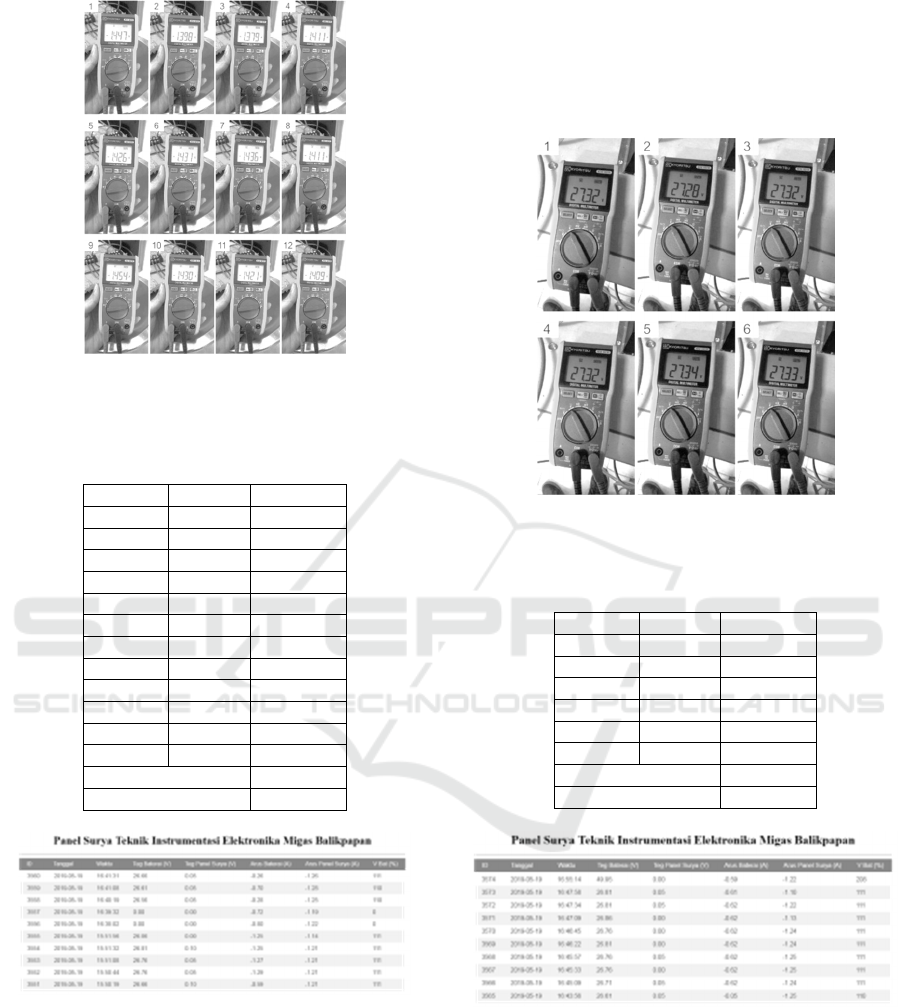
Figure 16: Battery Current Data Acquisition with Solar
power plant
Table 2: Standard Deviation of Battery Current Data with
Solar Panels
Sample Seconds Value (A)
1 0 -1.447
2 2 -1.398
3 4 -1.379
4 6 -1.411
5 8 -1.426
6 10 -1.431
7 12 -1.436
8 14 -1.411
9 16 -1.454
10 18 -1.430
11 20 -1.421
12 22 -1.409
Average -1.421
Standard Deviation 0.021
Figure 17: Data Displays of Battery Current with Solar
power plant
Figures 16 and 17 show that the difference from
the average value and the results on the website is
0.17 A, and the deviation distance is plus or minus
0.021 from the average value that can be seen in Table
2. Therefore, the results of comparison with
multimeters towards measurements which is
displayed on the web page are not within the standard
deviation range.
3.5.3 Battery Voltage with Solar power
plant
Figure 18 shows the battery voltage data taken six
times, while Figure 19 is a display of battery voltage
data that is on the website.
Figure 18: Battery Voltage Data Acquisition with Solar
power plant
Table 3: Standard Deviation of Battery Voltage Data with
Solar Panels
Sample Seconds Value (A)
1 0 27.32
2 5 27.28
3 10 27.32
4 15 27.32
5 20 27.34
6 25 27.33
Average 27.32
Standard Deviation 0.02
Figure 19: Display Data Battery Voltage with Solar power
plant
It can be seen in Figure 18 and 17 that the
difference from the average value and the results on
the website is 0.56VDC, while the standard deviation
distance is plus or minus 0.02 from the average value
that can be seen in Table 2. Therefore, the results of
comparison with multimeters towards the
Analysis of Voltage and Electric Current in a Web-based Solar Power Plant
197

measurements which is displayed on the web page are
not within the deviation range.
4 ANALYSIS
Comparison of data obtained on battery currents
without solar panels, battery currents with solar
panels and voltage on the battery against the
multimeter has not shown the appropriate result, and
there is a significant difference in value, where the
constraints that occur due to the elaboration and
definition of the programming language made are
incorrect. Therefore, there are still differences in the
value produced.
If the manual measurement is used as a reference,
the level of accuracy of measurements on currents is
30%; while, if the automatic measurement is used as
a reference, it is 45%. In voltage measurements, if the
manual measurement is used as a reference, the level
of accuracy is 2%; while, if the automatic
measurement is used as a reference, it is 2%. In this
case, the lower the level of accuracy, the better the
value, while, if the greater the level of accuracy, the
value is worse.
Manual and automatic data acquisition has
advantages and disadvantages. The advantage of
manual data acquisition is to be able to carry out
measurements directly and be able to do physical
checking on the tool and directly take action if there
is damage on the tool; meanwhile, its disadvantages
include that data recorded is easily damaged, and
recorded errors can occur in data collection. The
advantage of automatic data acquisition is that data
can be used together; data security is guaranteed; data
can be accessed anywhere via the internet and can
analyze data faster. Meanwhile, its disadvantages are
that it takes skilled personnel in managing data and
measurement results that are not accurate when
compared to measurements using a multimeter.
5 CONCLUSIONS
Voltage and current gauges can send data to databases
through the internet and can be built using GSM
SIM800L and GPRS as data communication. Data
communication occurs during the measurement
process in a simplex manner. The results of the
current measurement with the multimeter measuring
instrument can be said to be almost the same, the
value that comes out is the result of the processing of
the programming language that is made where the
output is very dependent on the translation and
definition of the programming language. In current
data without solar power plant case, if the manual
measurement is used as a reference, the level of
accuracy of measurements on currents is 30%, while
if the automatic measurement as a reference is used,
it is 45%. In current data with solar power plant case,
if the manual measurement is used as a reference, the
level of accuracy of measurements on currents is
12%, while if the automatic measurement as a
reference is used, it is 13%.In voltage measurements,
if the manual measurement is used as a reference, the
level of accuracy is 2%; while, if the automatic
measurement is used as a reference, it is 2%. In this
case, the lower the level of accuracy, the better the
value; while, the greater the level of accuracy, the
value is worse.
ACKNOWLEDGMENTS
I would like to thank God Almighty because of his
blessing, and this tool can be completed. I would also
say thank to our parents who have provided support,
and prayers for all of us, and for all those whose
names cannot be mentioned one by one. I would also
like to thank the campus community who provided
support, laboratory facilities for the manufacture of
this tool.
REFERENCES
Abidin, A. F. Z., Jusoh, M. H., James, E., Al Junid, S. A.
M., & Mohd Yassin, A. I. (2015). Real-Time Remote
Monitoring with Data Acquisition System. IOP
Conference Series: Materials Science and Engineering,
99(1). https://doi.org/10.1088/1757-899X/99/1/012011
Adhya, S., Saha, D., Das, A., Jana, J., & Saha, H. (2016).
An IoT based smart solar photovoltaic remote
monitoring and control unit. 2016 2nd International
Conference on Control, Instrumentation, Energy and
Communication, CIEC 2016, 432–436.
https://doi.org/10.1109/CIEC.2016.7513793
Desima, M. A., Ramli, P., Ramdani, D. F., & Rahman, S.
(2018). Alarm system to detect the location of IOT-
based public vehicle accidents. 3rd International
Conference on Computing, Engineering, and Design,
ICCED 2017, 2018-March, 1–5.
https://doi.org/10.1109/CED.2017.8308118
Gurung, A., Chen, K., Khan, R., Abdulkarim, S. S.,
Varnekar, G., Pathak, R., … Qiao, Q. (2017). Highly
Efficient Perovskite Solar power plant Photocharging
of Lithium Ion Battery Using DC–DC Booster.
Advanced Energy Materials, 7(11), 1602105.
https://doi.org/10.1002/aenm.201602105
ICONIT 2019 - International Conference on Industrial Technology
198

Mehne, J., & Nowak, W. (2018). Predicting the battery core
temperature: Explanatory power of measurement
quantities under different uncertainty scenarios. Journal
of Energy Storage, 18, 476–484.
https://doi.org/10.1016/j.est.2018.06.001
Moghimi, M., Bennett, C., Leskarac, D., Stegen, S., & Lu,
J. (2016). Communication architecture and data
acquisition for experimental MicroGrid installations.
Asia-Pacific Power and Energy Engineering
Conference, APPEEC, 2016-Janua.
https://doi.org/10.1109/APPEEC.2015.7380917
Reatti, A., Kazimierczuk, M. K., Catelani, M., & Ciani, L.
(2017). Monitoring and field data acquisition system
for hybrid static concentrator plant. Measurement:
Journal of the International Measurement
Confederation, 98, 384–392.
https://doi.org/10.1016/j.measurement.2015.06.022
Septiana, Y. (2018). Design of prototype decision support
system for flood detection based on ultrasonic sensor.
MATEC Web of Conferences, 197.
https://doi.org/10.1051/matecconf/201819703017
Turahyo, N. (2017). Implementasi Sinusoidal Pulse Width
Modulation Pada Inverter Satu Fase Berbasis Lookup
Table Menggunakan Mikrokontroler 16-Bit.
Semnastek, (November), 1–2. Retrieved from
https://jurnal.umj.ac.id/index.php/semnastek/article/vi
ew/2035
Unger, E. L., Hoke, E. T., Bailie, C. D., Nguyen, W. H.,
Bowring, A. R., Heumüller, T., … McGehee, M. D.
(2014). Hysteresis and transient behavior in current-
voltage measurements of hybrid-perovskite absorber
solar power plant. Energy and Environmental Science,
7(11), 3690–3698. https://doi.org/10.1039/c4ee02465f
Analysis of Voltage and Electric Current in a Web-based Solar Power Plant
199
