
Single Phase Power Sensing with Developed Voltage and Current
Sensors
Vicky Mudeng, Himawan Wicaksono, Andreas T. Destanio, and Yusuf Nainggolan
Institut Teknologi Kalimantan
Keywords: Power, Voltage, Current, Full-wave rectifier, Differential amplifier
Abstract: A power sensor measures single-phase electrical power involving both voltage and current sensors. This
sensors' pair utilizes a full-wave rectifier and differential amplifier as signal conditioning circuits for sensing
voltage and current, respectively. Power can be obtained with multiplication between voltage and current. In
this study, an alternating current is converted to direct current using a full-wave rectifier by calibrating a
capacitor filter to understate ripple voltage. In addition, a differential amplifier yields output voltage
interpreting line voltage and current in root mean square for voltage and current sensors, respectively. The
work within this study develops voltage and current sensors to measure power on load from a grid. We employ
a theoretical calculation to calculate ripple voltage, peak voltage, the mean voltage of the rectifier, as well as
output voltage of the differential amplifier. Additionally, we simulate the voltage and current sensor circuits
to verify the theoretical results by applying different alternating current power. The results indicate that the
voltage and current sensors can be effective for measuring single-phase electrical power.
1 INTRODUCTION
The multiplication between voltage and current
produces electrical power. Therefore, a pair of
sensors for measuring electrical power possesses a
voltage and current sensors. A universal sensor to
measure voltage, current, or temperature was
conducted. A voltage divider consists of a negative or
positive temperature coefficient (NTC/PTC), shunt,
or common resistor was used for switching to only
one type of sensor (Bouabana, 2016). Besides, an
application of optical fiber as a high voltage
measurement has been recognized. An optical voltage
transducer proposed many extending in linear
performance, wider dynamic range, lighter weight,
smaller size, and safety compared with regular
inductive transformer (Ribeiro, 2013). In addition, the
all-digital on-chip voltage sensor monitor voltage
transient employing a relative reference model was
demonstrated. Also, a voltage sensor could convert
the measured voltage to binary codes (Chung, 2016).
A new configuration of voltage sensors based on fiber
optic consist of Bi
12
TiO
20
crystal was reported. The
voltage sensor simultaneously determined the voltage
and temperature with operating at 633 and 976 nm of
wavelengths (Filippov, 2000).
On the other hand, a review of current sensing
techniques was presented. A fundamental principle
for sensing currents, such as Ohm's law of resistance,
Faraday's law of induction, magnetic field sensor, and
Faraday effect. In this review, a shunt resistor was
used considerably due to more simple and accurate in
low current measurement (Ziegler, 2009). Moreover,
a highly precise magnetic current sensor was
developed to measure ± 0-300 A deploying
anisotropic magnetoresistance (Zhenhong, 2015).
Additionally, a current sensor could be designed
using a hall sensor (Yan, 2019). Research regarding
novel rectangular yokeless current transducer was
investigated for 400 amperes as a range of
measurements. Despite, there were disadvantages of
the designed sensor, for instance, a necessity of
digital to analog converter (DAC) card, digital
processing for the output signal, and high power
consumption for multi-sensor systems (Chirtsov,
2018). A sensitive and effective dual measurement
based on Johnson noise thermometry was presented.
This new approach used a single tunneling
magnetoresistive sensor with a high sensitivity of 250
mV/V/mT for measuring the current and temperature.
The combination of field-programmable gate array
(FPGA) and analog to digital converter (ADC) was
able to obtain the two measured parameters. The
Mudeng, V., Wicaksono, H., Destanio, A. and Nainggolan, Y.
Single Phase Power Sensing with Developed Voltage and Current Sensors.
DOI: 10.5220/0009443201630168
In Proceedings of the 1st International Conference on Industrial Technology (ICONIT 2019), pages 163-168
ISBN: 978-989-758-434-3
Copyright
c
2020 by SCITEPRESS – Science and Technology Publications, Lda. All rights reserved
163
range measurements were ± 10 A and −40 °C to 160
°C for current and temperature, respectively (Liu,
2018).
An understanding of measuring voltage and
current is fundamental to monitor electrical power on
load, particularly for single-phase alternating current
(AC) power. To the best of our knowledge, some of
the authors of this paper have, for the first time to
investigate a single-phase power sensor with a full-
wave rectifier using four diodes and differential
amplifier as signal conditioning circuits.
2 METHODS
2.1 Full-wave Rectifier
The aim of a full-wave rectifier is to transform an AC
voltage (𝑉
)
to a direct current voltage (𝑉
). The
characteristic of the output voltage is either positive
or negative voltage in the root mean square (RMS).
This circuit has four diodes. However, only two
diodes are conducted for each cycle. The use of a full-
wave rectifier circuit in this study is to represent a set
of AC voltage and current on the load at the primary
coil of the transformer to be DC voltage and current
at the transformer secondary coil for measuring
electrical power on load from a grid. A transformer
with a full-wave rectifier circuit, as well as a load
resistance (𝑅
) are shown in Figure 1.
GND
Line
Voltage
V
out
R
load
+
‐
V
in
D
4
D
1
D
2
D
3
Figure 1: Circuit of full-wave rectifier system.
The output voltage (𝑉
) is yielded by the
following equation.
𝑉
𝑉
2.𝑉
(1)
𝑉
𝑉
√
2 2.𝑉
(2)
𝑉
𝑉
√
2
(3)
𝑉
𝑉
√
2 2.𝑉
√
2
,
(4)
where, 𝑉
and 𝑉
are input and output peak
voltage, respectively. 𝑉
𝐷
denotes diode voltage
representing approximate 0.7 𝑉 due to it is a type of
silicon semiconductor. As explained previously, the
current for each cycle passes through two diodes,
therefore 2. 𝑉
𝐷
= 1.4 𝑉. In this form, 𝑉
and 𝑉
are
in RMS with 𝑉
is input voltage for the rectifier
circuit.
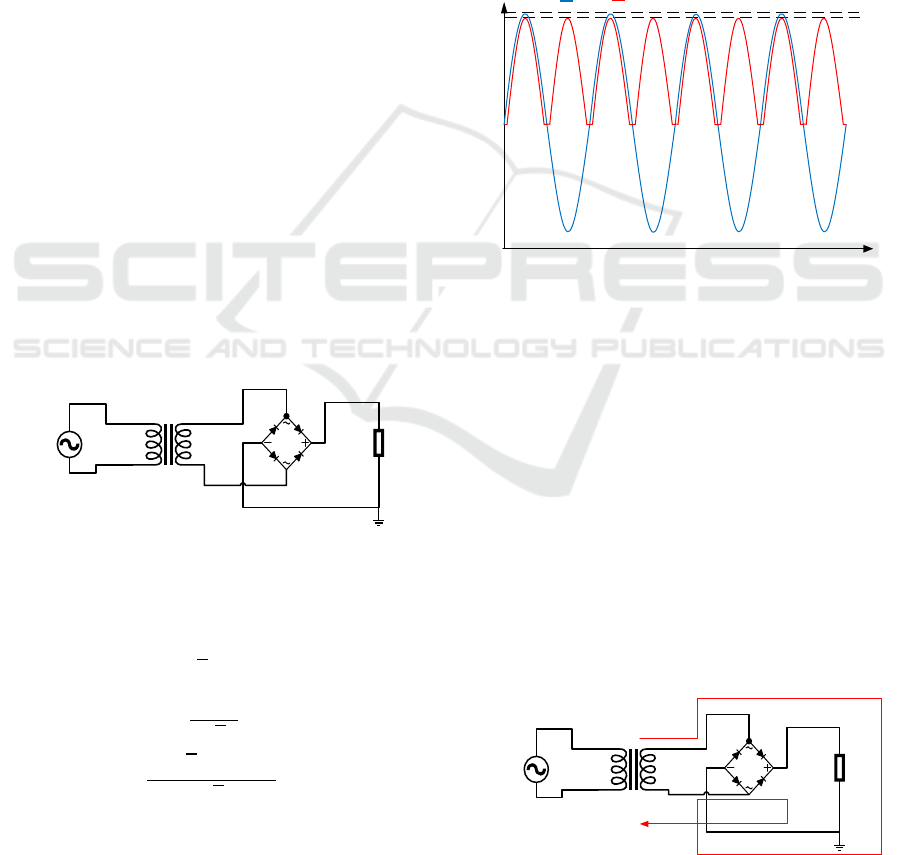
The voltage waveforms of 𝑉
and 𝑉
for the
full-wave rectifier are shown in Fig. 2. As can be
seen, there is a drop voltage for 𝑉
by discovering
𝑉
due to the performance of two diodes in the
circuit for each cycle. Farther, the negative part will
be reversed to be positive voltage caused by diode
two (𝐷
) and diode four (𝐷
). Thereunto, there is a
time delay for the circuit to give the 𝑉
due to the
two diodes need times to conduction.
0
V
P
‐V
P
0.02 0.04 0.06 0.08
time(s)
V
in
V
out
Voltage
(Volt)
V
in
Peak
V
out
Peak
Figure 2: The waveform of 𝑉
(blue line) and 𝑉
(red
line).
There are two procedures involving positive and
negative sections for rectification. For the positive
section, the current flows to diode one (𝐷
), then to
𝑅
. Thereafter, the current will be streamed down
to diode three (𝐷
) and return to the transformer. On
the other hand, for the negative section, the current
flows through 𝐷
, then to 𝑅
. Moreover, the
current passes to 𝐷
and return to the transformer. The
current constantly cross the 𝑅
, thus obtains 𝑉
under both positive or negative cycle. Therefore, even
though in the negative cycle, the 𝑉
will be a
positive voltage. Figure 3 shows the current direction
for each cycle.
(a)
GND
Line
Voltage
V
out
R
load
+
‐
V
in
D
4
D
1
D
2
D
3
I
s
ICONIT 2019 - International Conference on Industrial Technology
164
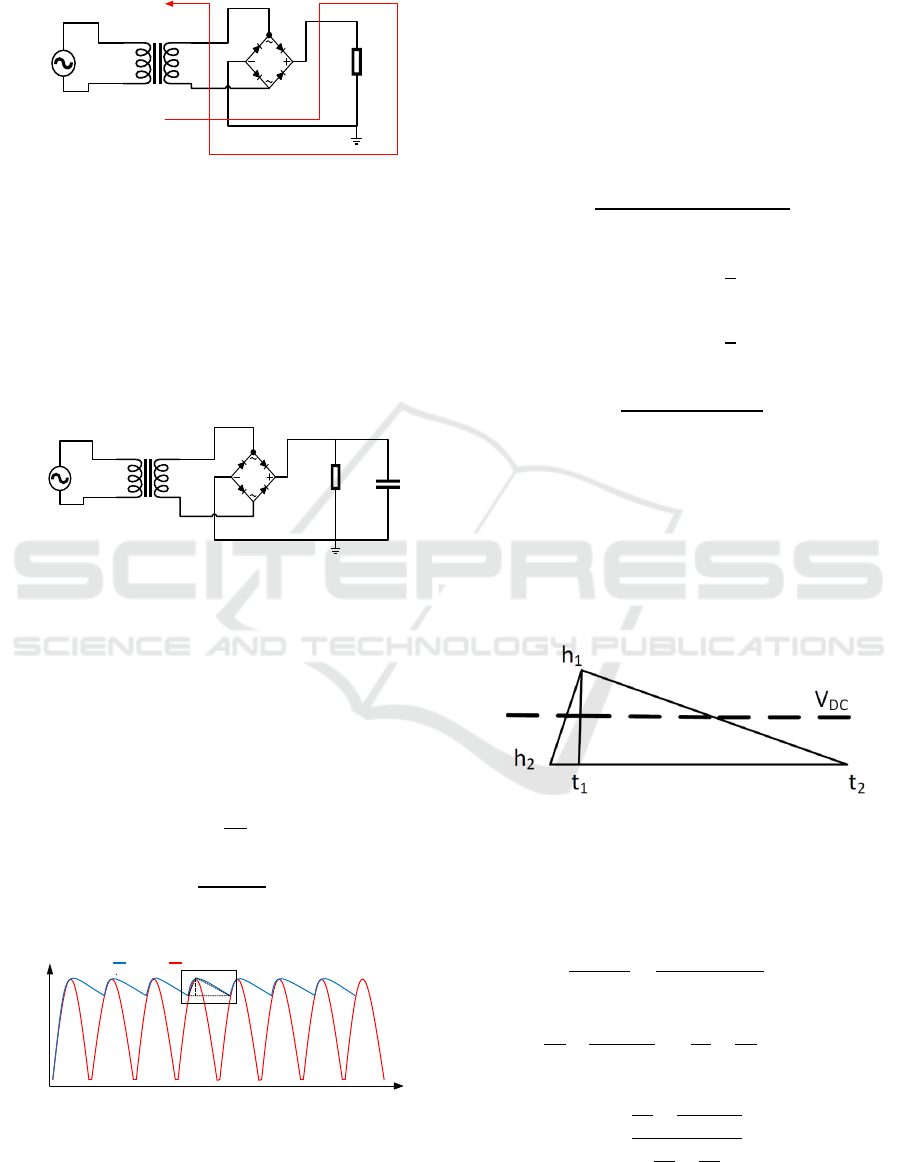
(b)
GND
Line
Voltage
V
out
R
load
+
‐
V
in
D
4
D
1
D
2
D
3
I
s
Figure 3: Current flow for (a) positive and (b) negative
cycles of the full-wave rectifier circuit.
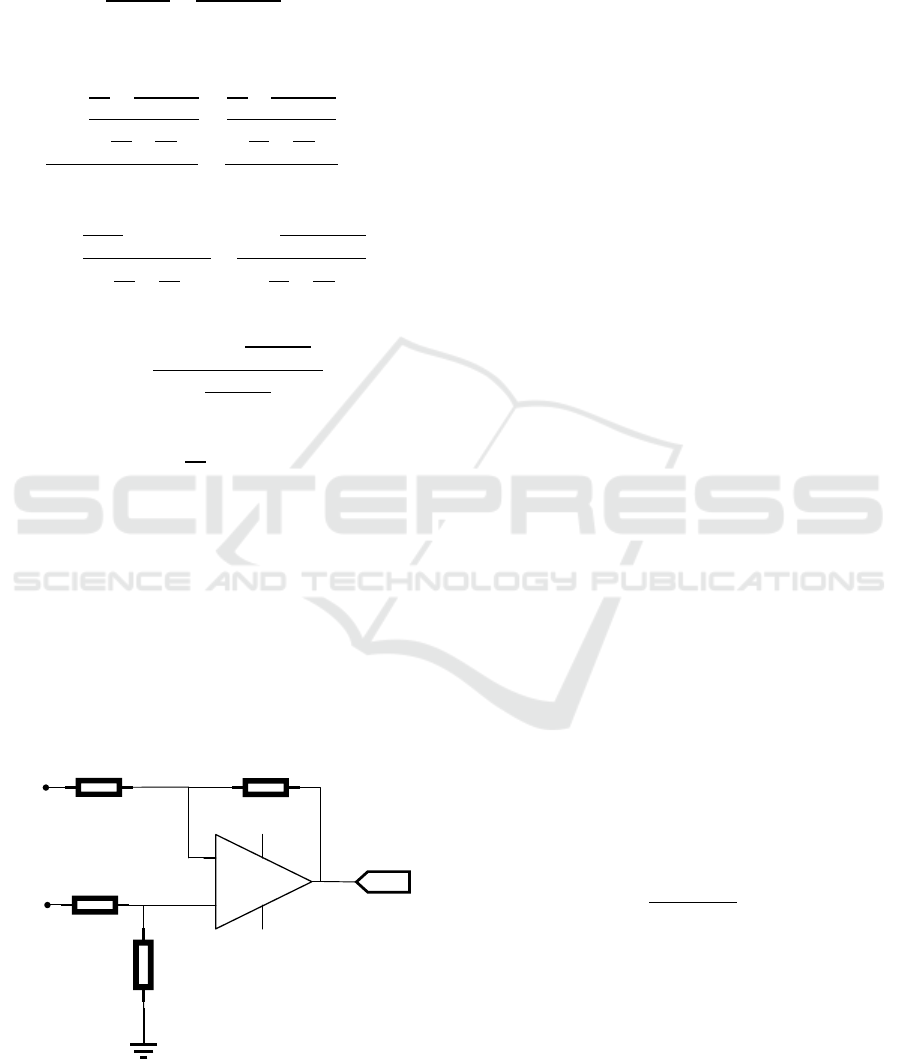
2.2 Capacitor Filter
The V
from the rectifier is DC voltage with several
ripples. In order to improve the rectification output,
hence approaching the genuine DC voltage. Thus
capacitor filter is utilized. The full-wave rectifier with
a capacitor filter is shown in Figure 4.
Line
Voltage
V
out
R
load
+
‐
V
in
D
4
D
1
D
2
D
3
C
GND
Figure 4: Full-wave rectifier circuit with a capacitor filter.
A ripple voltage 𝑉
is a function of
frequency and capacitance. With a certain
frequency, as well as an appropriate capacitor, the
𝑉
can be diminished and approach the DC
voltage. Where the equation for 𝑉
can be
written as
𝑉
𝐼
𝑓
𝐶
5
𝑉
𝑉
𝑅
𝑓
𝐶
,
6
0
V
P
‐1.4
0.02 0.04 0.06 0.08
V
ripple
V
out
time(s)
Voltage
(Volt)
Figure 5: The waveform of 𝑉
𝑜𝑢𝑡
(red line) and 𝑉
𝑅𝑖𝑝𝑝𝑙𝑒
(blue
line).
𝑅
is load resistance, 𝑓 denotes frequency on
the grid 𝑓 50 𝐻𝑧, and 𝐶 is capacitance value.
Figure 5 depicts the 𝑉
on the capacitor
corresponding with 𝑉
.
𝑉
is yielded using Pythagoras' theorem, as
can be seen inside the black square in Figure 5.
Then, the illustration is the triangle inside the
black square, as in Figure 6. With the triangle
assumption, we can write the expression of 𝑉
as
followed
𝑥
ℎ
ℎ
𝑡
𝑡
𝑉𝑟𝑎𝑡𝑒
ℎ
𝑥
2
𝑉𝑟𝑎𝑡𝑒
ℎ
𝑥
2
𝑉
𝑉𝑟𝑎𝑡𝑒
𝑉𝑟𝑎𝑡𝑒
2
,
7
where 𝑥 is hypotenuse voltage, ℎ
and ℎ
are
peak and valley voltages of 𝑉
, respectively.
Additionally, 𝑉𝑟𝑎𝑡𝑒
denotes the half voltage of 𝑥
respect to ℎ
, while 𝑉𝑟𝑎𝑡𝑒
is the half voltage of 𝑥
respect to ℎ
. Using Eq. 7, 𝑉
is discovered from
the average value. It can be affirmed with the
position of 𝑉
in the middle of the triangle
Priyanto, 2018, as shown in Figure 6.
Figure 6: Triangle approach for calculating 𝑉
.
2.3 Differential Amplifier
In an ideal differential amplifier, it is using an
analysis node at the inverting pin yields.
𝑉
𝑉
𝑅
𝑉
𝑉
𝑅
𝑉
𝑅
𝑉
𝑅
1
𝑅
1
𝑅
𝑉
𝑉
𝑉
𝑅
𝑉
𝑅
1
𝑅
1
𝑅
,
8
Single Phase Power Sensing with Developed Voltage and Current Sensors
165
due to negative feedback, therefore,
𝑉
𝑉
,
current summation on the non-inverting terminal
obtains
𝑉
𝑉
𝑅
𝑉
𝑉
𝑅
,
9
substituting Eq. (8) to Eq. (9)
𝑉
𝑉
𝑅
𝑉
𝑅
1
𝑅
1
𝑅
𝑅
𝑉
𝑅
𝑉
𝑅
1
𝑅
1
𝑅
𝑅
𝑉
𝑅
𝑅
𝑉
𝑅
𝑉
1
𝑅
1
𝑅
𝑉
𝑅
𝑉
𝑅
1
𝑅
1
𝑅
𝑉
𝑉
𝑉
𝑅
𝑅
𝑅
𝑅
𝑅
𝑅
𝑉
𝑅
𝑅
𝑉
𝑉
,
(10)
R
is the input resistor corresponding to V
and V
,
whilst R
is the negative feedback resistor
corresponding to inverting voltage (V
). Also, R
denotes resistor of a voltage divider for input to non-
inverting pin, and V
are non-inverting voltage. The
output of the amplifier is V
in this term. The
circuit of the differential amplifier is shown in Figure
7.
R
2
R
2
‐
+
V
outamp
GND
‐V
Sat
+
V
Sat
R
1
R
1
V
1
V
2
Figure 7: Differential amplifier circuit.
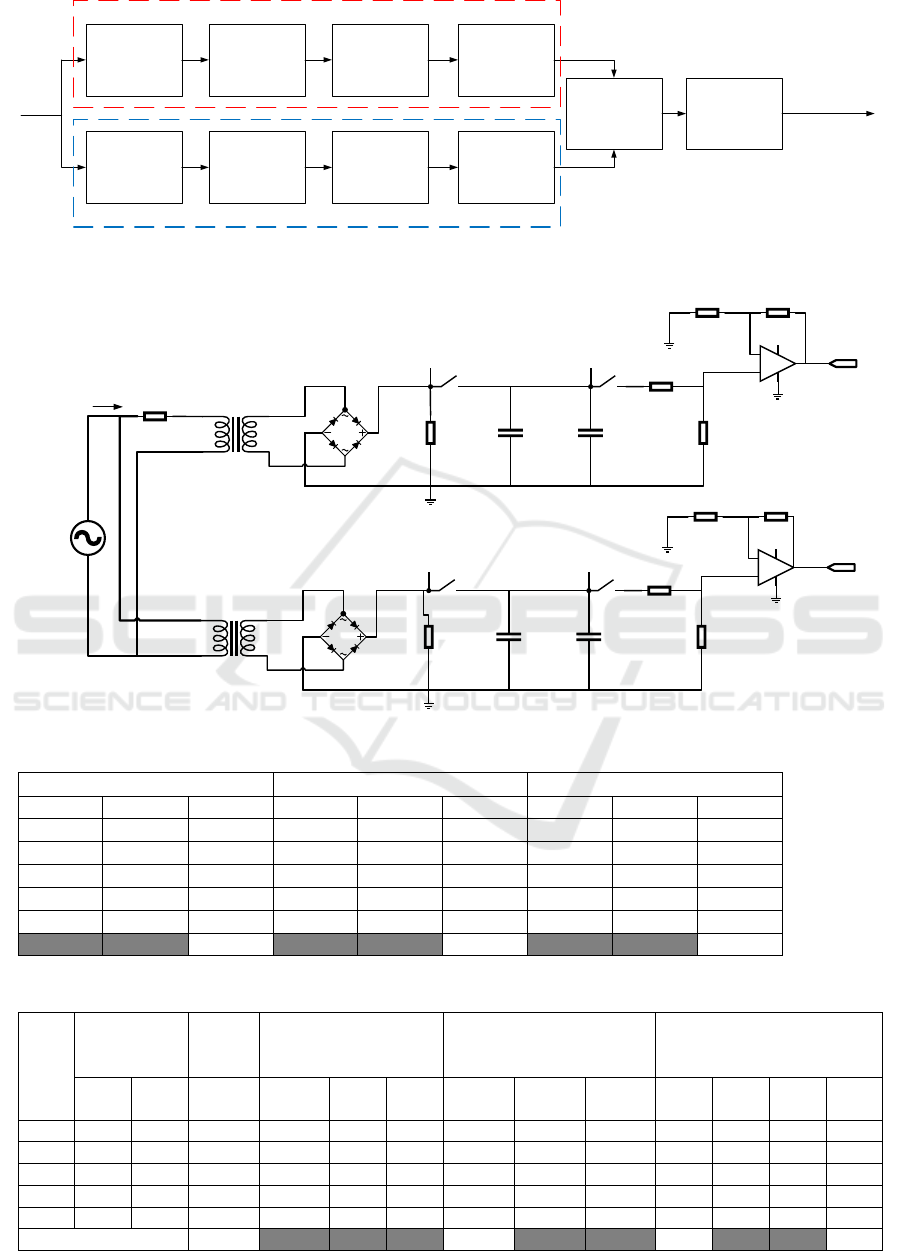
3 RESULTS
We developed a single-phase electrical power sensor
composed of a voltage and current sensors. To
measure a voltage, we need to put the metering on a
source in parallel. Therewith, the metering to measure
current is installed serially with the load. In this study,
we had two sensing systems and combined them for
measuring power. The full system of power sensor is
shown in Figure 8.
In this system, we calculated the results based on
theoretical knowledge and compared to the
simulation results. Next, the results of the voltage
sensor would be multiplied by the results of the
current sensor with a microcontroller (𝜇𝐶). However,
we did not discuss more regarding 𝜇𝐶 processing.
This study emphasized in voltage sensor and current
sensor represented by the system inside blue and red
lines, as shown in Figure 8.
Furthermore, we established a voltage sensor with
the specified line voltage, as in Table 1 column 1.
Then, the next process was to determine the data as in
Table 1 column 2-12. We performed one line voltage
of 220𝑉
for the current sensor and added a set of
the resistor on the primary coil of the transformer to
obtain 𝐼
, as in Table 2. Afterward, we could yield
as in Table 2 column 5-14.
SW1, SW2, SW3, SW4 were the switches. If the
SW1 and SW3 were opened, we obtained 𝑉
volt
and 𝑉
current, respectively. On the other hand, if
the SW1 and SW3 were closed, we obtained 𝑉
and 𝑉
using Eq. (7), simultaneously with
𝑉
and 𝑉
. 𝑉
and
𝑉
could be yielded with closed all
switches. The schematic of an electrical power sensor
is shown in Figure 9. With Eq. (10), resistor values
for the voltage sensor were 1𝑘Ω and 518Ω. Besides,
2.5𝑘Ω and 390Ω were for the current sensor. Further,
we used capacitors of 400 𝜇𝐹 and 1 𝑛𝐹 as a capacitor
filter for each sensor.
Moreover, we calculated relative error and its
average (Priyanto, 2018) with the following equation.
𝐸𝑟𝑟𝑜𝑟
%
𝐶𝑎𝑙 𝑆𝑖𝑚
𝐶𝑎𝑙
.100%,
(11)
Where 𝐶𝑎𝑙 denotes the calculated result, and 𝑆𝑖𝑚
is a simulated result. As can be seen in Tables 1 and
2, the increase of average errors occurs in 𝑉
and 𝑉
for the measuring. But, these errors.
ICONIT 2019 - International Conference on Industrial Technology
166
Transformer
StepDown
withLoadon
PrimaryCoil
Full‐wave
Rectifier
Capacitor
Filter
Differential
Amplifier
µC Display
Transformer
StepDown
Full‐wave
Rectifier
Capacitor
Filter
Differential
Amplifier
Line
Voltage
SinglePhase
ElectricalPower
CurrentSensor
VoltageSensor
Figure 8: Full system of single-phase electrical power sensing.
GND
1kΩ 400µF 1nF
2500Ω
390Ω
GND
390Ω2500Ω
GND
+
‐
5V
GND
Line
Voltage
1kΩ 400µF 1nF
1000Ω
518Ω
GND
518Ω1000Ω
GND
+
‐
5V
R
V
outampcurr
V
outampvolt
V
involt
V
out
Peak
current
V
out
Peak
volt
V
DCcurr
V
DCvolt
I
Pc urr
SW1
SW2
SW3 SW4
Figure 9: Schematic of a single-phase electrical power sensor.
Table 1: Results of the voltage sensor.
𝑽
𝒓𝒊
𝒑𝒑
𝒍𝒆𝒗𝒐𝒍𝒕
(Volt)
𝑽
𝑫𝑪𝒗𝒐𝒍𝒕
(Volt)
𝑽
𝒐𝒖𝒕𝒂𝒎
𝒑
𝒗𝒐𝒍𝒕
(Volt)
Cal Sim Error
(
%
)
Cal Sim Error
(
%
)
Cal Sim Error
(
%
)
0.0505 0.0560
10.9022
1.4028 1.4004
0.1680
0.2188 0.2191
0.1328
0.1505 0.1650
9.6384
4.1808 4.1740
0.1618
0.6522 0.6530
0.1246
0.3505 0.3820
8.9890
9.7368 9.7220
0.1517
1.5189 1.5208
0.1222
0.5505 0.5970
8.4481
15.2928 15.2720
0.1359
2.3857 2.3886
0.1216
1.1505 1.1810
2.6517
31.9608 31.9500
0.0337
4.9800 4.9919
0.2394
8.1259 0.1302 0.1481
Table 2: Results of the current sensor.
R
(Ohm)
𝑰
𝑷𝒄𝒖𝒓𝒓
𝑽
𝒐𝒖𝒕
𝑷𝒆𝒂𝒌
current
(
Volt
)
𝑽
𝒓𝒊𝒑𝒑𝒍𝒆𝒄𝒖𝒓𝒓
(Volt)
𝑽
𝑫𝑪𝒄𝒖𝒓𝒓
(Volt)
𝑽
𝒐𝒖𝒕𝒂𝒎𝒑𝒄𝒖𝒓𝒓
(Volt)
Cal Sim
Error
(%)
Cal Sim
Error
(%)
Cal Sim
Error
(%)
Cal Sim
Error
(%)
2000 0.1100 0.1095 0.4545 5.1888 0.1835 0.1156 36.9974 5.0971 5.1172 0.3941 1.8672 1.8603 0.3713
1000 0.2200 0.2170 1.3636 7.7840 0.2752 0.2656 3.4931 7.6464 7.7010 0.7097 2.8011 2.7919 0.3295
500 0.4400 0.4224 4.0000 10.3776 0.3670 0.3652 0.4878 10.1941 10.2324 0.3743 3.7345 3.7309 0.0968
250 0.8800 0.7587 13.7841 12.4544 0.4404 0.4397 0.1535 12.2342 12.3129 0.6391 4.4818 4.4777 0.0917
125 1.7600 1.2103 31.2330 13.8368 0.4893 0.4866 0.5536 13.5922 13.6011 0.0655 4.9800 4.9823 0.0463
Average Error (%) 10.1670 8.3371 0.4365 0.1871
Single Phase Power Sensing with Developed Voltage and Current Sensors
167

It did not affect the results of 𝑉
and
𝑉
due to 𝑉
and 𝑉
calculated by
a triangle approach. With these results, we proved
that the designed sensor is suitable for measuring
electrical power.
4 CONCLUSIONS
We designed a single-phase electrical power sensor
with both voltage and current sensors. Moreover, we
compared between calculated and simulated results
for each node in the designed sensor circuit. The
results of voltage and current sensors would be
multiplied; thus, we obtained the power. A
comparison between calculated and simulated results
indicated that the proposed power sensing sensor is
potent to monitor electrical power on the grid.
ACKNOWLEDGMENT
This research was financially supported by the
Ministry of Research, Technology, and Higher
Education of the Republic of Indonesia through grant
007/SP2H/LT/DRPM/2019.
REFERENCES
Bouabana, Abdoulkarim, Erol Sanal, Constantinos
Sourkounis, 2016. Development of A Low Cost
Universal Sensor for An Accurate Measurement of
Current, Voltage and Temperature. In 5th International
Conference on Renewable Energy Research and
Applications. IEEE.
Chirtsov, Andrey, Pavel Ripka, Jan Vyhnánek, 2018.
Rectangular Array Current Transducer with Integrated
Microfluxgate Sensors. In 2018 IEEE Sensors. IEEE.
Chung, Ching-. C, Mei-I. Sun, 2016. An All-Digital
Voltage Sensor for Static Voltage Drop Measurements.
IEEE Instrumentation and Measurement Society prior
to the acceptance and publication.
Filippov, Valery N., Andrey N. Starodumov, Vladimir P.
Minkovich, Francisco G. P. Lecona, 2000. Fiber Sensor
for Simultaneous Measurement of Voltage and
Temperature. IEEE Photonics Technology Letters, Vol.
12, No. 11.
Liu, Xu Y-., Philip W. T. Pong, Chun H-. Liu, 2018. Dual
Measurement of Current and Temperature Using A
Single Tunneling Magnetoresistive Sensor. In 2018
IEEE Sensors. IEEE.
Priyanto, Yun T. K., Vicky Mudeng, Andhika Giyantara,
Ali Fahdian, Bima W. A. Achmadi, 2018. A
Comprehensive Study of Alternating Current Voltage
Sensor Using Rectifier and Operational Amplifier. In
2nd Borneo International Conference on Applied
Mathematics and Engineering. IEEE.
Ribeiro, Bessie d. A., Marcelo M. Werneck, José L. d. S.-
N., 2013. Novel Optimization Algorithm to
Demodulate a PZT-FBG Sensor in AC High Voltage
Measurements. IEEE Sensors Journal, Vol. 13, No. 4.
Yan, Hao, Yong X-. Xu, Wei D-. Zhao, He Zhang, Chris
Gerada, 2019. DC Drift Error Mitigation Method for
Three-Phase Current Reconstruction with Single Hall
Current Sensor. IEEE Transactions on Magnetics, Vol.
55, No. 2.
Zhenhong, Zhang, Okabe Syuji, Akiyama Osamu, Konno
Hideto, 2015. Development of the Highly Precise
Magnetic Current Sensor Module of +/−300 A Utilizing
AMR Element with Bias-Magnet. IEEE Transactions
on Magnetics, Vol. 51, No. 1.
Ziegler, Silvio, Robert C. Woodward, Herbert H.-C. Iu,
Lawrence J. Borle, 2009. Current Sensing Techniques:
A Review. IEEE Sensors Journal, Vol. 9, No. 4.
ICONIT 2019 - International Conference on Industrial Technology
168
