
Innovation in Corruption Risk Mapping using a Value Chain Map
and Its Application in the Upstream Oil and Gas Industry in
Indonesia
Budi Ibrahim
1,2
, Tony Robey
1
, Haris Wahyudi
3
1
Independent Researcher
2
Advisor Development & Technology, Pertamina UTC
3
Mechanical Engineering Department, Faculty of Engineering, Universitas Mercu Buana, Jakarta
Keywords: Value Chain Map, Corruption Risk, Business Risk, Oil, And Gas Upstream Industry
Abstract: Risk management is perceived as an indivisible part of good management and governance. Identifying risk
and communicating that information is important to all risk management frameworks but at present traditional
frameworks use the perception-based and traditional heat map approach. A corruption risk map of upstream
oil and gas industry integrated with a business risk map, designed on Value Chain Map (VCM) and Value
Chain Analysis (VCA) principals, and combined with a non-geographical map, spatial analysis, and evidence-
based material, are considered an innovation forming part of deliverables from the research entitled Research
on Corruption Risk in Indonesian Upstream Oil & Gas Industry - Mitigation Policy Analysis - Evidence-
Based Approach that is granted by ACE (Anti-Corruption Evidence Research Consortium) led by SOAS
University of London and funded by the Department for International Development (DFID) from the UK
Government. The corruption risk mapping that has been developed is expected to map corruption risks in line,
and integrated with shareholder value, easily communicated and visually apprehensible. The proposed VCM
could be collectively used not only as a risk map by stakeholders but also as a multi-dimensional database to
store and analyze evidence-based data/information, enabling the collaboration and synergy in risk mitigation.
To further ensure the potential use of this VCM-based risk map, both by the upstream oil and gas industry
and by law enforcement, the Special Task Force for Upstream Oil and Gas Business Activities (SKK Migas),
the Corruption Eradication Commission (KPK) and the Financial Transaction Reports and Analysis Center
(PPATK), as related stakeholders, collaborated and supported the development. We conclude that the
proposed VCM can serve as an application and utility of the value chain architecture for cost advantage
purposes.
1 INTRODUCTION
The concept of the value chain (VC) was introduced
by Porter (Porter, 1985) to show activities that a firm
operating in a specific industry can introduce to
deliver a valuable product or service, helping the
company position itself in the pursuit of competitive
advantage against its competitor. Value Chain
Map/Mapping (VCM) is a method that defines the
primary and supporting operations related to the
service or product line of a company and is often used
in management policy to define potential
performance improvement. VCM is the initial process
in value chain analysis to identify main and
supportive business activities and all related
components. The benefit of implementing VCM can
be summarized as follows: a) provides a platform for
communication and discussion with stakeholders, b)
reveals missing information including needs,
impacts, and gaps for each entity in the value chain,
c) expands the perspective of an organization's
external environment; d) helps organizations
prioritize activities and provides stakeholders with a
more tangible description of activities (Mooney,
2014).
Value chain analysis (VCA) is a method in which
a company defines its main activities and supports
activities that contribute value to its final product and
then evaluate these activities to decrease expenses or
boost differentiation. Analysis of the value chain has
been implemented in different areas from the moment
Ibrahim, B., Robey, T. and Wahyudi, H.
Innovation in Corruption Risk Mapping using a Value Chain Map and Its Application in the Upstream Oil and Gas Industry in Indonesia.
DOI: 10.5220/0009442002950302
In Proceedings of the 1st International Conference on Anti-Corruption and Integrity (ICOACI 2019), pages 295-302
ISBN: 978-989-758-461-9
Copyright
c
2020 by SCITEPRESS – Science and Technology Publications, Lda. All rights reserved
295
it was introduced. It has some advantages to reduce
operational costs, optimize efforts, eliminate waste,
improve health and safety, and increase profitability
(Reese, Waage, Gerwin, & Koch, 2016). There are
two distinct approaches, depending on what sort of
competitive benefit a business wishes to achieve: cost
advantage and differentiation advantage (Jurevicius,
2013). Analysis of the value chain allows
organizations to assess business processes in order to
provide the greatest opportunity to decrease operating
costs, optimize efforts, eliminate waste, enhance
health and safety and boost profitability (Reese et al.,
2016).
Value chains in the oil and gas industry have been
developed to describe business processes in upstream,
midstream, and downstream activities (Elsaghier,
2017; MOGA, 2018; OECD, 2016; Shqairat &
Sundarakani, 2018). OECD describes the process of
value chains in extractive industries from the decision
to extract revenue spending and social investment
projects (OECD, 2016). UNCTAD (UNCTAD, 2012)
and IBEF (Ibef, 2014) classified value chains into
upstream, midstream, and downstream. Sub activities
under each process are divided in more detail by
Olesen (Olesen, 2016) to Upstream (Tender &
Concession, Exploration, Installation, Production,
Field Abandoning); Midstream (Processing, Storage,
Transportation) and Downstream (Sales,
Distribution).
The oil and gas value chain may have a strong
impact on businesses that operate in this sector
because technology is high cost and sophisticated;
exploration is uncertain; there are legal and social
challenges; and transportation and storage needs. In
Indonesia, the oil and gas sector is the economy's
primary player and is strategically important in
promoting future economic viable growth plans. This
industry is one of many sectors that has received a
great deal of attention when it comes to risk
management because the risk exists in every single
operation in upstream, midstream, and downstream
activity. The oil and gas industry in Indonesia is a
significant source of national revenue in tax receipts
and through production sharing contracts (PSCs)
under which a contractor is entitled to a share of total
oil and gas produced to cover exploration and
development costs, while the remaining oil and gas
produced is spilled between the contractor and the
government. This approach has been replicated in
several oil and gas producing countries. However,
PSCs have been at greater risk of corruption than
other systems of extracting value from oil and gas
production. The results and findings of this research
may, therefore, have far-reaching benefits to the anti-
corruption initiatives of other oil-producing nations.
Mitigating risk in the oil and gas industry
commences with effective communication, the same
way as other risk management programs begin.
However, visualization in risk management is not
easy since the risk is extremely difficult to visualize
and describe. One method is by implementing
Enterprise Risk Management (ERM).
ERM has gained organizational attention due to
globalization in the business environment,
technological advancement, innovation in business
operations, and pressure from regulatory bodies to
manage risk in a holistic manner (COSO, 2017). It is
a popular structure employed by businesses to
recognize future occurrences that may influence the
enterprise, handle related hazards and possibilities
and provide reasonable assurance that the goals will
be met (COSO, 2004; Johnson & Johnson, 2018).
However, not all studies about ERM and businesses
have disclosed important beneficial relationships
(Agustina & Baroroh, 2016; Pagach & Warr, 2011;
Quon, Zéghal, & Maingot, 2012). The currently
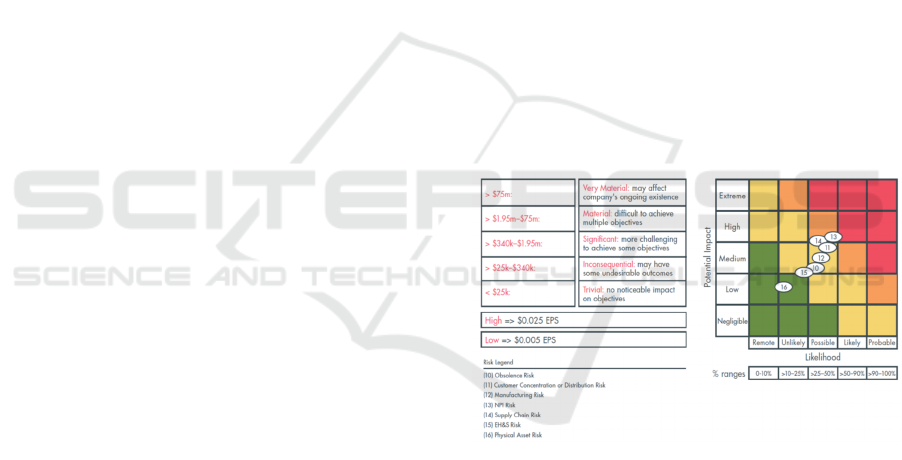
available risk mapping method using the traditional
two axis chart can be seen in Figure 1 (CGMA, 2012).
Figure 1. Risk heat map (CGMA, 2012)
Using this risk heat map in risk mitigation has
caused some difficulties in visualizing and analyzing
risks and interpreting the results. This paper will
suggest these difficulties can be overcome by the
development of a VCM for the upstream oil and gas
industry in Indonesia. We believe that the proposed
VCM is an innovation for both corruption risk and
business risk and would have significant potential
usage for the business environment and law
enforcement. The study will focus on private sector
corruption/ bribery in the industry of upstream oil and
gas in Indonesia.
The research project seeks not only to deliver a
VCM specifically for the upstream oil and gas
ICOACI 2019 - International Conference on Anti-Corruption and Integrity
296
industry of Indonesia but will also be of benefit to
similar operations in other countries. A VCA
consisting of Management Cockpit, DEA (Data
Envelopment Analysis), Benford’s Analysis, House
of Risk, Corruption Risk Map (evidence-based) will
be the initial proof of concept for the developed
VCM.
2 METHODOLOGY
The VCM was developed for the purpose of
mitigating corruption risk, but at the same time, can
be used to reduce business risks in the upstream oil
and gas sector in Indonesia. The VCM model is based
on geospatial mapping to display layers containing
different information and data. VCA can then be
performed on VCM layers containing data and
information in the form of numbers. Based on the
output of the VCA assessment, color gradations are
presented to show a risk map that can be used to map
corruption risks, where this method is commonly
used in the ERM technique.
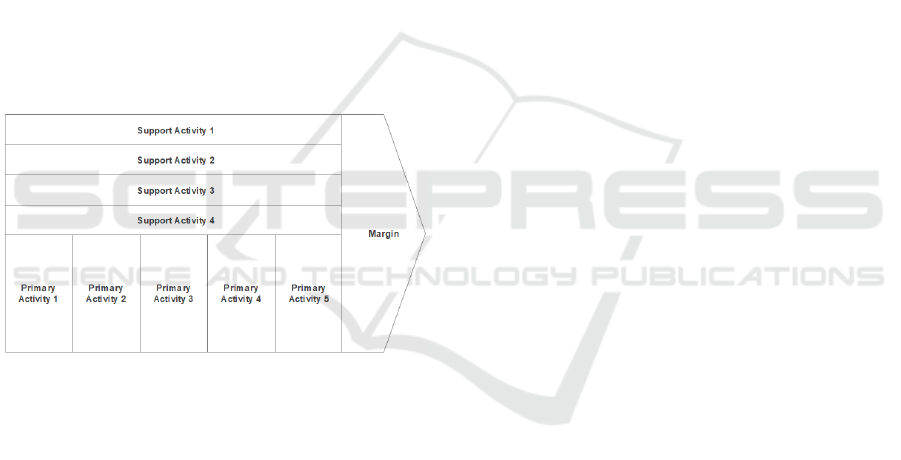
Figure 2. VC Model by Porter (Porter, 1985)
To understand the primary and supporting
activities, related studies were reviewed, following
which these studies, regulatory framework, and
current practice in the context of the upstream oil and
gas industry in Indonesia were evaluated. It is
intended that the value chain conforms with business
processes that have been implemented in upstream oil
and gas in Indonesia, mainly by businesses in the
private sector, such as contractors, vendors, and
traders.
The development of VCM is carried out based on
Porter's value chain method, as shown in Figure 2.
The upper and lower part is defined as supportive and
primary activities, respectively. The primary activity
is considered the successive steps that flow through
the operations process in upstream oil and gas in
Indonesia depicted as the vertical box going from left
to right while support activities in the form of
horizontal boxes are activities that support the process
in the primary activity.
In the process of identifying the business process,
data extraction, and discussion were carried out with
SKK Migas to understand and compile the activities
of each box in the value chain. The processes were
also determined from the regulatory framework in the
context of Indonesia (Undang-Undang RI No. 22,
2011) and SKK Migas Decree Number: KEP-
0078/SKKMA0000/2018/S0 about Proses Bisnis Skk
Migas (SKK Migas, 2018). Current upstream oil and
gas business activities in Indonesia are regulated by
relevant legislation such as Law (Undang-Undang RI
No. 22, 2011), Government Regulation (PP RI No.
59, 2007), Minister of Energy and Mineral Resources
Regulation (Permen ESDM RI No. 52, 2018; Permen
ESDM RI No. 59, 2007), and Governance
Regulations in SKK Migas (PTK, Pedoman Tata
Kerja) (SKK Migas, 2013, 2017, 2019).
Discussions and brainstorming were then
conducted with stakeholders, particularly the Special
Task Force for Upstream Oil and Gas Business
Activities (SKK Migas), The Corruption Eradication
Commission (KPK) and the Financial Transaction
Reports and Analysis Center (PPATK) to ensure that
the process flow in the primary and supporting
activities represented the business processes in the
upstream oil and gas in Indonesia. This step is crucial
in order to have the agreement of VCM business
processes.
For the purpose of analysis, Tableau software was
used to display VCM in the geospatial mode. It was
then used to sketch VCM based on coordinates as a
spatial function. Each box has its own identity
according to the name-value chain attached to it.
Then, Tableau read the Excel file containing financial
data and types of activities. The data was visualized
in the form of a heat map. Values that deviate from
the expected result could be indicators of fraud.
Analysis of data will then be strengthen using Data
Envelopment Analysis (DEA), Benford analysis, and
House of Risk (HoR).
DEA is used to measure the relative efficiency of
each value chain. It can be used to identify whether
the value chain has efficiency (I, S, V, P, & A, 2013;
Putra & Adinugraha, 2018). Any inefficiency could
be caused by corruption (Ashoori, N.A., Mozaffari,
2013).
Detection of anomalies can be implemented in
various ways. One of the techniques for analyzing
anomalies is Benford’s law, a well-known method of
detection. When applied to value chainsets, the law of
Benford can be used as a screening tool for fraud
detection. The law defines the first digit frequency
Innovation in Corruption Risk Mapping using a Value Chain Map and Its Application in the Upstream Oil and Gas Industry in Indonesia
297
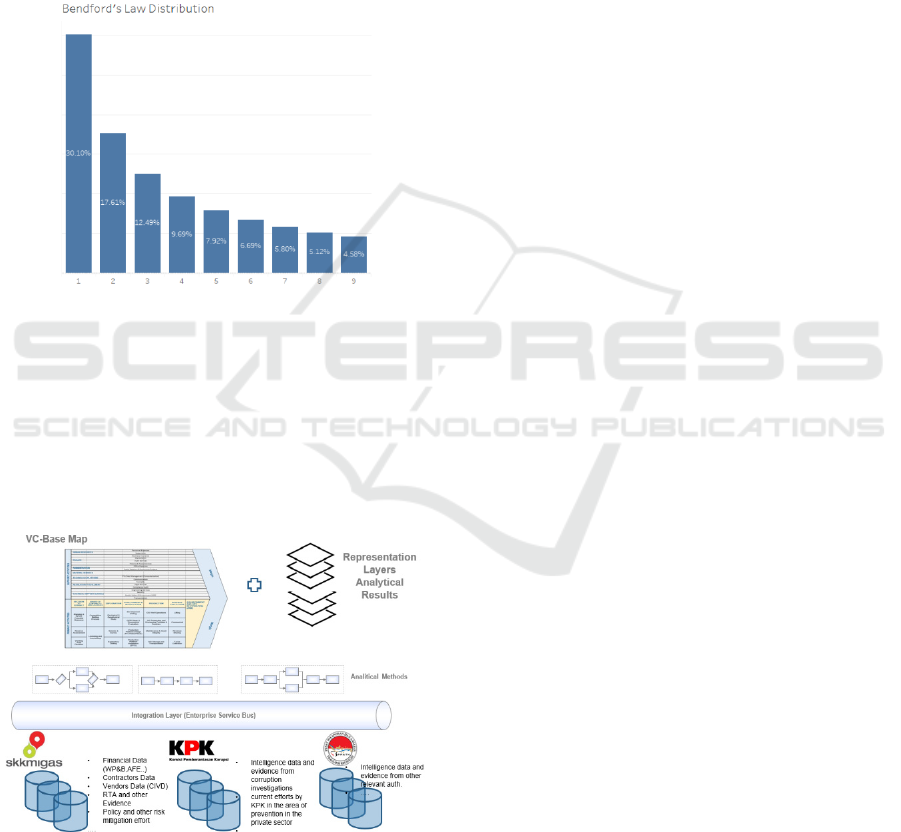
distribution in data sets and compares the
distributions anticipated and observed. Since number
1 most frequently appears as the first digit in
information progressions and subsequent numbers
less frequently, powerful deviations from the
anticipated frequencies or anomalies may show that
the information is suspect or manipulated. If an
authorization limit is $10,000; then frequent first two
digits will be identified in the region of 99, 98, and 97
if an effort is made to maximize authorizing
expenditures. Figure 3 shows Benford’s law
distribution embedded in Tableau software.
Figure 3. Benford’s law distribution
House of Risk (HoR) has been historically used
for identifying supply chain risk (Pujawan &
Geraldin, 2009). In this research, HoR is used to
identify corruption risks based on VCM. The
corruption risks used in HoR were based on evidence
obtained from the Right to Audit activities at SKK,
investigative data from KPK, and analysis of
suspicious financial transaction reports from PPATK.
Figure 4. VCM Conceptual and data/information
integration model
The developed VCM is then supported by VCA
so that it can be used to mitigate both corruption risk
and business risk. Data collaboration design for this
purpose is illustrated in Figure 4. Integrated data and
information from SKK Migas, KPK, and PPATK can
be included in the VCM. The distribution of value or
information will be displayed in layers in the form of
a heat map. Therefore, this VCM will be used for the
purpose of mitigating corruption risk and business
risk.
3 RESULT AND DISCUSSION
The literature on business processes, conducted in
accordance with appropriate legislation, was studied
and conclusions shown in Table 1 for primary
activities and Table 2 for supporting activities. The
decision to extract and Award of Contracts and
Licenses, the first two activities, were included in the
value chain to show complete sequences in upstream
oil and gas in Indonesia. These activities were not
evaluated for current VCM and VCA but will be used
in the future.
Then the value chain was developed, as shown in
Figure 5. The primary activities, sequential, begin
with Decision to Extract, Award of Contract and
Licenses, Exploration, Development & Installation,
Production, Revenue Collection, Abandonment, and
Site Restoration. These activities are referred to as
Level 1 and sub-activities under Level 1 labeled
Level 2.
The activity in the Decision to Extract involves
assessing the potential for oil and gas resources that
have not been discovered and determining the
feasibility of oil or gas production. Evaluations are
carried out using one or a combination of the
following methods: volumetric, well-performance,
mathematical modeling, and analogy comparing
reservoirs with similarities in geology and/or
performance. Award of Contracts and Licenses are
activities aimed at offering the right company to
manage a working area (Wilayah Kerja, WK)
containing oil & gas. Exploration is to evaluate the
suitability of oil and gas projects and to conduct
geological and geotechnical research. Development
& Installation are activities to construct underground
and surface equipment to securely and effectively
produce oil and gas. Production includes activities to
extract, process, and export oil & gas as per contract
agreement. Revenue Collection involves taxation on
profit from oil or gas lifting and subsequent
commercial opportunities. Abandonment and Site
Restoration are activities to permanently plug wells,
remove surface equipment, and restore the block
according to the initial contract conditions.
ICOACI 2019 - International Conference on Anti-Corruption and Integrity
298
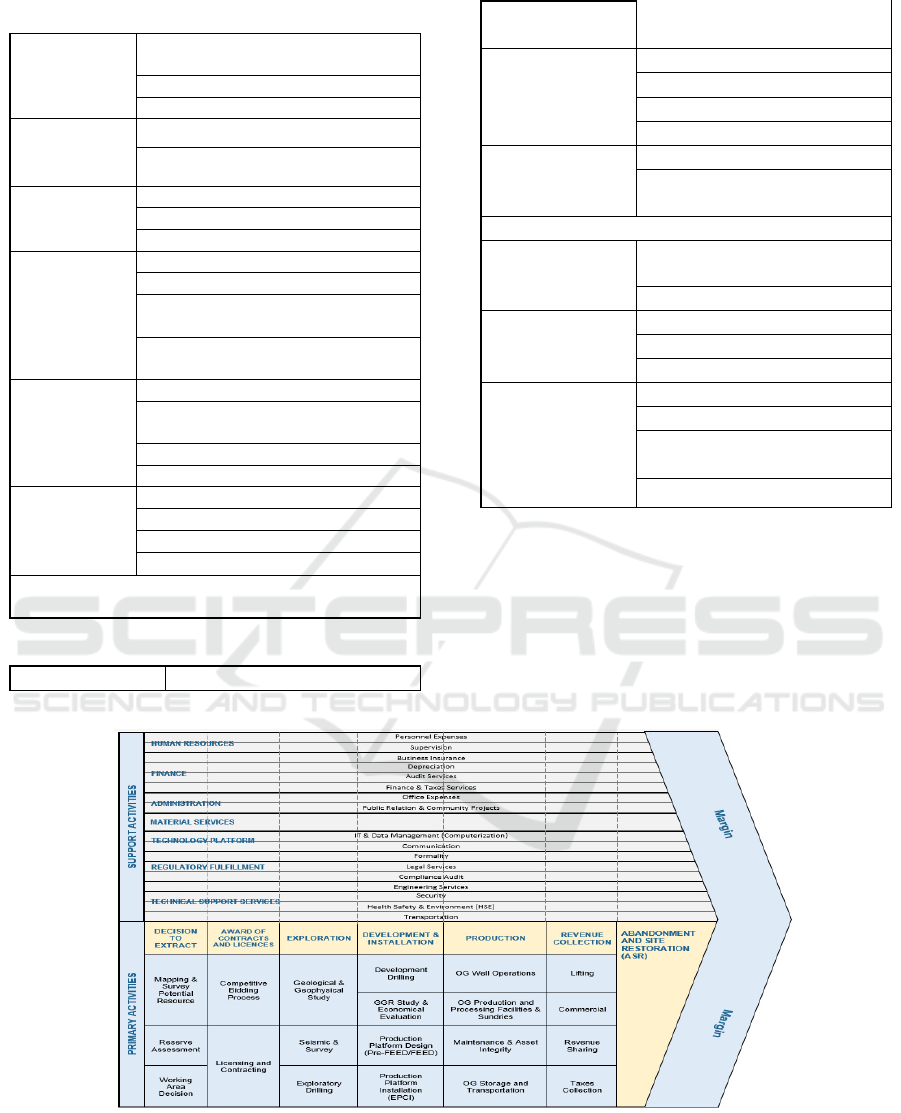
Table 1. Primary activities
Decision to
Extract
Mapping & Survey Potential
Resource
Reserve Assessment
Working Area Decision
Award of
Contracts and
Licenses
Competitive Bidding Process
Licensing and Contracting
Exploration
Geological & Geophysical Study
Seismic & Survey
Exploratory Drilling
Development &
Installation
Development Drilling
GGR & Economical Evaluation
Production Platform Design (Pre-
FEED/FEED)
Production Platform Installation
(EPCI)
Production
OG Well Operations
OG Production and Processing
Facilities & Sundries
Maintenance & Asset Integrity
OG Storage and Transportation
Revenue
Collection
Lifting
Commercial
Revenue Sharing
Taxes Collection
Abandonment and Site Restoration
T
able 2. Supporting activities
Personnel Expenses
Human
Resources
Supervision
Finance
Business Insurance
Depreciation
Audit Services
Finance & Tax Services
Administration
Office Expenses
Public Relations &
Community Projects
Material Services
Technology
Platform
IT & Data Management
(Computerization)
Communication
Regulatory
Fulfillment
Formality
Legal Services
Compliance Audit
Technical
Support Services
Engineering Services
Security
Health Safety &
Environment (HSE)
Transportation
In the support activity section, Level 1 is Human
Resources, Finance, Administration, Material
Services, Technology Platform, Regulatory
Fulfillment, and Technical Support Services. Similar
to the above convention, the sub-activities were
labeled as Level 2, as depicted in an elongated
horizontal box. Margins were created to show the
efficiency indicator in the value chain
.
Figure 5. Value chain map in upstream oil and gas Indonesia
Innovation in Corruption Risk Mapping using a Value Chain Map and Its Application in the Upstream Oil and Gas Industry in Indonesia
299
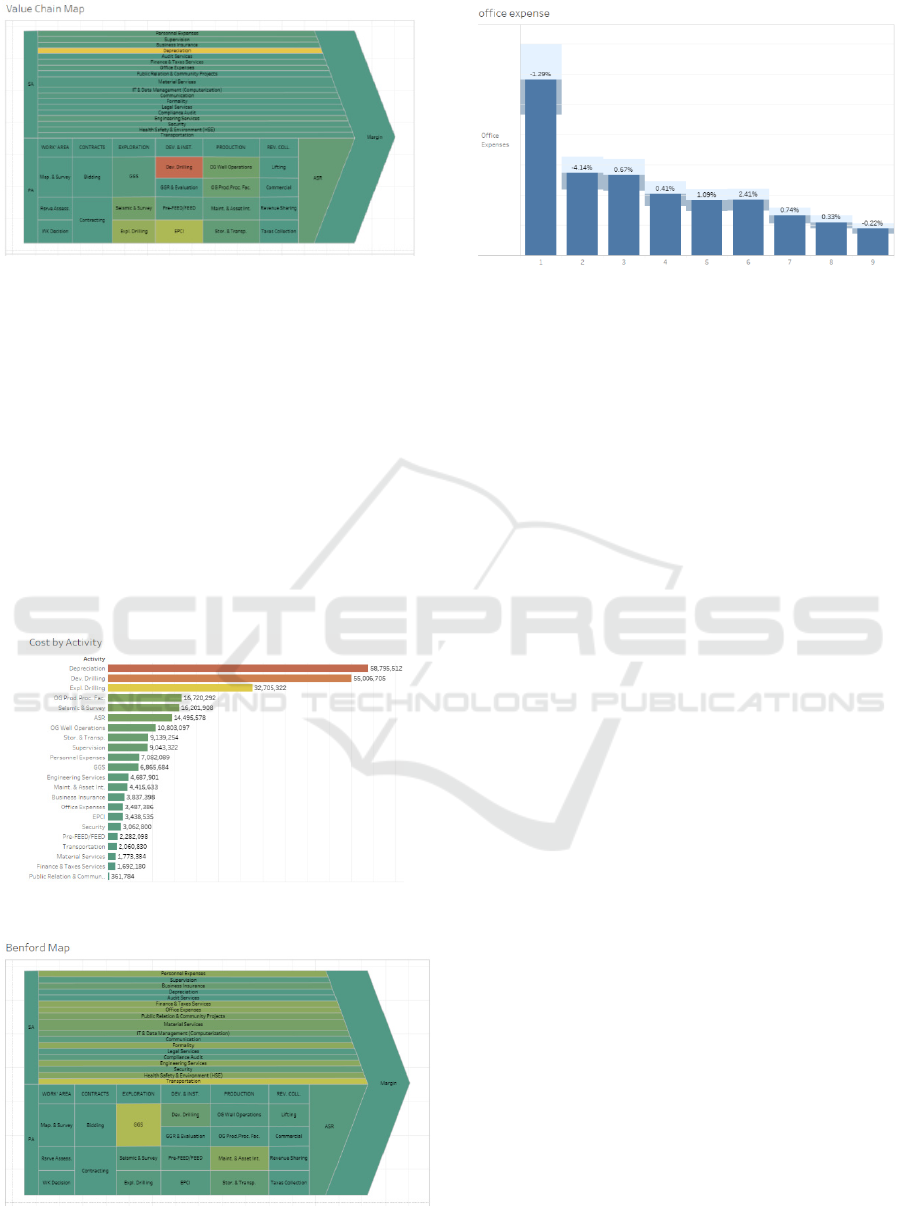
Figure 6. VCM expenditure analysis
Visual analysis can be performed by presenting a
layer that has been generated by Tableau software.
VCA was undertaken on the data represented by a
particular layer. The layer can be in the form of
financial data, activities of contractors or vendors as
well as some audit findings.
Figure 6 shows the distribution of financial data
that has been carried out for each activity in the value
chain. This figure shows which activities have the
smallest scale to the largest. The color in Figure 6
representing the amount of financial expenditure, the
higher showing red, and the lower in green. The result
can also be displayed in the form of a bar chart, as
shown in Figure 7.
Figure 7. Financial report for activities in VCM
Figure 8. VCM showing Benford analysis
Figure 9. Example of Benford analysis for Office Expense
The financial map will later be supplemented by
the Benford analysis map, as shown in Figure 8. Both
layers provide information which has potential
irregularities. Other layers, such as the number of
contractors or vendors, PPATK data, and even the
KPK information, work together to show indications
of potential risks. Therefore, this VCM can be used as
a Cockpit Management/ Strategic Management and
Planning Tool.
4 CONCLUSIONS
The Value Chain Map for the upstream oil and gas
industry in Indonesia was successfully developed and
considered as an innovative risk mitigation method
for both corruption and business risk and had the
potential for use by the business environment as well
as law enforcement prevention and investigation. We
conclude that the proposed VCM can be served as an
application and utility of the value chain architecture
for cost advantage purposes. VCM can be adopted as
a tool and utility of the value chain map for corruption
risk and business risk. VCM can be used to improve
the business processes in the upstream oil and gas
industry in Indonesia.
ACKNOWLEDGEMENTS
This paper is an output of the SOAS Anti-Corruption
Evidence (ACE) research consortium funded by UK
aid from the UK Government. The views presented in
this publication are those of the author(s) and do not
necessarily reflect the UK government's official
policies or the views of SOAS-ACE or other partner
organizations. For more information on SOAS-ACE
visit www.ace.soas.ac.uk.
ICOACI 2019 - International Conference on Anti-Corruption and Integrity
300

We would also like to show our gratitude to SKK
Migas for the support, time, and relevant
data/information relating to the upstream oil and gas
Indonesia and to KPK and PPATK for relevant
information about corruption.
REFERENCES
Agustina, L., & Baroroh, N. (2016). The relationship
between Enterprise Risk Management (ERM) and firm
value mediated through financial performance. Review
of Integrative Business and Economics Research.
Ashoori, N.A., Mozaffari, M. R. (2013). Prioritizing
Contractors Selection Using DEA-R and AHP in
Iranian Oil Pipelines and Telecommunication
Company. International Journal of Data Envelopment
Analysis, 1(4), 259-.
CGMA. (2012). How to communicate risks using a heat
map. Retrieved from
https://web.actuaries.ie/sites/default/files/erm-
resources/communicate-risks-using-heat-map.pdf
COSO. (2004). COSO Enterprise Risk Management —
Integrated Framework. Committee of Sponsoring
Organizations of the Treadway Commission.
https://doi.org/10.1504/IJISM.2007.013372
COSO. (2017). Enterprise Risk Management Integrating
with Strategy and Performance. The Committee of
Sponsoring Organizations of the Treadway
Commission.
Elsaghier, E. H. (2017). Planning and Optimising of
Petroleum Industry Supply Chain and Logistics under
Uncertainty (Sheffield Hallam University). Retrieved
from
https://search.proquest.com/docview/2035748288?acc
ountid=188395
I, M., S, M.-C., V, A., P, B., & A, R. T. (2013). Assessment
of Industrial Cluster with Value-Chain DEA model.
European Journal Of Operational Research, 1(1), 43–
48.
Ibef. (2014). Oil & Gas. Retrieved from www.ibef.org
Johnson & Johnson. (2018). Enterprise Risk Management
Framework. Retrieved from
https://www.jnj.com/application/pdf:
92/01/4efd5ba54bc09c6eb227db00da8a/jnj-erm-
framework-2018-update.pdf
Jurevicius, O. (2013). Value Chain Analysis | Strategic
Management Insight. Retrieved from Strategic
Management Insights website:
https://www.strategicmanagementinsight.com/tools/va
lue-chain-analysis.html
MOGA. (2018). Oil & Gas Value Chains. Retrieved from
p://moga.saoga.org.za/resources/oil-gas-value-chains
Mooney, C. L. (2014). 5 reasons CR professionals need a
value chain map. Retrieved June 25, 2019, from
https://www.greenbiz.com/blog/2014/01/09/5-reasons-
cr-professionals-need-value-chain-map
OECD. (2016). Corruption in the Extractive Value Chain -
Typology of Risks, Mitigation Measures and
Incentives. The Report, Secretary-General of the
OECD 2016.
Olesen, T. (2016). Offshore Supply Industry Dynamics.
Retrieved from www.cbs.dk/maritime
Pagach, D. P., & Warr, R. S. (2011). The Effects of
Enterprise Risk Management on Firm Performance.
SSRN Electronic Journal.
https://doi.org/10.2139/ssrn.1155218
Permen ESDM RI No. 52. (2018). Peraturan Menteri
Energi Dan Sumber Daya Mineral Republik Indonesia,
Nomor 52 Tahun 2018 Tentang Perubahan Atas
Peraturan Menteri Energi Dan Sumber Daya Mineral
Nomor 29 Tahun 2017 Tentang Perizinan Pada
Kegiatan Usaha Minyak dan Gas Bumi.
Permen ESDM RI No. 59. (2007). Peraturan Menteri
Energi Dan Sumber Daya Mineral Republik Indonesia,
Nomor 17 Tahun2017 Tentang Organisasi dan Tata
Kerja Satuan Kerja Khusus Pelaksana Kegiatan Usaha
Hulu Minyak dan Gas Bumi.
Porter, M. E. (1985). Competitive Strategy: Creating and
Sustaining Superior Performance. In Creating and
Sustaining Competitive Advantage.
https://doi.org/10.1007/978-3-319-54540-0
PP RI No. 59. (2007). Peraturan Pemerintah Republik
Indonesia, Nomor 59 Tahun 2007, Tentang Kegiatan
Usaha Panas Bumi.
Pujawan, I. N., & Geraldin, L. H. (2009). House of risk: A
model for proactive supply chain risk management.
Business Process Management Journal.
https://doi.org/10.1108/14637150911003801
Putra, I. S., & Adinugraha, D. (2018). Factors Affecting
Efficiency of Oil and Gas Companies in Indonesia Two
Stage DEA Analysis. Proceedings of the DEA40:
International Conference of Data Envelopment
Analysis, 93–100. Aston Business School.
Quon, T. K., Zéghal, D., & Maingot, M. (2012). Enterprise
risk management and business performance during the
financial and economic crises. Problems and
Perspectives in Management.
Reese, J., Waage, M., Gerwin, K., & Koch, S. (2016). Value
Chain Analysis: Conceptual Framework and
Simulation Experiments. Nomos Verlagsgesellschaft.
Shqairat, A., & Sundarakani, B. (2018). An empirical study
of oil and gas value chain agility in the UAE.
Benchmarking. https://doi.org/10.1108/BIJ-05-2017-
0090
SKK Migas. (2013). Pedoma Tata Kerja, Nomor: PTK-
053/SKO0000/2013/S0, Tentang Pengelolaan
Teknologi Informasi Komunikasi pada Kontraktor
Kontrak Kerja Sama (KKKS).
SKK Migas. (2017). Pedoma Tata Kerja, Nomor: PTK-
063/SKKMA0000/2017/S0, Tentang Financial Budget
and Reporting Manual of Production Sharing Contract
dan Chart of Account.
SKK Migas. (2018). Surat Keputusan Nomor:KEP-
0078/SKKMA0000/2018/S0 Tentang Proses Bisnis
SKK Migas.
SKK Migas. (2019). Pedoman Tata Kerja, Nomor: PTK-
066/SKKMA0000/2019/S0, Tentang Penyusunan Dan
Innovation in Corruption Risk Mapping using a Value Chain Map and Its Application in the Upstream Oil and Gas Industry in Indonesia
301

Pelaporan Kegiatan Usaha Hulu Minyak Dan Gas Bumi
Dengan Skema Gross Split.
UNCTAD. (2012). Extractive Industries: Optimizing Value
Retention in Host Countries. UNCTAD XIII, Qatar
2012.
Undang-Undang RI No. 22. (2011). Undang-Undang
Republik Indonesia, Nomor 22 Tahun 2001 Tentang
Minyak dan Gas Bumi.
ICOACI 2019 - International Conference on Anti-Corruption and Integrity
302
