
Technology Acceptance Model for Digital Marketing Analysis
Emy Susanti
1
and Femi Dwi Astuti
2
1
Information System, STMIK AKAKOM, Yogyakarta, Indonesia
2
Informatics Engineering, STMIK AKAKOM, Yogyakarta, Indonesia
Keywords:
Analysis, Digital Marketing, Home Industry, TAM, Bantul.
Abstract:
Business people in society consist of many components, one of which is a small industry or a home industry.
This home industry really needs the support of many parties to be able to play a role in increasing the level of
the economy and people’s welfare. Home industries that are classified as small and medium-sized businesses
in the Bantul Region of Yogyakarta can experience an increase of 8Technology Acceptance Model (TAM) is
an acceptable model for predicting acceptance of a new technology. This model will illustrate that there are
a number of factors that influence the user’s decision to use digital marketing. The results obtained from this
study are that the perception of the home industry community in Bantul on digital marketing that is PEU has
a positive effect on ATU, PU has a positive effect on ATU, PEU has a positive effect on AU, PU has a positive
effect on AU, ATU has a positive effect on AU. In general, it can be concluded that the perception of ease
and usefulness of digital marketing will influence the belief in the use of digital marketing and will affect the
attitude and actual use.
1 INTRODUCTION
The development of technology which is rapidly in-
creasing now and reaching all fields of life indirectly
has changed the pattern of human life. The conven-
tional method used has shifted to digital activities.
One area of life that is inseparable from that is the
field of economics or rather in the field of business.
Economic activities in the business sector that were
previously carried out conventionally have shifted to
use digital systems. Part of business activities in-
clude the marketing process or marketing which in-
cludes promotional activities. This era of inevitable
digitalization requires business people to keep abreast
of developments in order to win the market. Promo-
tional activities that use digital systems are known as
digital marketing which includes promotional activi-
ties including SEO (Search Engine Optimization), on-
line advertising (FB ads, Adwords, etc.), television
& radio advertisements, electronic billboards (video
tron), email marketing Mobile marketing and others.
The emergence of digital marketing in the small and
medium industry sector today has given a change in
the habits of its activities. One of the habitual shifts
in promotional activities that were previously carried
out conventionally today is not a few who use digital
marketing. The development of technology is realized
for some people who have provided a lot of positive
support for their business.
The use of information technology in the form of
digital marketing has been widely used by the home
industry community in Bantul district which is felt to
be quite helpful and contributing positively. However,
not all of them use the technology support, so it needs
to be analyzed using TAM (Technology Acceptance
Model) to determine the acceptance of the industrial
community in Bantul district for digital marketing as
a promotional strategy. From the results of the anal-
ysis will provide information about the acceptance of
the creative industry community in the home industry
about the use of digital marketing so that it can pro-
vide the support needed to be able to use technology
better and get optimal results.
2 RELATED WORKS
Some previous studies used as references in the field
of Technology Acceptance Model (TAM) analysis
for Digital Marketing include (Darpito, 2015) (Pradi-
ani, 2017) (Pertawijaya and Sharif, 2015)(Surendran,
2012) analyzed the effect of the Technology Accep-
tance Model on the purchase of furniture and handi-
craft products of SMEs through Online Media in Yo-
Susanti, E. and Astuti, F.
Technology Acceptance Model for Digital Marketing Analysis.
DOI: 10.5220/0009433700850091
In Proceedings of the International Conferences on Information System and Technology (CONRIST 2019), pages 85-91
ISBN: 978-989-758-453-4
Copyright
c
2020 by SCITEPRESS – Science and Technology Publications, Lda. All rights reserved
85
gyakarta. The results showed that the variables in
TAM were able to influence consumer satisfaction but
did not affect consumer purchase intentions to shop
online. Consumer spending intentions are more in-
fluenced by social factors, namely friends, family and
the environment. The use of the TAM method has
also been carried out by (Hanggono, 2015). The re-
search carried out is to analyze the practice of TAM
in supporting online businesses by utilizing Instagram
social networks. The results show the perceived ease
of use variable has a significant positive effect on per-
ceived usefulness and attitude of use. the variable at-
titude of use has a positive influence on behavior to
use, the variable behavior of using has a significant
effect on the real condition of the use of the system
with a calculated value of 14,829 at sig.t of 0,000.
(Pradiani, 2017) analyzes the effect of digital market-
ing marketing systems on increasing sales volume of
home industry products. The results showed that digi-
tal marketing was seen as the best medium as the most
effective and efficient means of promotion and was
able to significantly increase sales volume from net
income per month from 1 - 1.5 million rupiah to 3 -
3.5 million rupiah. The Comparative Analysis of Mo-
bile TAM was also carried out on the T-Money and
Mandiri E-Cashtelecommunications applications by
(Pertawijaya and Sharif, 2015). The purpose of this
study is to determine and compare user acceptance
of the variables in TAM. The results showed that all
TAM variables were in the good and very good cate-
gories. There are differences in user acceptance of the
construct variables of the mobile technology accep-
tance model. In addition to Pertawijaya, research on
the TAM model has been conducted by (Surendran,
2012). The study discusses how the technology Ac-
ceptance Model works and the different factors that
exist in the TAM model. The results also reveal var-
ious changes that have been made by several other
researchers to the TAM model.
3 LITERATURE REVIEW
3.1 Technology Acceptance Model
(TAM)
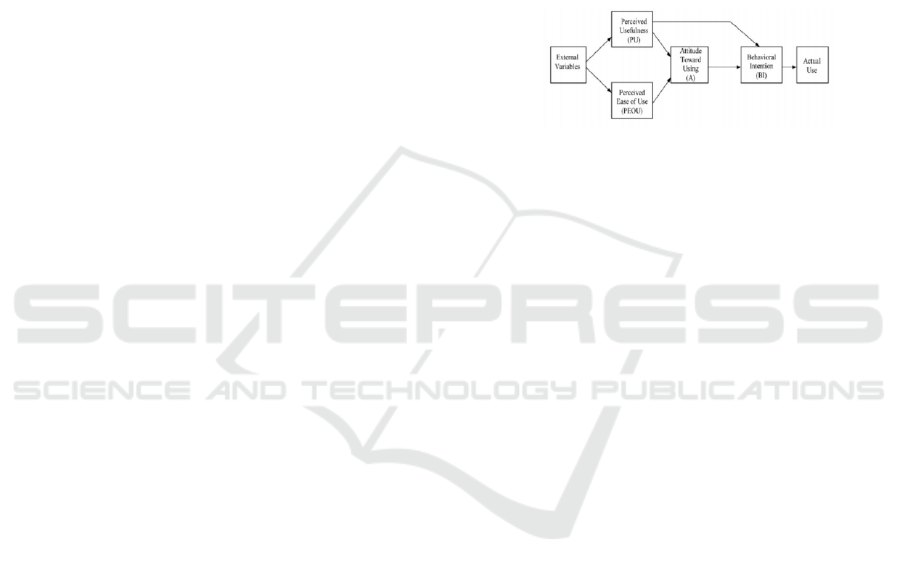
The Technology Acceptance Model (TAM) intro-
duced by Davis in 1989 is one of the evaluation mod-
els of technological success seen from the use of tech-
nology. This model will give an illustration that there
are a number of factors that influence the user’s deci-
sion to use new technology, namely benefits and con-
venience. Usability shows the user’s confidence in
the contribution of technology to the performance of
technology users. While convenience shows the level
where the user believes that the use of new technol-
ogy is easy and does not require a lot of effort. This
concept includes the clarity of the purpose of using
technology and the ease of use of the system for pur-
poses in accordance with the wishes of the user so that
if the system is easy to use, then the user will tend to
use the technology. The model of the relationship of
factors that influence acceptance in TAM can be seen
in Figure 1.
Figure 1: Technology Acceptance Model Dimen-
sions(Davis, 1984)
Reactions and perceptions of users of Information
technology (IT) will affect their attitude in acceptance
of the technology. One of the factors that can influ-
ence it is the user’s perception of the usefulness and
ease of use of IT as a reasonable action in the context
of technology users, so that the reason someone sees
the benefits and ease of use of IT makes the person’s
actions / behavior as a benchmark in the acceptance
of a technology. The TAM model, developed from
psychological theories, explains the behavior of com-
puter users that is based on beliefs, attitudes, desires,
and user behavior relationships. The purpose of this
model is to explain the main factors of user behav-
ior towards user acceptance of technology. In more
detail, it explains about the acceptance of IT with cer-
tain dimensions which can affect the acceptance of IT
by users. This model places the attitude factor of each
user’s behavior with two variables, namely: 1. Ease
of use , 2. Usefulness.
Both of these variables can explain aspects of user
behavior, the conclusion is the TAM model can ex-
plain that the user’s perception will determine his at-
titude in the use of IT. This model more clearly illus-
trates that the acceptance of IT use is influenced by
usefulness and ease of use. The construct has been
modified from the previous TAM research model,
namely: Perceived Ease of Use, Perceived Useful-
ness, Attitude Toward Using, Behavioral Intention To
Use, and Behavioral Intention To Use real conditions
of system usage (Actual System Usage).
CONRIST 2019 - International Conferences on Information System and Technology
86

3.2 Steps to the TAM Method
3.2.1 Exogenous Constructs
This construct is known as sources variables or in-
dependent variables that are not predicted by other
variables in the model. Exogenous constructs in-
clude Perceived Ease of Use (PEOU), which is a level
where someone believes that a technology can be eas-
ily used.
3.2.2 Endogenous Constructions
the factors predicted by one or several constructs.
Endogenous constructs can predict one or several
other endogenous constructs, but endogenous con-
structs can only be causally related to endogenous
constructs. Endogenous constructs include Perceived
Usefulness (PU), Attitude Toward Using (ATU), Be-
havioral Intention To Use (ITU) and Actual System
Usage (ASU).
3.2.3 Structural Equations
From the existing constructs we will get structural
equations that will form the model, examples like the
following:
PU = y11PEOU + c1 (1)
ATU = y21PEOU + β21PU + c2 (2)
ITU = β32ATU + β31PU + c3 (3)
ASU = β43ITU + c4 (4)
3.3 Digital Marketing
Digital Marketing has changed the way humans com-
municate, act and make decisions. Marketing activ-
ities are also not free from the influence of digital
technology. The term digital-based marketing (digital
marketing) has evolved from initially marketing ac-
tivities of goods and services using digital channels
to a broader understanding of the process of gain-
ing consumers, building consumer preferences, pro-
moting brands, maintaining consumers, and increas-
ing sales. The concept of digital marketing comes
from the internet and search engines (search engines)
on the site. When the use of the internet exploded
in 2001, the market was dominated by Google and
Yahoo as search engine optimization (SEO). The use
of internet search grew in 2006 and in 2007 the use
of mobile devices increased dramatically which also
increased the use of the internet and people from all
over the world began to relate to each other through
social media (Khan and Siddiqui, 2013). The defi-
nition of digital marketing according to the Ameri-
can Marketing Association (AMA) is an activity, in-
stitution, and process facilitated by digital technology
in creating, communicating, and conveying values to
consumers and other interested parties (Kannan et al.,
2017). Digital marketing is also defined as marketing
activities that use internet-based media (Wardhana,
2015).
3.4 Home Industry
Home industry or home industry is a business oppor-
tunity that is starting to emerge in the current era be-
cause of the increasingly limited available employ-
ment. This kind of industry can be managed inside
the house so that it can be monitored at any time. This
kind of small business is managed by people who are
related. The capital needed for this business is small
and the tools used are manual.
4 RESEARCH METHODOLOGY
The stages that will be carried out in this study are:
4.1 Literature Study
Study reference books or sources relating to the anal-
ysis of the use of digital marketing in the home in-
dustry community in the Bantul region of Yogyakarta
using the TAM method
4.2 Data Analysis
Analyzing the theories and methodologies and tech-
niques used to analyze the use of digital marketing in
the home industry community in the Bantul region of
Yogyakarta using the TAM method.
4.3 Implementation of Theory and
Methodology
Implement theories and methodologies for analyzing
the use of digital marketing in home industry commu-
nities in the Bantul region of Yogyakarta.
4.4 Location of Research Population
The location of this research was conducted in Ban-
tul Regency, Yogyakarta. Respondents who partic-
Technology Acceptance Model for Digital Marketing Analysis
87

ipated in this study were home industry communi-
ties in the Bantul region. Bantul is part of the Yo-
gyakarta Special Region with the southern border of
DIY as a district. With demographic conditions that
support the tourism sector, it will grow the economy
of the people in Bantul through small and medium
industries. Based on information from the Bantul dis-
trict statistics agency that economic growth in 2017 of
4.52% was supported by the creative industry sector
including small and medium industries. Bantul has
great potential in the creative industry sector includ-
ing fashion, design, crafts, culinary, computer and
software services, music and performing arts. Based
on data available in Bantul for the medium industry
as a whole, 1,723,634 industries are scattered in 16
sub-districts and consist of various types of industries
such as the food industry, the clothing and leather in-
dustry, the chemical and building materials industry,
the metal and electronics industry, the handicraft in-
dustry. The population in this study is the home in-
dustry community for the creative industries in Ban-
tul district with random locations. The sample will be
determined by purposive sampling technique, which
is the technique of determining the sample based on
certain considerations. Samples taken were 100 re-
spondents.
4.5 Variables Studied and Operational
Variables
In this study, the TAM model was chosen as a theo-
retical basis that has a strong ability to explain the use
of technology by users (Davis, 1989). This study uses
4 (four) variables which are modified from the previ-
ous TAM research model, namely: Perceived of use,
Perceived Usefulness, Attitude toward Usage, Actual
Usage. Where according to the theory of TAM signif-
icantly ease and usefulness variables affect user ac-
ceptance in using digital marketing. The instrument
used to measure the variables of this study is an in-
strument that has been used in previous studies, mak-
ing it possible to increase the validity and reliability
of measurements. The measurement of each variable
uses a Likert scale of 1 to 5, each of which has the
following meanings: 1 = strongly disagree (STS), 2
= disagree (TS), 3 = neutral (N), 4 = agree (S ), 5 =
strongly agree (SS).
4.6 Data Collection Methods
In this study using hypothesis testing research,
namely building hypotheses on the basis of relevant
theory and research. Data obtained by distributing
questionnaires to selected respondents. The main pur-
pose of a study is to answer the questions dani hypoth-
esis.
4.7 Data Analysis Techniques
Data Analysis Techniques The data collected was an-
alyzed by means of the correlation analysis and re-
gression assistance of the SPSS program. The re-
sults of the analysis will be in the form of descriptive
statistics, data quality tests, classic assumption tests,
regression analysis and hypothesis testing. The re-
search data were analyzed with the following statisti-
cal tools:
1. Descriptive statistics
2. Data Quality Test
3. Classic assumption test
4. Normality test
5. Heterokedasticity Test
6. Autocorrelation Test
4.8 Analysis Techniques for Hypothesis
Testing
The analysis technique used is the Absolute Differ-
ence Test. This test is carried out because according
to Furcot and Shearon (in Ghozali 2006) this kind of
interaction is preferred because previous expectations
relate to the combination of X1 and X2 and affect Y.
The Regression Equation used is shown in equation
1:
Y = a + b1X1 + b2X 2 + b3X1 −X2 + e (5)
Information :
a: Constants
Y: Individual performance
X1: Usefullness of Technology
X2: Ease of Use
b1-2-3: Regression coefficient
e: error
H1 and H2 were tested by comparing the level of
significance of t with 0.05 ( ´a = 5%). If the signifi-
cance level t = 0.05, the hypothesis is accepted. This
means that the ease and usefulness of digital mar-
keting has a significant effect on acceptance and H2,
namely the ease of use as a moderating variable has
a significant effect on the relationship between digital
marketing utilization with the attitude and sincerity to
use it.
CONRIST 2019 - International Conferences on Information System and Technology
88
5 RESULT AND DISCUSSION
Characteristics of respondents used are seen from
gender, age, last education, type of industry, location
of industry, know digital marketing, digital marketing
media used.
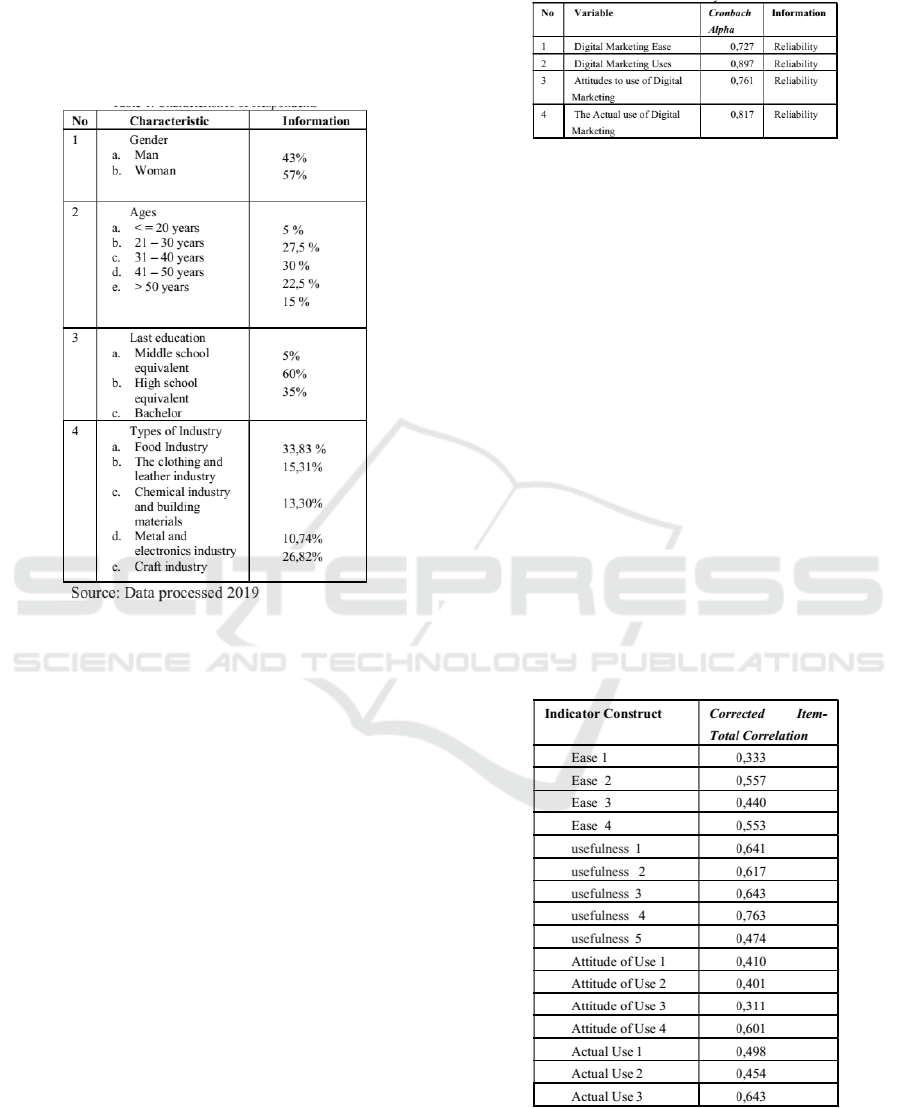
Figure 2: Characteristics of Respondents.
Based on information obtained for Figure 2 re-
garding respondent respondents for home industry
business is as follows: from gender, it is estimated
that women for home business is 57%, this is because
there are more women than women in Bantul based
on statistical data available in in 2018. Based on
age the largest percentage of industrial houses is ob-
tained at the age of 31-40 years which is 30%, this is
the productive age. Then based on educational back-
ground the largest percentage in high school educa-
tion is equal, and the type of industry that has the
largest percentage of food industry is 33.83the next
handicraft industry is 26.82%. From this informa-
tion technology is needed in business activities in the
home industry such as digital marketing that will help
improve industrial business progress.
Data quality resulting from the use of research in-
struments can be evaluated through reliability and va-
lidity tests. Each test is to determine the consistency
and accuracy of data collected from the use of the in-
strument. To measure reliability with Cronbach Al-
pha statistical tests. A construct or variable is said to
be reliable if it gives a Cronbach alpha value> 0.60.
Following are the results of the reliability test
shown in Figure 3.
space
Figure 3: Reliability Test.
Validity test is used to measure the validity or va-
lidity of a questionnaire. A questionnaire is said to be
valid if the questions on the questionnaire are able to
reveal something that will be measured by the ques-
tionnaire. According to Ghozali (2006) to measure
validity can be done by correlating the score of ques-
tions with the total construct score or variable. Signif-
icance test is done by comparing the value of r arith-
metic with r table for degree of freedom (df) = n - 2,
in this case n is the number of samples. In this study
the number of samples (n) = 100 and the magnitude
of df can be calculated 100 - 2 = 98, with df = 98
and alpha = 0.05, obtained r table = 0.1966. To test
whether each indicator is valid or not can be seen in
the Cronbach Alpha output display in the Correlated
Item - Total Correlation column both in the construct
of ease, utilization, attitude of use, actual use of dig-
ital marketing. Then the value of Correlated Item -
Total Correlation compared with the results of the cal-
culation of r table = 0.1966, if r arithmetic > r table
and is positive then the item or question is declared
valid.
Figure 4: Correlation.
From Figure 4 it can be seen that the value of r
calculated Corrected Item-Total Correlation for con-
struct indicators of digital marketing ease, usefulness,
Technology Acceptance Model for Digital Marketing Analysis
89
attitude of use and actual use of digital marketing >
from r table 0.1966. So it can be concluded that all
construct indicators are valid.
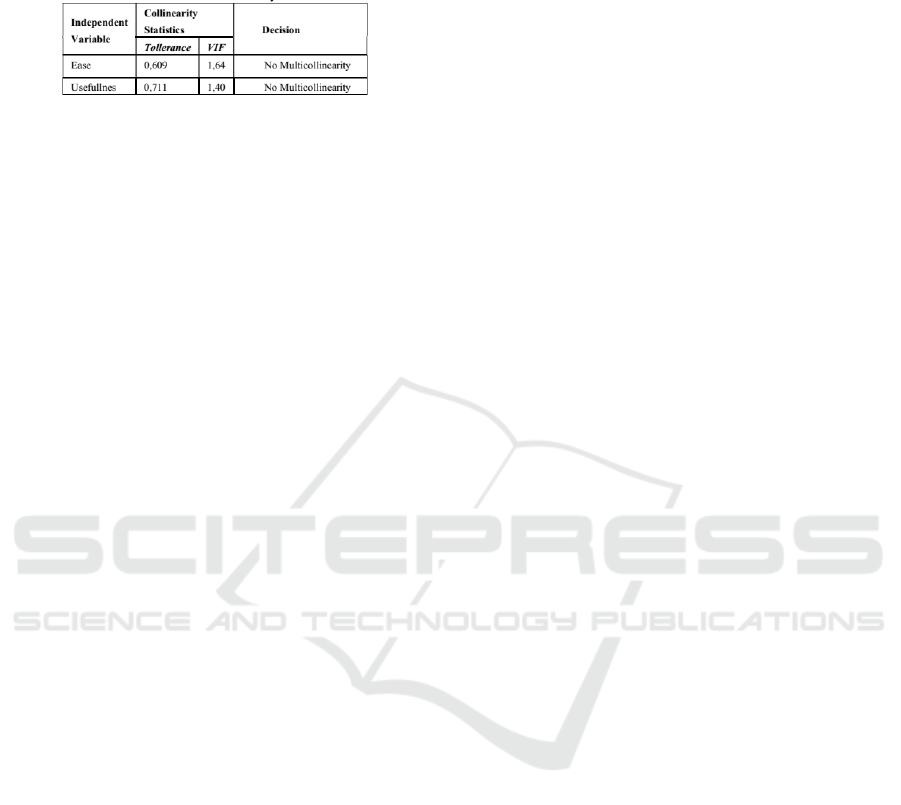
Figure 5: Multicollinearity Test.
Based on Figure 5, the results of the calculation
of the tollerance value shows that there are no inde-
pendent variables that have a tollerance of less than
0.10, which means there is no correlation between the
independent variables whose value is more than 95%.
The results of the calculation of the Variance Infla-
tion Factor (VIF) value also showed the same thing:
there was not one independent variable that had a VIF
value of more than 10. So it can be concluded that
there was no multicollinearity between the indepen-
dent variables in the regression model.
5.1 Hypothesis Testing Results
Based on multiple linear regression analysis the fol-
lowing results are obtained:
1. Hypothesis 1 PEU (Ease / Perceived of Use)
against ATU (Attitude toward Usage / Attitude in
the Use of IT), obtained the results of the two
sided t test significance level of 0.01 less than 0.05
of this positive regression coefficient of 0.39 indi-
cates hypothesis 1 is accepted, meaning that PEU
has a positive effect on ATU or if the user’s per-
ception of the ease of digital marketing will form
the more confident the user is to use digital mar-
keting in the home industry in Bantul region.
2. Hypothesis 2 PU (Benefit / Perceived Usefulness)
against ATU (Attitude toward Usage / Attitude in
the Use of IT), the results obtained by the t-level
significance of two-sided test by 0.01 less than
0.05 positive regression coefficient 0.492 shows
hypothesis 1 accepted, it means PU has a positive
effect on ATU or if the user’s perception of the
ease of digital marketing will be more confident
the user will be formed to use digital marketing in
the home industry in Bantul region.
3. Hypothesis 3: PEU (Ease / Perceived of Use)
against AU (Actual Usage / actual use of IT), the
significance of the two-tailed t-test level of 0.01 is
less than 0.05, the positive regression coefficient
of 0.24 shows the hypothesis 1 is accepted, mean-
ing that PEU has a positive effect on the AU or if
the user’s perception of the ease of digital market-
ing will be more confident the user will be formed
to use digital marketing in the home industry in
Bantul region.
4. Hypothesis 4, PU (Perceived Usefulness) against
AU (Actual Usage / IT use actually), the results
obtained by the t-level significance of two-sided
test of 0.01 is smaller than 0.05 positive regres-
sion coefficient of 0.17 shows the hypothesis 1 is
accepted, meaning PU has a positive effect on the
AU or if the user’s perception of the ease of digi-
tal marketing will be more confident the user will
be formed to use digital marketing in the home
industry in Bantul region.
5. Hypothesis 5, ATU (Attitude toward Usage / Ac-
tions in the Use of IT) against AU (Actual Usage
/ actual use of IT) obtained the results of the t-
test two-sided significance level of 0.01 smaller
than 0.05 positive regression coefficient of 0.11
this shows that hypothesis 1 is accepted, meaning
that ATU has a positive effect on the AU or if the
user’s perception of the ease of digital marketing
will create more confidence for users to use digital
marketing in the home industry in Bantul region.
6 CONCLUSIONS
The conclusion obtained from this study is that the
perception of the home industry community in Bantul
on digital marketing that is PEU has a positive effect
on ATU, PU has a positive effect on ATU, PEU has a
positive effect on AU, PU has a positive effect on AU,
ATU has a positive effect on AU. In general, it can be
concluded that the perception of ease and usefulness
of digital marketing will affect the belief in the use
of digital marketing and will affect the attitude and
actual use.
For the next research, another method for analysis
can be used as a comparison in the process of accep-
tance analysis of technology, and can be developed to
analyze the results of the achievement of the use of
digital marketing, tools can be made as an analysis of
acceptance of new technologies.
ACKNOWLEDGEMENTS
The authors would like to thank LLDIKTI Region V
Yogyakarta, and STMIK AKAKOM Yogyakarta for
their support of this research.
CONRIST 2019 - International Conferences on Information System and Technology
90

REFERENCES
Darpito, S. H. (2015). Pengaruh technology acceptance
model terhadap pembelian furniture dan handycrat
produk ukm melalui media online di yogyakarta. Jur-
nal Ilmu Komunikasi, 13(2).
Davis, G. B. (1984). Sistem informasi manajemen. PT Pus-
taka Binaman Pressindo Jakarta.
Hanggono, A. A. (2015). Analisis atas praktek tam (tech-
nology acceptance model) dalam mendukung bisnis
online dengan memanfaatkan jejaring sosial insta-
gram. Jurnal Administrasi Bisnis, 26(1).
Kannan, P. et al. (2017). Digital marketing: A framework,
review and research agenda. International Journal of
Research in Marketing, 34(1):22–45.
Khan, F. and Siddiqui, K. (2013). The importance of digital
marketing. an exploratory study to find the perception
and effectiveness of digital marketing amongst the
marketing professionals in pakistan. Journal of Infor-
mation Systems & Operations Management, page 1.
Pertawijaya, I. and Sharif, O. O. (2015). Analisis kompara-
tif mobile technology acceptance model pada aplikasi
telkom t-money dan mandiri e-cash. eProceedings of
Management, 2(2).
Pradiani, T. (2017). Pengaruh sistem pemasaran digital mar-
keting terhadap peningkatan volume penjualan hasil
industri rumahan. Jurnal Ilmiah Bisnis dan Ekonomi
Asia, 11(2):46–53.
Surendran, P. (2012). Technology acceptance model: A sur-
vey of literature. International Journal of Business
and Social Research (IJBSR), 2(4):175–178.
Wardhana, A. (2015). Strategi digital marketing dan imp-
likasinya pada keunggulan bersaing ukm di indonesia.
In Seminar Keuangan dan Bisnis IV UPI.
Technology Acceptance Model for Digital Marketing Analysis
91
