
Lean Implementation on Production Process and Maintenance
Practice for Productivity Improvement
Nani Kurniati, Dewanti Anggrahini, Dwi Kusumaningrum, and Pantoki Ilham
Department of Industrial Engineering, Institut Teknologi Sepuluh Nopember, ITS, Surabaya, Indonesia
Keywords: Lean manufacturing, lean maintenance, manufacturing lead time, operation process chart
Abstract: Lean concept has been discussed extensively across many industries. As its approach to ensure overall
performance by a focus on delivering customer's expected value. Any activities within industries that don't
contribute to value the end product will consider as waste and need to be eliminated. The lean idea for the
Bogie production process useful to identify the potential improvement in production performance in terms of
manufacturing lead time (MLT) or cycle time. Carefully analyze the cause of waste may guide to address the
root cause. One of them is a maintenance problem. Therefore, the continuing lean implementation of
maintenance activities may lead to solving another root cause. It successfully showed the potential escalation
on MLT, about 20% reduced by considering the manufacturing waste. Further advantage and benefit may
gain more due to lean maintenance implementation, albeit the exact improve performance still need to be
detailed quantified.
1 INTRODUCTION
Lean concepts firstly proposed by Taichi Ohno in the
late 1940s. Toyota Production System showed
significant achievement in several areas, including
productivity and efficiency, as well as production
cycle time. The lean implementation relies on five
basic principles. Firstly, value identification defined
by the customers' expectations about the end product.
Second, mapping the process workflow within the
company involved in delivering the end product. It
will identify in what process the value has been
generated, include the proportion of processes that do
not cause to value. Third, disperse work into smaller
batches and visualizing the workflow, to ensure
continuous workflow and easily identify the possible
bottleneck and interruption. Fourth, establish a pull
system means optimizing the production capacity and
delivering a product based on actual demand,
ensuring no waste on resources. The last, encourage
all components of the company actively involved in
creating the continuous improvement program.
Bogie production consists of many processes. The
current situation detected in the shop floor was lack
of documentation both in production/machine
capability, workforce capacity, and many outcome
measurements include cycle time and production rate,
which is very important for providing the baseline
performance and detecting any obstacles. This
condition may cause any difficulty in addressing the
improvement program on production capability.
Bogie product of the company being studied is a
chassis or framework that carries a wheelset, and this
is a modular subassembly of wheels and axis that
attached to a train. At least two bogies need to be
assembled beneath the train. Moreover, the company
instructs to increase the capability of producing the
bogie to reduce the tardiness of product completion
and shipment, as well as to reduce the number of
rework products. Another issue identified in the
company related to maintenance activities that
responsible for restoring any machine failure back
into operation state. It triggered by the high frequency
of machine failure that causes corrective maintenance
instead of a preventive one. Downtime may effect
reducing availability and high inventory work in the
process. In the end, the same problems reveal in
reducing the number of Bogie production.
Therefore, this paper attempts to capture the
current production process to identify potential
improvement by reducing or eliminating the seven
waste on Bogie production. The lean approach has
been chosen to be implemented both in the production
process and maintenance activities, as the benefit of
the promise of lean implementation has reported
144
Kurniati, N., Anggrahini, D., Kusumaningrum, D. and Ilham, P.
Lean Implementation on Production Process and Maintenance Practice for Productivity Improvement.
DOI: 10.5220/0009424301440149
In Proceedings of the 1st International Conference on Industrial Technology (ICONIT 2019), pages 144-149
ISBN: 978-989-758-434-3
Copyright
c
2020 by SCITEPRESS – Science and Technology Publications, Lda. All rights reserved
(Rohani and Zahraee, 2015; Madaniyah and Singgih,
2017). The combined lean implementation both on
production and maintenance at the same shop floor to
be expected can double the benefit and advantage of
lean. Some tools employed include Value Stream
Mapping (VSM), Operation Process Chart (OPC),
and Cause Analysis (CA).
2 RESEARCH METHODOLOGY
The lean implementation on the production process
called lean manufacturing, while implemented on
maintenance practice, becomes lean maintenance.
The steps taken were accommodating the five basic
principles of lean. Initially, the production process
needs to be clearly identified using Operation Process
Chart (OPC).
Value Stream Mapping (VSM) used to visualize
the information and material flow within a process,
followed by identifying the appropriate waste i.e.,
seven waste for lean manufacturing, eight waste for
lean maintenance. The third step is flowed the value
by mapping all the activities into three categories:
value-added activity (VA), non-value added an
activity (NVA), and necessary but non-value added
activity (NNVA).
The pull system brings to evaluate several
performance measurements i.e., manufacturing lead
time (MLT) for production and overall equipment
effectiveness (OEE) for maintenance. The final step
is continuous improvement by eliminating the waste
by audit, standardization, and identify the cause of
waste.
3 LEAN FOR BOGIE
PRODUCTION
There are 25 process routing in order to produce one
unit of bogie (called bogie set), that consists of two
bolsters and four side frame.
3.1 OPC and VSM of Bogie Production
The routing processes and its cycle time is provided
in Table 1.
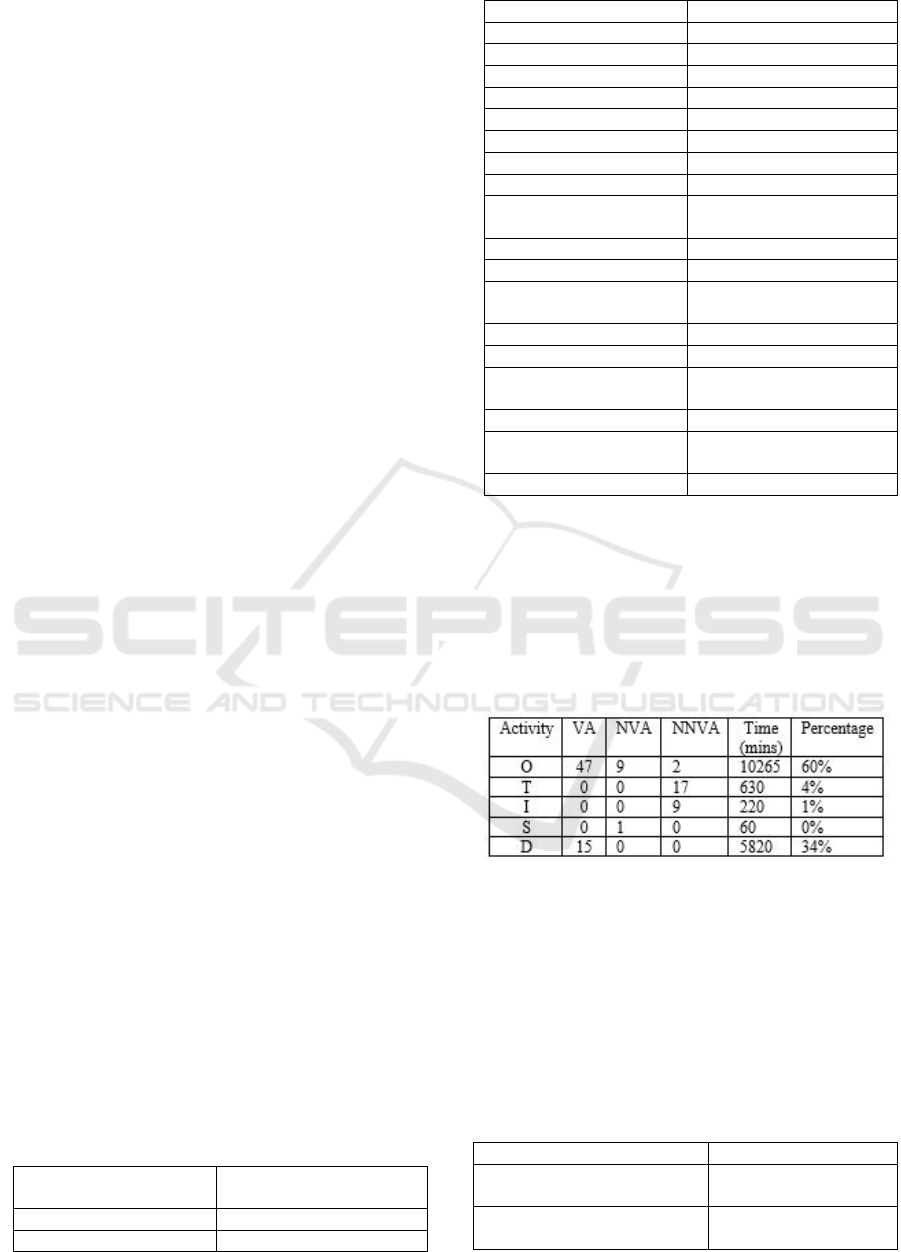
Table 1: Process routing and its cycle time.
Process Cycle time (mins of
p
roducin
g
30
p
roduct
)
Core making 420
Mold making 240
Core settin
g
210
Melting 525
Pouring 80
Shake out 210
Cuttin
g
300
Swin
g
g
rindin
g
675
Hand grinding 600
MPI 1 150
Welding repair 1 640
Heat treatment
(normalizing)
505
Shot blast 285
Machinin
g
320
Finishing & gage
inspection
500
MPI 2 150
Weldin
g
re
p
air 2 245
Final inspection
(internal)
30
Assembly 180
Final inspection
(external)
240
Packaging 210
All the processes above done serially except the
first three processes conducted in parallel at the same
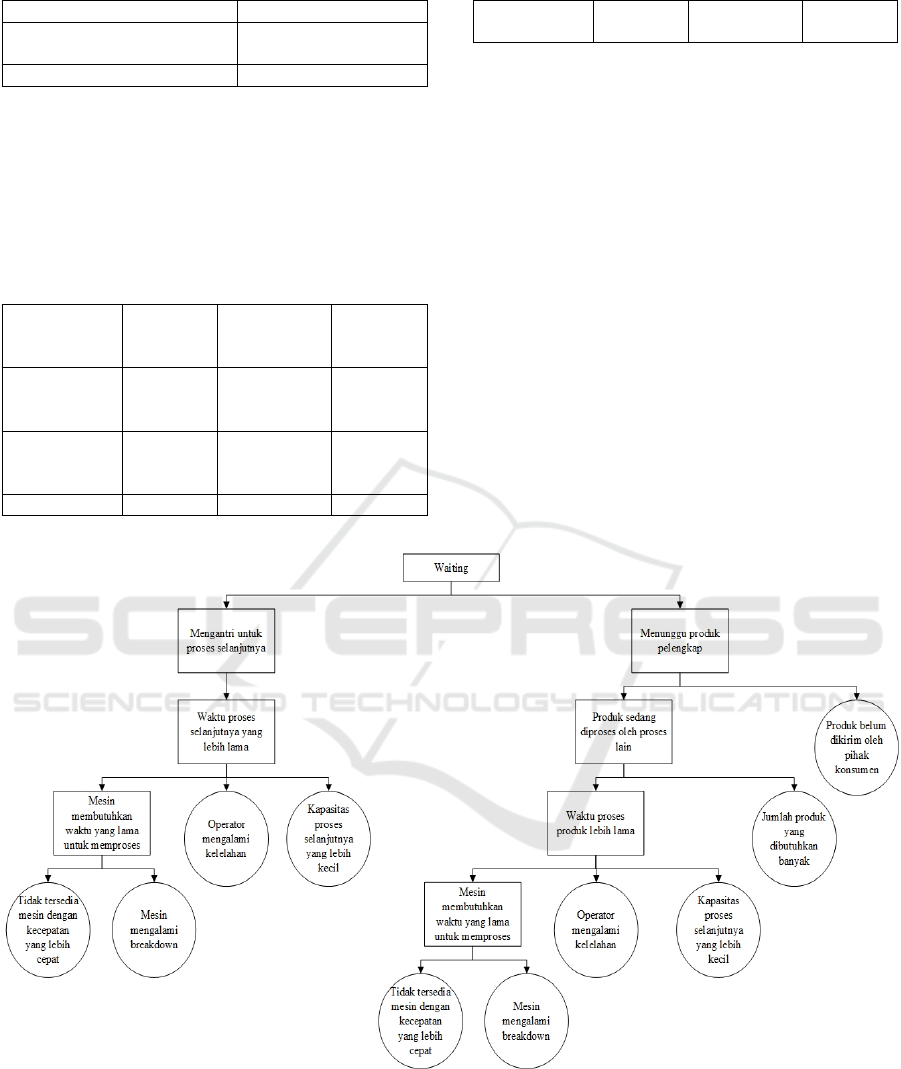
time. By categorize the activities during VSM into O
(operation), T (transportation), S (storage), dan D
(delay), the distribution of their VA, NVA, NNVA
frequencies are provided in Table 2.
Table 2: Process activity mapping.
The calculated MLT for bogie production is total
cycle time + transportation time = 675 mins + 20 mins
= 695 mins, or 208 hours, or 8,6 days.
3.2 Waste Identification in Bogie
Production
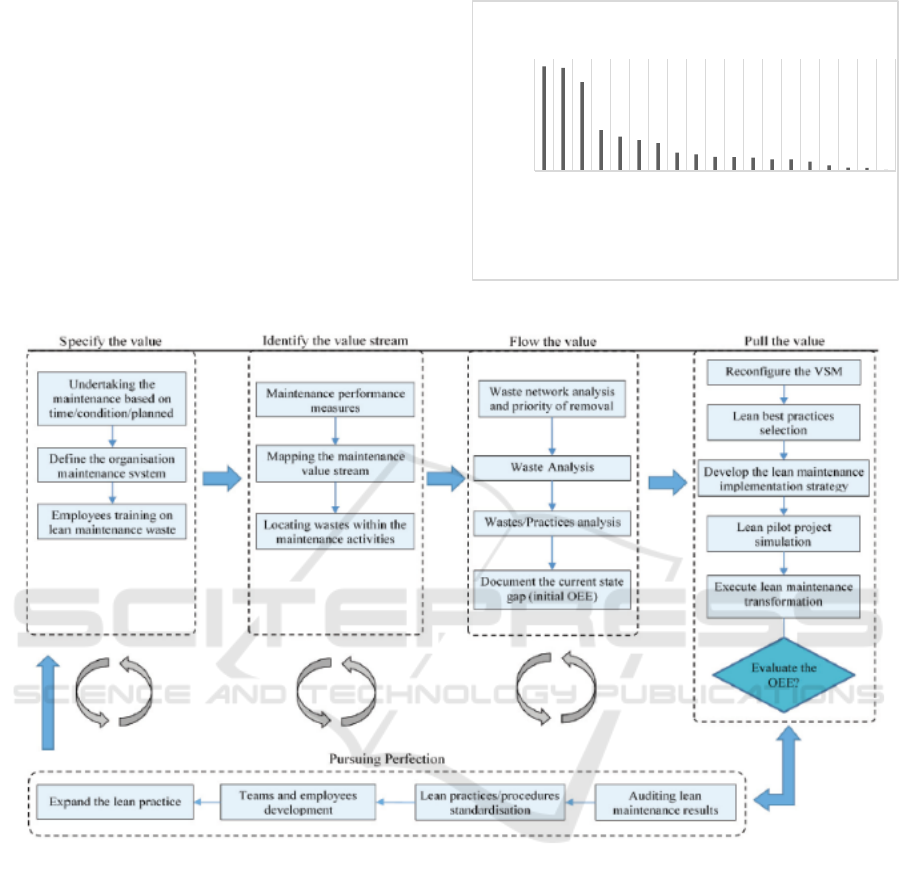
There is critical waste includes waiting and inventory.
The waiting data is given in Table 3 as follow:
Table 3: Process activity mapping.
Waitin
g
Time
(
mins
)
Waiting in mold making
q
ueue
180
Mold making wait core
making
180
Lean Implementation on Production Process and Maintenance Practice for Productivity Improvement
145
Meltin
g
wait core settin
g
315
Waiting for pouring until
p
acka
g
in
g
645
Total waitin
g
1320
Total waiting is 22 hours or 0.9167 days. Another
critical waste is transportation, consume 695 mins or
11,58 hours. While excess processing, transportation,
and motion also being identified. The defect product
was recognized into two types i.e., gas hole, crack,
shrinkage, and cold shut, as provided in Table 4.
Table 4: Waste defect.
Defect type Repair Probability
repair
Repair
time
(
mins
)
Gas hole,
cracks,
shrinka
g
e
Welding
repair 1
67% 640
Mold making
wait core
making
Welding
repair 2
33% 245
tempering 3% 127.05
Shrinkage
could shut
Re-
meltin
g
0,23% 31.275
The total repair time would be 646.721 mins or
17.38 hours.
3.3 Root Cause Analysis (RCA) for
Bogie Production
The following steps after waste identification are
finding the cause of waste by applying the RCA
diagram. For defect waiting, the appropriate RCA is
given in Figure 1. The root of the problem shows by
the circle symbol. From Figure 1, it can recognize that
one of the root cause for waiting is machine
breakdown. The historical data shows the proportion
of corrective maintenance is almost 80%, which
means the maintenance activities don't well planned.
This situation triggered to analyze the current
maintenance activities by using a lean maintenance
approach, which slightly different from the lean
manufacturing approach both on the waste category
and the value characteristics.
Figure 1: Root cause analysis of waste waiting
ICONIT 2019 - International Conference on Industrial Technology
146
4 LEAN MAINTENANCE FOR
BOGIE PRODUCTION
MACHINE
Machine failure characterized by downtime is
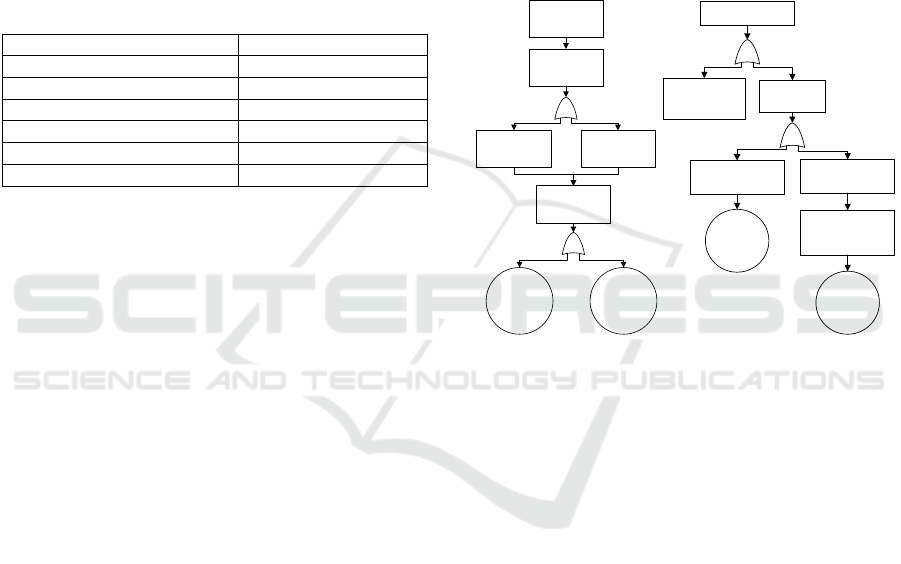
provided in Figure 2. Under the standard downtime of
5%, there are three critical machines that need to
address.
Implementation of lean maintenance follows the
framework proposed by Mostafa et al. (2015), as
depicted in Figure 3.
Figure 2: Downtime of machine production
Figure 3: Lean maintenance framework
4.1 Specify the Value, Value Stream,
and Flow of Value in Maintenance
Based on the waste of maintenance as proposed by
Davies and Greenough (2002), waste of maintenance
can be categorized into eight types as follows:
unproductive maintenance, waiting for maintenance
resources, centralized maintenance, poor inventory
management, unnecessary motion, poor maintenance,
ineffective data management, and under-utilized of
resources.
Based on the value stream maintenance mapping
(VSMM), among 51 activity of maintenance can be
grouped into 26 VA, 21 NNVA, and 3 NVA.
4.2 Pulling the Value of Maintenance
The performance of maintenance can be identified by
OEE measures. OEE determined by availability,
performance, and quality. The world-class
maintenance should have 85% OEE.
Availability rate calculated from uptime divided
by total loading time. The uptime is total loading time
subtract by downtime. Historical loading time,
planned unplanned downtime bring the value of
availability rate in 96.7%.
Performance measures how good the machine
produces the product determined by total actual cycle
time divided by total operation time. The historical
8,43%
8,30%
7,17%
3,31%
2,77%
2,48%
2,24%
1,49%
1,34%
1,15%
1,13%
1,07%
0,95%
0,94%
0,77%
0,46%
0,28%
0,27%
0,11%
SAND …
HANGER …
ARC …
TABLE …
HAMMER …
SAND …
HANGER …
CONTINUE…
ARC …
HEAT …
HEAT …
ROLLOVER …
MESIN …
IND F …
CONTINUE…
CONTINUE…
CONTINOU…
MESIN …
SAND …
% DOWNTIME
MACHINES
Lean Implementation on Production Process and Maintenance Practice for Productivity Improvement
147
data shows only 41.3% (under the standard minimum
of 60%).
The quality rate measures the proportion of good
product among all product produced by
manufacturing. Historical data shows a 100% quality
rate. This means all rework due to imperfect pouring
and casting was successfully resolved by the
machining process conducted after the cooling
process done.
Based on the value of the OEE component, the
demonstrated OEE is around 40.2% with containing
slightly increasing trend during 1,5 years of data. The
summary of losses is provided in Table 5 as follows.
Table 5: Six Big Losses.
Losses type Time (hours)
Equipment Failure 222.75
Setup and Adjustment 0.00
Idlin
g
and Sto
pp
a
g
es Mino
r
1198.58
Reduced S
p
eed Losses 537.31
Process Defect 0.00
Reduced yield (start-up) 0.00
Based on Table 4, it can easily be recognized that
the largest portion of losses is idling-stoppage and
speed losses.
4.3 Continuous Improvement of
Maintenance
Instead, all the quantitative performance measures of
lean maintenance that already calculated, carefully
figure it out the existing condition shows some issue
as follows:
a. Availability of maintenance operator.
Responsibility to handle all the maintenance
tasks for all production facilities may expose
over the worked condition, especially when
several machines fail that need to be
maintained at the same time. Therefore, as the
concepts of TPM suggest that the machine
operator could be trained as the maintenance
crew since they can identify easily and rapidly
whenever the failure mechanism happened on
the machine where they operate.
b. Job safety analysis has been produced for
several parts of the machine and production
area. The health issue for the operator is also
important to concern.
c. The administration of maintenance activities
and data need to be carefully stored by the
system — technical maintenance library as a
database of maintenance useful for any
decision taken for maintenance.
d. Part warehouse needs to be managed in order
to easily quantify the available spare as well as
the spare part demand. Rearrange of the spare
part placement on the rack will help the
operator to find the spares need and minimize
the searching time.
e. Fault tree analysis (FTA) for each maintenance
waste will help the company to identify the
correct response to the problem reveals as well
as to prevent the same problem happened in the
future. The FTA for poor maintenance and
reduce speed loos was developed, as provided
in Figure 4.
Po or main ten a nce
Wrong repair/
maintenance
Wrong methode Wrong spre parts
Lac of understanding
from maintenance
srew
Lack of training
Lack of standard
cmpetency of
maintenance crew
Reduced speed losses
Inefficient
operator
Product not ready to
be processed
Unbalance operator
speed
Unstable iir pressure in
compressor
Lack of
standard in
work processes
Unrespon sive operator
to monitor macine
operations
Lack of
standard in
work processes
Figure 4: FTA of maintenance waste and looses
4.4 Designing the Overall Measure of
Maintenance Performance based
on the Lean Concept
By considering many factors in maintenance
performance suggested by Smith (2003), the
proposed key performance indicator for the
maintenance department as follows:
a. Monitor the OEE, by providing measurement
on MTBF, MTTR, MTBF of each machine
trough reliable failure data collection
mechanism
b. Monitor the percentage of the PM work order.
c. Develop an effective planning and scheduling
maintenance
d. Monitor store service level (% stock out)
e. Design and evaluate the proper training to
improve the skill of maintenance crew as well
as the standardization of maintenance task by
providing SOP for maintenance
f. Measure the overtime proportion of
maintenance crew for completing the job
ICONIT 2019 - International Conference on Industrial Technology
148

g. Calculate the maintenance cost relatively
compare to the production rate.
5 CONCLUSIONS
Lean manufacturing successfully implemented to
manage the improvement of the Bogie production
process. The OPC highly contributes to shows several
processes that consume the largest production time.
Moreover, re-evaluate of NVA may drive to identify
the potential reducing time to escalate the MLT. From
the simulation of the production process, the potential
improved MLT is 6.9 days from the previous 8.63
days.
By carefully find the cause of manufacturing
waste, it brings to another problem of maintenance
activities. Therefore, deep analysis of lean for
maintenance activities brings the proposed idea of
improvement on standardizing the process of
maintenance, managing spare part inventory, and
identifying scheduled maintenance as well as
developing skill improvement programs for the
maintenance crew. All the suggested proposed
programs ensure the leanness of maintenance
activities that further will put more value for leanness
in the production process.
ACKNOWLEDGMENTS
This research partially funded by the Research of
Program Pengembangan Teknologi Industri (PPTI)
under Statement No 1538/PKS/ITS/2019 from the
Ministry of Research, Technology, and Higher
Education (RistekDikti).
REFERENCES
Davies, C. dan Greenough, R. M. (2002) “Measuring the
effectiveness of lean thinking activities within
maintenance,” Maintenance Journal, 3, pp. 8–14.
Madaniyah, R. N., & Singgih, M. L. (2017). Minimasi
Waste dan Lead Time pada Proses Produksi Leaf
Spring dengan Pendekatan Lean Manufacturing.
JURNAL TEKNIK ITS, 6(2), pp. 2337-3539.
Mostafa, S. et al. (2015) “Lean thinking for a maintenance
process,” Production & Manufacturing Research. 3 (1),
pp. 236–272.
doi: 10.1080/21693277.2015.1074124.
Rohani, J. M., & Zahraee, S. M. (2015). Production Line
Analysis via Value Stream Mapping: a Lean
Manufacturing Process of Color Industry. 2nd
International Materials, Industrial, and Manufacturing
Engineering Conference, 2, pp. 6-10.
Smith, R. dan Hawkins, B. (2004) Lean maintenance:
reduce costs, improve quality, and increase market
share, Plant engineering CN - TS155 .S635 2004.
Lean Implementation on Production Process and Maintenance Practice for Productivity Improvement
149
