
R
is
k
Management of Offshore Aquaculture Operations
Putu Dana Karningsih
1
, Dewanti Anggrahini
1
, Agni Dipta Swastika
1
, Novi Dwijayanti
1
and Nur
Syahroni
2
1
Department of Industrial Engineering, Institut Teknologi Sepuluh Nopember, Surabaya, Indonesia
2
Department of Ocean Engineering, Institut Teknologi Sepuluh Nopember, Surabaya, Indonesia
Keywords: Risk Management, Operational Risk, Offshore Aquaculture, House of Risk
Abstract: Aquaculture method has been well known in Indonesia for a long time. Inland aquaculture, such as the
brackish water pond, is a common practice for more than a couple of hundred of years. However, it is not the
same case for marine aquaculture, especially offshore. Fish demand is continuously increasing following the
growth of the world population. In spite of this, the number of wild captured marine fish is relatively stagnant
for the last 30 years, and there is a need to ensure the sustainability of marine ecology. To deal with this
challenge, the Indonesia Ministry of Marine Affairs and Fisheries (MMAF) has a pilot project to install and
operate offshore aquaculture. Furthermore, this program is also aiming at providing more job opportunities
for the community, ensuring food security, and increasing the contribution of the fisheries sector to the
National GDP. To ensure the successfulness of this business, offshore aquaculture operational risk
management is required. The purpose of this study is to identify, assess, evaluate, and propose treatment
action for potential risks during offshore aquaculture operations by adopting the House of Risk method. This
study identifies 47 risk events and 67 risk agents (source of risk events) of offshore aquaculture operations.
Five risk agents are selected, and suitable treatment actions are proposed accordingly.
1 INTRODUCTION
With more than two-thirds of the Indonesia area is the
ocean and approximately 7 million of its people
involve in the fisheries sector, the Indonesian
government sees that the future of the country
depends heavily on sound maritime management.
Indonesia is the second-largest fish producer in the
world. Contribution of the Fisheries sector to national
Gross Domestic Product is 2,56% in 2016, and the
Indonesian government expects to increase it
continuously (CEA, 2016).
Traditionally wild capture fisheries are the main
source of fish; however, captured fish growth has
been relatively stagnant in the last 30 years. On the
other hand, aquaculture production showed rapid
growth from only around 7% in 1974 to 42% in 2012.
Moreover, in 2014, the contribution of aquaculture
fish production for human consumption is higher than
wild capture. Thus, aquaculture is expected to take on
a greater role in the future, supplying the majority
demand for increasing the world population (FAO,
2016b).
In Indonesia, total aquaculture production
increases sharply from approximately five times
between 2000 to 2016. The Ministry of Marine
Affairs and Fisheries has set targets that total
aquaculture production can reach 31.3 tons in 2019.
However, it is not easy to achieve the target as the full
potential of Indonesian aquaculture production has
not yet employed. The potential area in Indonesia
that is available to be utilized for marine, brackish,
and freshwater aquaculture production is still very
large (around 17.92 Million hectares), but only
around 26% that has been employed. Furthermore,
according to Slamet Soebjakto, Directorate General
of Aquaculture - Ministry of Marine Affairs and
Fisheries (MMAF), there are still 16.9 million
hectares potential area that has not been utilized in
2015. Additionally, the knowledge and skill of
Indonesia's fishermen are still limited (Soebjakto,
2015; Bappenas, 2018).
MMAF has put several programs to enhance
aquaculture's production progress accordingly. Some
examples of the programs are providing fish
fingerlings/fry, broodstocks, fish foods, and biofloc
systems (KKP, 2017). The president of Indonesia,
100
Karningsih, P., Anggrahini, D., Swastika, A., Dwijayanti, N. and Syahroni, N.
Risk Management of Offshore Aquaculture Operations.
DOI: 10.5220/0009422901000108
In Proceedings of the 1st International Conference on Industrial Technology (ICONIT 2019), pages 100-108
ISBN: 978-989-758-434-3
Copyright
c
2020 by SCITEPRESS – Science and Technology Publications, Lda. All rights reserved

likewise, suggests that education should be given for
the fishermen to improve their understanding and
knowledge of aquaculture or modern fisheries
method. One of the MMAF special programs in 2018
is to install and operate Offshore Aquaculture in
Aceh, West Java, and Central Java. Each of these
offshore aquaculture units is targetted to produce
more than 900 tons of Barramundi/Seabass annually
as well as to provide jobs (income) for the
surrounding community (Soebjakto and Pregiwati,
2018).
To enable the successful implementation of
offshore aquaculture in Indonesia, it is important to
understand and manage the risks associated with
offshore aquaculture operations. Even though there
are a lot of studies on risk management of
aquaculture, specific research on offshore
aquaculture risk management, specifically in
Indonesia, is limited. Therefore, this study has five
main objectives, they are: (1) to identify potential
risks of Indonesia offshore aquaculture operations,
(2) to determine potential risks and its drivers
(causes), (3) to assess/measure risk magnitude, (4) to
evaluate risks and (5) to recommend risk treatments
plan.
To assist in the risk assessment process, the House
of Risk matrix is utilized and modified on this study
to correspond with offshore aquaculture operational
risks. A more detail description of the House of Risk
is presented in the next section. The method, results,
and discussion are elaborated in the third and fourth
sections, while section five presents the conclusion of
this study.
2 LITERATURE REVIEWS
In this section, several works of literature related to
aquaculture and risk management, including one of
the tools, House of Risk, are presented.
2.1 Aquaculture
Indonesian waters that have stable temperature and
levels of salinity provides a proper environment for
aquaculture production. In addition, a potential area
in Indonesia for aquaculture is still very huge. Up to
now, less than 30% of the area (i.e., seawater,
freshwater, brackish water) that has been utilized for
aquaculture while the biggest potential area is
seawater (around 12 million hectares). From 2000 to
2016, Indonesia's total aquaculture production
increased sharply (up to five times) from 788.500 tons
to 4.950.000 tons (FAO, 2016a).
In general, there are six methods of aquaculture
that are commonly employed in Indonesia, and they
are brackish water ponds, mariculture, freshwater
ponds, cages, floating cage nets, and paddy fields.
Brackish water ponds have been utilized in Indonesia
for approximately 400 years and are considered the
oldest method. Indonesia's major aquaculture
commodities are Shrimp, Seaweed, Grouper, Patin,
Tilapia, Goldfish, Catfish, Milkfish, and Gourami
(German-Indonesian Chamber of Industry and
Commerce, 2017). Mariculture is the cultivation of
marine animals and plants in natural (i.e., open or
enclosed section of the ocean) or controlled (i.e.,
tanks, ponds) marine waters (Deutsch et al., 2011).
Bush et al. (2019) divide aquaculture operations scale
into two levels, and they are: (1) small scale which
mainly provides income and food security to
households, (2) large scale that contributes more to
national revenue as it is targetted for supplying export
demand.
The terminology of "offshore Aquaculture,"
which is also known as "open ocean aquaculture,"
can be defined as "rearing of marine organisms under
controlled conditions in the Exclusive Economic
Zone—from the three-mile territorial limit of the
coast to two hundred miles offshore. Facilities may be
floating, submerged, or attached to fixed structures'
(Upton and Buck, 2010). There are many mariculture
(private) businesses that have been operated in
several parts of Indonesia, for example, at the
Buleleng area in Bali or Trenggalek area in East Java.
However, these aquacultures are considered as
coastal or off the coast aquaculture as these facilities
are located less than 3 km from the shore. In addition,
most of these aquaculture produces Grouper, Seabass,
and Seaweed for the local and international markets.
In April 2018, the first pilot, Offshore aquaculture
in Indonesia, was installed in Pangandaran, West
Java. It consists of eight holes, with each of them has
25.5 meters diameter and 15 meters in depth.
Moreover, it also includes one feeding system,
maintenance (feed barge), and one transport
vessel/transport boat. This offshore aquaculture is
aimed to produce 946 tonnes of Barramundi and
Seabass when it is fully operated. A similar offshore
aquaculture system is planned to be installed in Jepara
Central Java and Sabang Aceh. Moreover, these
offshore aquacultures are also aimed to open new job
opportunities to the nearby community as well as to
fulfill market demand. Thus, it would support the
MMAF program to enhance the contribution of the
fisheries sector to national GDP as well as food
security (Soebjakto and Pregiwati, 2018).
Risk Management of Offshore Aquaculture Operations
101

Jin, Kite-Powell, and Hoagland (2005) emphasize
the importance of risk management in this business as
it is in a high level of uncertainty regulation,
technology, and many more. Thus, to ensure a
successful business of offshore aquaculture, sound
knowledge, and understanding of any potential risk
that could impede this business should be well
managed accordingly by taking appropriate actions.
2.2 Risk Management
Risk can be defined as “the possible occurrence of an
event that produces adverse effects on man and his
environment. The degree of risk is related to both the
probability of the event’s occurrence and also to the
estimated outcome in terms of the nature, intensity,
and duration of the adverse effects” (Wasserman and
Wasserman's, 1979) in (Gratt, 1987). As risk could
influence the goal of an activity/project and may lead
to potential losses, managing risk is essential for any
business. To manage risk, we should understand
what, how, where, and when it could be happened and
build an appropriate mitigation plan.
Risk management focuses on assessing most if not
all potential and significant risks, then implementing
effective risk response (Airmic, Alarm and Irm, 2010;
Kayis and Karningsih, 2012). Several references have
proposed a diverse risk management process/stages.
Thomas, Kalidindi, and Ganesh (2006) suggest three
steps in managing risk, and they are (1) risk
identification, (2) risk assessment/measurement, (3)
risk prioritization and response. Scavarda et al. (2006)
suggest similar steps but with an additional one step
that is communicating and consulting with
stakeholders. International Organisation for
Standardisation (ISO) provides a generic framework
for risk management in 2009, which is called ISO
31000. It offers a common standard as well as a
comprehensive guide that integrates risk management
into an organization strategy with full support from
senior management. It consists of five main
processes, and they are: (1) establishing the context,
(2) risk assessment (i.e., risk identification, analysis,
and evaluation), (3) risk treatment, (4)
communication and consultation, (5) monitoring and
review.
The study of risk has been applied broadly in
many areas, including aquaculture. According to Risk
Management AS/NZS 4360 (1999) and Haring
(2015), risks can be classified based on various
attributes such as risk source, risk consequences,
time, location, and related person/factor/activity.
Arthur et al. (2009) examine potential risks in
aquaculture that are categorized according to their
source. This study shows that there are potential risks
that originated from aquaculture operations in
society. There are environmental, biological,
financial, social, and human health risks. For
example, environment risks could be occurred due to
pollution from excess feeds and water flow changing
or financial risks due to the bankruptcy of farming
operations. On the contrary, this study also identifies
that there are potential risks coming from society and
environment to aquacultures, such as the
environmental risk that is happened as a result of
pollution from inland agriculture or sea transportation
(ships) activities, or social risk which is due to lack of
skilled human resource for aquaculture operators.
While Jin, Kite-Powell, and Hoagland (2005) conduct
a risk assessment study to assist the investor in
making the decision in relation to aquaculture
business. They propose a firm-level investment-
production model. Moreover, as open water
(offshore) aquaculture is operated under uncertainty
from market demands, biological factors, and
regulations, thus they suggest the traditional rule of
Net Present Value should be altered.
There are some approaches/tools that could be
utilized for supporting risk management process, to
name a few: brainstorming, flow chart, structured
interview and questionnaire, fault tree, structured
interview, expert judgment, event tree, fault tree,
statistical and numerical analysis, simulation and
computer modeling (Ahmed, Kayis and
Amornsawadwatana, 2007; Grimaldi, Rafele and
Cagliano, 2012). Another tool, such as risk matrices,
has broadly utilized to measure and rank risks
according to its likelihood and consequences (Ristic,
2013).
Pujawan and Geraldin (2009) propose House of
Risk (HOR), a tool for managing risks in the supply
chain context, which is developed by integrating
Failure Mode and Effect Analysis (FMEA) and
House of Quality (HOQ). HOR consists of two main
matrices. The first matrix, HOR stage 1 (table 1), for
identifying and classifying risk events and their
associated causes (risk agents) based on five SC
processes of SCOR (i.e., Plan, Source, Make, Deliver,
Return) framework.
ICONIT 2019 - International Conference on Industrial Technology
102
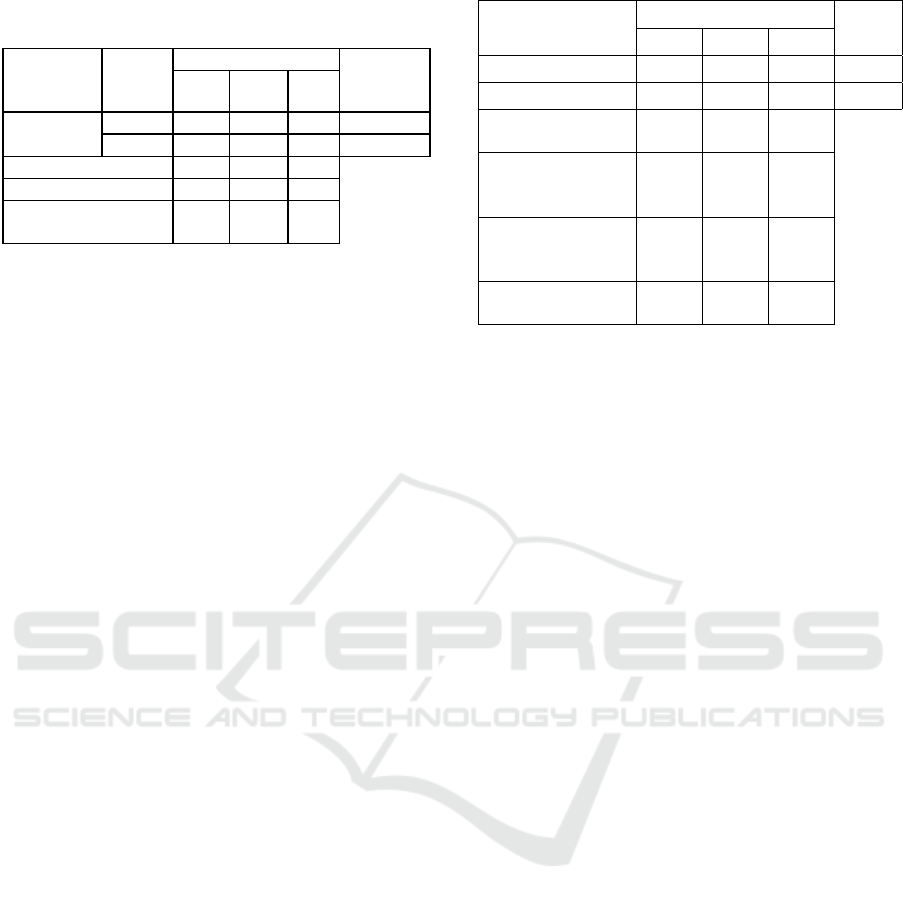
Table 1: HOR 1 matrix
Aggregate Risk Potential (ARP) is calculated by
using this formula (1) below:
ARP
O
∑
S
R
(1)
ARPj = Aggregate Risk Potential of risk agent j
Oj = occurrence of risk agent j
Si = severity of risk event i
Rij = relation value of risk event i with risk agent j
Thus, from this matrix, the ARP value for each
risk agent is calculated, and it could be ranked. The
decision-maker then could select how many risk
agents would be further analyzed for risk treatment.
The selection could be based on Pareto Law or the top
five or other particular criteria, depending on the
organization's personal consideration. This step is
generally called as risk analysis and evaluation. Then,
the formulation of risk treatment (action) for each
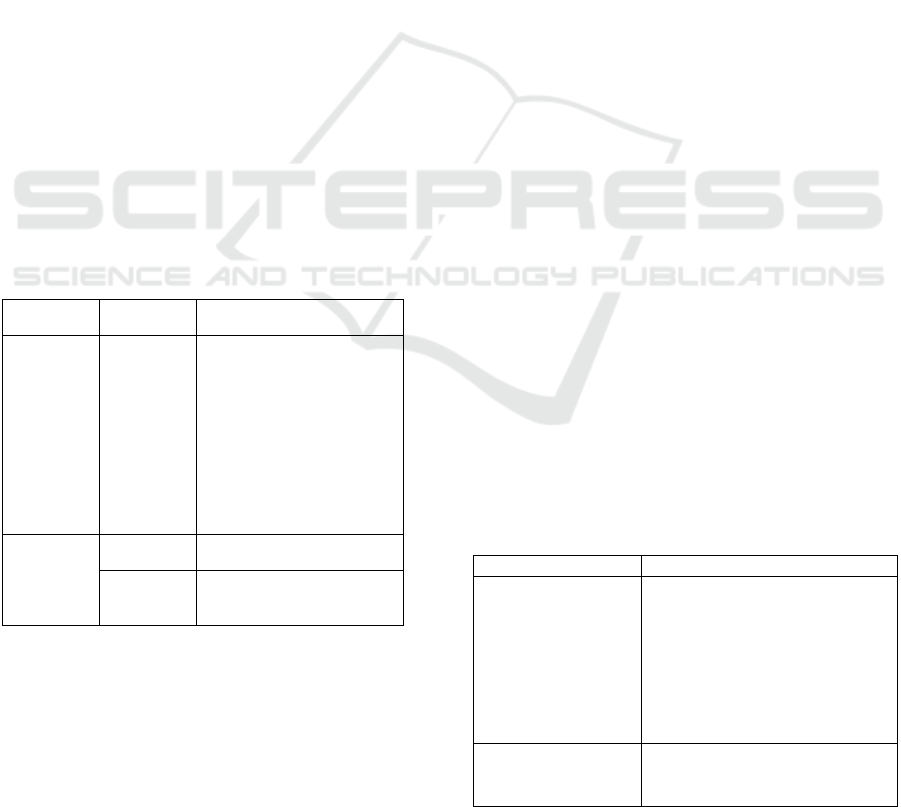
(selected) risk agent is conducted on the HOR stage 2
matrix. This matrix is aimed to measure and rank
alternatives of risk treatments for each risk agent
according to Effectiveness to Difficulty (EtD) Ratio.
The total effectiveness of each action is calculated by
using this formula (2) below:
TE
∑
ARP
E
2
Ejk = the degree of effectiveness of action k in
reducing the likelihood of occurrence of risk agent j
Effectiveness to Difficulty (EtD) Ratio ratio is
calculated by dividing the Total Effectiveness of each
Action with Degree of Difficulty to perform this
action. The highest rank (rank 1) is given to the
preventive action with the highest ETD
k
.
Table 2: HOR 2 matrix
As this HOR is developed specifically for
managing risk in the Supply Chain Operations
context; therefore, in this paper, the matrix is
modified to suit the nature of this study that is
offshore aquaculture operations.
3 RISK MANAGEMENT OF
OFFSHORE AQUACULTURE
OPERATIONS
In this part, assessing the risk of offshore aquaculture
operations is conducted by following [14] steps,
namely: (1) establish the context, (2) risk
identification, (3) risk analysis, and (4) risk
evaluation. Next, each step is elaborated further in
the following subsections.
3.1 Establish the Context
This step is related to define external and internal
parameters, including determining scope and risk
criteria of offshore aquaculture operations. The
selection of the location of installation, construction
of the floating net cage (aquaculture structure), and
fish distribution/marketing are not included in this
study. In general, aquaculture operations could be
divided into two main activities: they are:
a. Cultivating the fish, from stocking (fish
seed/fingerling supply), feeding, nursing/monitoring,
and harvesting
b. Maintaining the floating net cage
The type of fish that is selected in this study are
Seabass, Barramundi, or Grouper, which are
considered as a high-value fish, and they have been
successfully grown in the current nearshore
aquaculture practices in Indonesia. The floating net
Bussiness
process
(Activity)
Risk
event
(Ei)
Risk agent (Aj) Severity
of risk
event (S
i
)
A1 A2 A3
Plan
E1 (R
ij
) 9 7
E2 3 10
Occurance (O
j
) 9 8
ARP
j
567 240
Priority of Rank of
Agent j
1 2
Prioritized Risk
Agents (Aj)
Preventive Actions (PAk) ARPj
PA1 PA2 PA3
A2 Ejk 9 567
A3 3 9 240
Total effectiveness
of action k (TEk)
TE1 5823 2160
Degree of difficulty
performing Action k
(Dk)
D1 5 3
Effectiveness to
difficulty (EtD)
ratio
EtD1 1165 720
Rank of priority for
Preventive Action k
R1 1 2
Risk Management of Offshore Aquaculture Operations
103
cage installation is located between three miles to two
hundred miles of Indonesian offshore.
3.2 Identify Operations Risks
Identifying most (if not all) potential operations risks
of offshore aquaculture is conducted, starting by
gathering potential risks from literature studies. Then,
these risks are validated by interviewing six experts
from different field studies (i.e., Fisheries and Marine
Sciences, Ocean Engineering, and Biology) as well as
12 practitioners (i.e., fishermen, aquaculture business
owners and staffs). As a result, 47 risk events are
identified, which consists of 21 risks related to
floating cage maintenance and 26 risks related to fish
cultivation. Next, the source of each risk event or risk
agent also needs to recognize so effective risk
treatment can be applied properly to reduce, transfer,
or avoid these risk events. Risk agents (source of risk
event) are obtained by using a similar method and
conducted concurrently when identifying risk events.
As a result, 67 risk agents (i.e., 35 risk agents related
to floating cage maintenance and 32 risk agents
related to fish cultivation) are then identified
accordingly. Table 3 shows a partial list of risk events
with their associated risk agents. These risk events are
classified according to two main activities in
aquaculture (i.e., maintaining floating net and
cultivating fish).
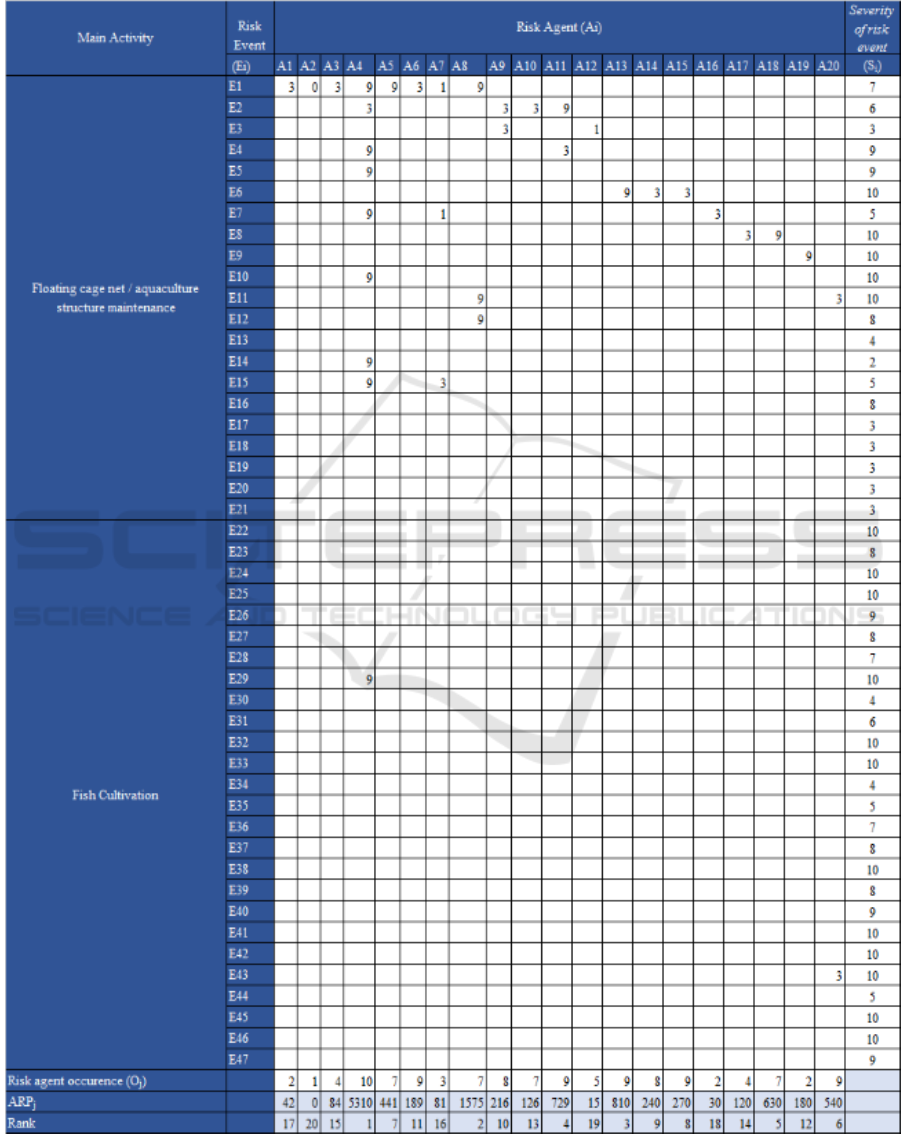
Table 3: Partial list of a risk event and risk agent
3.3 Analyze and Evaluate Risks
Risk events and risk agents that have been identified
in the previous step are then re-arranged into the HOR
1 matrix. Next, the severity of each risk event, the
occurrence of each risk agent, and including relation
level between risk events with its risk agent(s) are
determined based on expert judgment. For this case
study, the selected respondent is one of Aquaculture
business practitioner that has operated his business
for almost ten years. He is not only owned
aquaculture business in several places in Indonesia
but also several fishing vessels, hatchery, and a
seafood restaurant. The respondent
determines/measures the value of severity and
probability based on scale 1 to 10. While scale 1
represents minor/insignificant consequences or very
rarely to occur, scale 5 means medium consequences
or possible to occur and scale 10 equal to major/very
high consequences or highly frequent/almost certain
to occur. While relation level between risk events and
risk agents utilizes three-level value, they are 1, 3, and
9, which represent low, moderate, and high relations
consecutively. Finally, Aggregate Risk Potential
(ARP) of each risk agent is calculated by using
formula (1). As a result, the partial calculation of
HOR 1 for this case study can be seen in Table 4.
Risk agent with the highest top five of ARP (rank
1 to rank 5) are selected for further analyze, they are
as follow: (1) Late delivery/problem of seed
suppliers/hatchery, (2) Damaged net due to marine
animals bites, (3) Low quality of fish feed, (4)
Pollution from surrounding area of offshore
aquaculture, (5) Lack of routine maintenance of net.
3.4 Formulate and Select Risk
Treatment Action
Selected risk agent(s) from the previous stage are then
analyzed by using the House of Risk (HOR) matrix
stage 2 to formulate risk treatment as well as select
the proper risk treatment. Table 5 shows the risk
treatment action for each five risk agent. These risk
treatment options are generated based on references
as well as discussion with experts and practitioners
(aquaculture owners).
Table 5: Risk treatment action for the top five risk agent
Risk agent Risk treatment (RT)
A4. Late
delivery/problem of
seed
suppliers/hatchery
RT1. Develop a partnership
with more than one fish seed
suppliers (multi suppliers and
multi-locations)
RT2. Manage inventory of fish
seeds
RT3. Manage/produce own fish
seedling
A8.Damaged cage
net due to marine
animals bites
RT4. Improve cage net strength
by combining with outer metal
fence
Main
Activities
Risk Events Risk Agents
Maintain
Net
Damaged /
broken Nets
(E1)
Lack of routine maintenance
(A11)
Close to Lifetime of the nets
(A12)
Marine animal bites the net
(A13)
Disproportion of fish density
in the cages (A14)
Do not use knotted nets or use
a thin net (A15)
Cultivating
Fish
Unavailable
of seed (E2)
Late delivery/problem on Seed
suppliers/ hatchery (A21)
High
mortality of
seed (E3)
Improper handling during
transport (A31)
ICONIT 2019 - International Conference on Industrial Technology
104

A13. Low quality
of fish feed
RT5. Develop procedure and
run testing for incoming fish
feed
A11. Pollution from
the surrounding
area of offshore
aquaculture
RT6. Routine checking for the
surrounding area while looking
for the source of pollution and
eliminate them
A18. Lack of
routine maintenance
of net cage
RT7. Develop a proper
maintenance schedule for net
cage
House of Risk (HOR) stage 2 is then utilized to
determine which risk treatment action recommended
based on difficulty and effectiveness. The level of
difficulty and effectiveness is determined by
judgment from several respondents, namely:
aquaculture owner and aquaculture expert. Based on
analysis of HOR stage 2 as can be seen in Table 6, the
recommendation of selected risk treatment action for
each prioritized risk agent are as follow:
(1) Develop partnerships with multiple fish seed
suppliers located in different locations.
(2) Combining original cage net with an outer
metal fence to increase its strength
(3) Develop a proper maintenance schedule for net
cage
(4) Develop procedure and run testing for
incoming fish feed
(5) Routine checking for the surrounding area
while looking for the source of pollution and
eliminate them
4 CONCLUSIONS
Aquaculture, including offshore aquaculture
operations, is considered a more environmentally
friendly way of fulfilling the rising market demand of
fish than traditional wild capture. Managing
operations risks of offshore aquaculture is essential to
ensure the successfulness of the MMAF program and
any aquaculture operations.
This study has identified 47 risk events and 67 risk
agents (source of risk events) of offshore aquaculture
operations. By adopting the House of Risk stage 1
matrix, these risks are analyzed and evaluated by
considering the expert's judgment. Five risk agents
are selected or prioritized based on the highest-
ranking (aggregate risk potential value) to further
analysis. For each risk agent, the alternative of action
for treating risk is determined and mapped into the
House of Risk stage 2. As a result, five risk treatments
are recommended to mitigate offshore aquaculture
operations risks.
ACKNOWLEDGMENTS
This research project is funded by Lembaga
Penelitian dan Pengabdian Kepada Masyarakat
(LPPM) ITS
REFERENCES
Ahmed, A., Kayis, B. and Amornsawadwatana, S. (2007)
‘A review of techniques for risk management in
projects’, Benchmarking: An International Journal,
14(1), pp. 22–36. doi: 10.1108/14635770710730919.
Airmic, Alarm and Irm (2010) ‘A structured approach to
Enterprise Risk Management (ERM) and the
requirements of ISO 31000 Contents’, Risk
Management, 7(1), p. 20. doi:
10.1016/j.solmat.2010.12.013.
Arthur, J. R. et al. (2009) Understanding and applying risk
analysis in aquaculture. New York.
Bappenas (2018) KEBERLANJUTAN DAN
KESEJAHTERAAN NELAYAN DIUTAMAKAN
ISPIKANI DALAM PENYUSUNAN RPJMN 2020-
2024. Available at:
https://www.bappenas.go.id/files/8315/4760/7726/Siar
an_Pers_-
_Keberlanjutan_dan_Kesejahteraan_Nelayan_Diutam
akan_ISPIKANI_Dalam_Penyusunan_RPJMN_2020-
2024.pdf.
Bush, S. R. et al. (2019) ‘Emerging trends in aquaculture
value chain research’, Aquaculture. Elsevier,
498(August 2018), pp. 428–434. doi:
10.1016/j.aquaculture.2018.08.077.
CEA (2016) Indonesia Fisheries : 2015 Review.
Deutsch, L. et al. (2011) ‘Global trade of fisheries products:
Implication for marine ecosystems and their services’,
in Köllner, T. (ed.) Ecosystem Services and Global
Trade of Natural Resources: Ecology, Economics and
Policies. London: Routledge, pp. 120–147.
FAO (2016a) The state of world fisheries and aquaculture,
The State of World Fisheries and Aquaculture 2016.
doi: 92-5-105177-1.
FAO (2016b) the State of World Fisheries and Aquaculture
2016.Contributing to food security and nutrition for all.
Rome.
German-Indonesian Chamber of Industry and Commerce
(2017) Fisheries and Aquaculture Sector Report.
Available at:
https://indonesien.ahk.de/fileadmin/AHK_Indonesien/
Publication/PDF_Publication/EIBN/Fisheries_and_Aq
uaculture_Sector_Report_2017_FULL.pdf.
Gratt, L. B. (1987) ‘RISK ANALYSIS OR RISK
ASSESSMENT; A PROPOSAL FOR CONSISTENT
DEFINITIONS’, in Covello, V. T. et al. (eds)
Uncertainty in Risk Assessment, Risk Management,
and Decision Making. New York: Plenum Press, pp.
241–242.
Risk Management of Offshore Aquaculture Operations
105

Grimaldi, S., Rafele, C. and Cagliano, A. C. (2012) ‘A
Framework to Select Techniques Supporting Project
Risk Management’, in Cagliano, A. C. (ed.) Risk
Management – Current Issues and Challenges. InTech,
pp. 67–95.
Haring, I. (2015) ‘Introduction to Risk Analysis and Risk
Management Processes’, in Risk Analysis and
Management: Engineering Resilience. Singapore:
Springer Science+Business Media, pp. 9–26. doi:
10.1007/978-981-10-0015-7.
Jin, D., Kite-Powell, H. and Hoagland, P. (2005) ‘Risk
Assessment in Open-Ocean Aquaculture: a Firm-Level
Investment-Production Model’, Aquaculture
Economics & Management, 9(3), pp. 369–387. doi:
10.1080/13657300500242261.
Kayis, B. and Karningsih, P. D. (2012) ‘SCRIS: A
knowledge-based system tool for assisting
manufacturing organizations in identifying supply
chain risks’, Journal of Manufacturing Technology
Management, 23(7), pp. 834–852. doi:
10.1108/17410381211267682.
KKP (2017) Program Perikanan Budidaya Tunjukkan
Capaian Positif. Available at:
http://www2.kkp.go.id/artikel/1152-program-
perikanan-budidaya-tunjukkan-capaian-positif
(Accessed: 1 August 2019).
Nyoman Pujawan, I. and Geraldin, L. H. (2009) ‘House of
risk: a model for proactive supply chain risk
management’, Business Process Management Journal,
15(6), pp. 953–967. doi: 10.1108/14637150911003801.
Risk Management AS/NZS 4360:1999 (1999) Risk
Management AS/NZS 4360:1999.
Ristic, D. (2013) ‘Characteristics of Risk Matrices’, Safety
Engineering, 3(3), pp. 121–127. doi:
10.7562/SE2013.3.03.03.
Scavarda, A. J. et al. (2006) ‘A methodology for
constructing collective causal maps’, Decision
Sciences, 37(2), pp. 263–283. doi: 10.1111/j.1540-
5915.2006.00124.x.
Soebjakto, S. (2015) Laporan Kinerja Direktorat Jendral
Pengelolaan Laut 2015. Available at:
file:///D:/journal/Laporan KINERJA Direktorat
Jenderal Pengelolaan Ruang Laut Tahun 2015.pdf.
Soebjakto, S. and Pregiwati, L. A. (2018) KKP |
Kementerian Kelautan dan Perikanan, Mengenal
Sistem Budidaya KJA Offshore Pertama di Indonesia.
Available at: http://kkp.go.id/an-
component/media/upload-gambar-
pendukung/kkp/SIARAN PERS/April/SP73
MENGENAL SISTEM BUDIDAYA KJA
OFFSHORE PERTAMA DI INDONESIA.pdf.
Thomas, a. V., Kalidindi, S. N. and Ganesh, L. S. (2006)
‘Modelling and assessment of critical risks in BOT road
projects’, Construction Management and Economics,
24(4), pp. 407–424. doi: 10.1080/01446190500435275.
Upton, H. F. and Buck, E. H. (2010) ‘Open Ocean
Aquaculture’, Congressional Research Service, 7–
5700(RL32694). Available at: www.crs.gov
ICONIT 2019 - International Conference on Industrial Technology
106
APPENDIX
Table 6: House of Risk stage 1
Risk Management of Offshore Aquaculture Operations
107
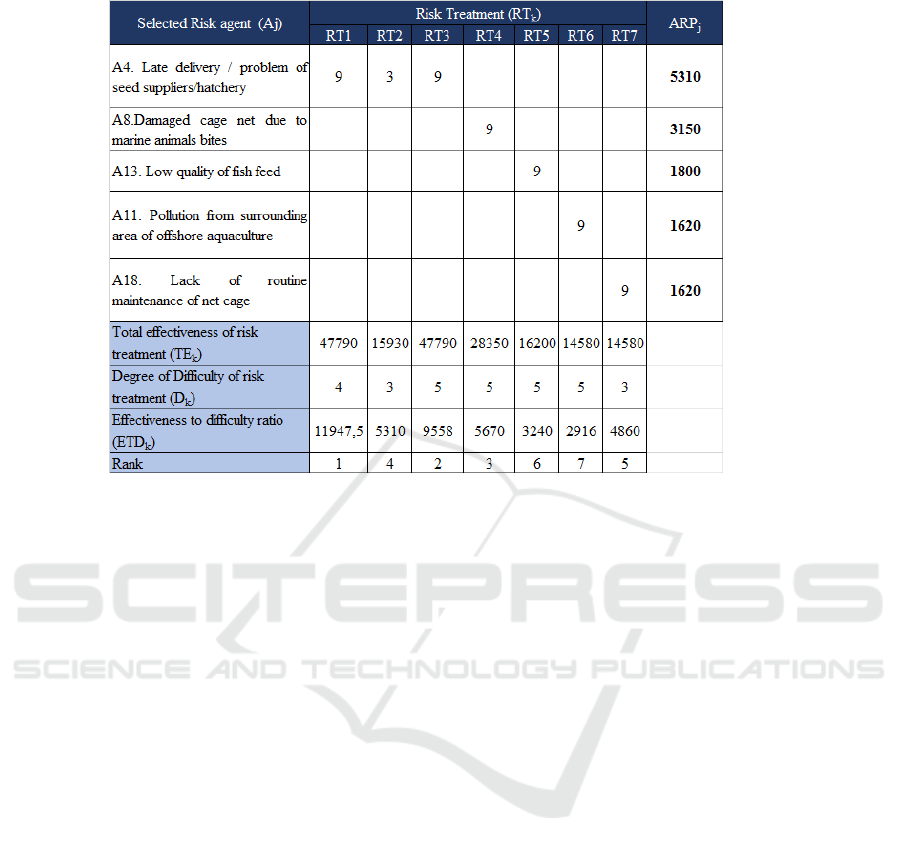
Table 7: House of Risk stage 2
ICONIT 2019 - International Conference on Industrial Technology
108
