
Designing a Performance Measurement System at Science
Technopark using the European Union Model
Patdono Suwignjo, Yulia Kurnia Ratri and Sri Gunani Partiwi
Department of Industrial Engineering, Faculty of Industrial Technology, Institut Teknologi Sepuluh Nopember (ITS),
Surabaya, Indonesia
Keywords: Performance Measurement System, Science Techno Park, Science Techno Park Dimension, Institut
Teknologi Sepuluh Nopember Science Techno Park, Coffee, and Cocoa Science Techno Park
Abstract: The development of Science Techno Park in Indonesia has a goal to increase economic growth and strengthen
the role of science and technology. The European Union, as a country that has known Science Techno Park
since the mid-1960s, in 2013 compiled the Science Techno Park model and stated that the success of the
Science Techno Park was influenced by three dimensions, namely economic, sustainability and process
improvement. So that the adaptation of the European Union Science Techno Park model to Science Techno
Park in Indonesia is made in designing the performance measurement system. The design of the performance
measurement system consists of the formulation of indicators on the dimensions of the Science Techno Park
based on applicable rules for the Science Techno Park Indonesia including the assessment of the maturity of
the Science Techno Park, display performance indicator properties, and trials at the Science Techno Park in
Indonesia. The results of the trial show that Science Techno Park in Indonesia already has targets and
documents on performance, but there are still a number of targets and realization that do not have data
availability
1 INTRODUCTION
According to the World Economic Forum in 2011,
Indonesia is in the category of countries that are at the
efficiency-driven stage so that they will try to develop
to be in an innovation-driven position. However,
Indonesia has a low technological readiness [1].
Therefore President of the Republic of Indonesia
declared Nawacita as a nine priority agenda
implemented during his administration, one of which
reads, "Increasing people's productivity and
competitiveness in international markets so that the
Indonesian people can advance and rise together with
the nations Other Asia." The 6th Nawacita program
refers to the development of science technology parks
in areas with the latest infrastructure and facilities.
The development of science technology park aims to
increase economic growth and strengthen the role of
science and technology in economic development by
promoting a culture of innovation and business
competitiveness [2].
During the three years of development of Science
Techno Park, of course, many developments and
performances have been carried out. Based on
Presidential Regulation No. 106 of 2017 concerning
the Development of the Science Technology Area in
article 24 regarding quality assurance of KST
management, it is necessary to have a registration,
assessment, giving recommendations, ranking,
guidance, and supervision [3]. Quality assurance at
Science Techno Park is carried out by the Ministry of
Research, Technology, and Higher Education.
However, there is no performance evaluation on the
internal Science Techno Park on each performance
indicator.
The development of Science Techno Park in the
European Union began in the mid-1960s to the 1970s.
So that Science Techno Park in the European Union
is familiar with the characteristics and failures and
successes of Science Techno Park. So the European
Commission developed the Science Techno Park
model composed of government, academia, and
business which formed on three dimensions that led
to the success of Science Techno Park, namely the
dimensions of economic improvement, sustainability,
and the process dimension to achieve economic
improvement as well as sustainability [4]
Suwignjo, P., Ratri, Y. and Partiwi, S.
Designing a Performance Measurement System at Science Technopark using the European Union Model.
DOI: 10.5220/0009405800690075
In Proceedings of the 1st International Conference on Industrial Technology (ICONIT 2019), pages 69-75
ISBN: 978-989-758-434-3
Copyright
c
2020 by SCITEPRESS – Science and Technology Publications, Lda. All rights reserved
69
Indonesia, as a country that has recently
developed Science Techno Park, requires a
performance measurement model. Given the need for
performance measurement and keeping in mind that
the Science Techno Park model developed by the
European Union is ahead of Indonesia, the European
Union Techno Park model prepared by the European
Commission, Directorate-General for Regional and
Urban Policy can be a guide for Science Techno Park
in Indonesia which is under development.
Performance measurement using the European
Union's Techno Park model can be used as a basis for
providing recommendations, ranking, assessing, and
monitoring on Science Techno Park. Against
this background, this study aims to determine the
dimensions of the Science Techno Park based on the
European Union Techno Park model, to know the
rules related to Science Techno Park, to map the rules
and to assess the maturity of the Science Techno Park
dimensions, to design a Science Techno performance
measurement system Park in Indonesia, and know the
results of performance measurement trials at the
Sepuluh Nopember Institute of Technology and
Coffee and Cocoa Science Techno Park.
1.1 First Section
Data collected at this stage are the dimensions of the
Science Techno Park based on the European Union's
Techno Park model and the rules relating to Science
Techno Park. Data collection is done by
brainstorming on the data needed
1.2 Model Development
The stages of developing a performance measurement
system model at Science Techno Park using the
European Union model consist of:
1. Mapping the Rules of Science Techno Park
against the Dimensions of Science Techno Park
2. Compilation of Performance Indicators
3. Designing Performance Indicator Properties
4. Performance Indicator Validation and
Performance Indicator Properties
5. Designing a Performance Measurement
Dashboard
1.3 Testing The Model
The model testing phase aims to find out whether the
designed model can be applied to Science Techno
Park as well as to find out the results of performance
measurements at the Science Techno Park Sepuluh
Nopember Institute of Technology and Coffee and
Cocoa Science Techno Park. There are two processes
carried out in the pilot phase, namely weighing and
measuring the achievement of the performance of
Science Techno Park. Weighting is done by pairwise
comparison by the expert at the relevant Science
Techno Park.
2 MODEL DEVELOPMENT
2.1 Data Collection
The data needed to develop a performance
measurement model includes the direction of the
development and development of Science and
Technology based on direction from BAPENNAS,
goals, objectives, and functions of Science Techno
Park based on Republic of Indonesia's Presidential
Regulation Number 106 Year 2017, and maturity
assessment for Science Techno Park compiled by
Ministry of Research, Technology and Higher
Education.
2.2 Model Development
Model development begins with mapping the rules of
Bapennas and the Republic of Indonesia's
Presidential Regulation No. 106 of 2017 to the
Science Techno Park dimension, mapping the
maturity assessment of the Science Techno Park
dimension as well as compiling performance
indicators from the mapping results, then adjusting to
the rules of the Bapennas and the Republic of
Indonesia's Presidential Regulation Indonesia
Number 106 Year 2017.
Table 1 Results of Arrangement of Rating Elements Based
on Mapping Results
Index Dimension Index Rating Element
1
Economic
Improveme
nt
1.1 Tenant and client
served
1.2 Output Science
Techno Park
1.3 Startup income
1.4 Increase in start-up
capital
1.5 Science Techno
Park Revenue
1.6 Technology
Transfer
2
Sustainabilit
y
2.1 Tenant with
regional potential
2.2 Support from
universities and
research institution
ICONIT 2019 - International Conference on Industrial Technology
70
Index Dimension Index Rating Element
2.3 Applied Research
and Development
2.4 Network with
regional, national,
international
2.5 Financial
independence of the
management
organization in
operational
activities
2.6 Investments in the
development of
Science Techno
Park
2.7 New Technology
2.8 Science Techno
Park field
3 Process
3.1 Integration between
the production
process and
preparation with
marketed products
and services
3.2 Managers
3.3 Partners
3.4 Development of
tenants
3.5 Branding Science
Techno Park
3.6 Completeness of
supporting facilities
Table 1 is an assessment element formed based on
the results of the mapping of rules based on the
Bapennas and Presidential Regulation of the Republic
of Indonesia in 106 of 2017 relating to Science
Techno Park and mapping of maturity assessment on
the Science Techno Park dimension. For each
assessment element formed, there are indicators used
to measure performance in Science Techno Park.
Table 2 Performance Indicators
Index Indicator Unit
1.1.1 Number of tenants who
receive services/facilities/
training / technical assistance
in Science Techno Park
tenant
1.1.2 Number of clients outside the
incubation tenant who receive
services/facilities/ training /
mentoring Science Techno
Park
partners /
clients
1.2.1 Number of new startups
formed
startup
Index Indicator Unit
1.2.2 Number of spin-off
companies formed
(accumulated)
companies
1.3.1 Average start-up income in
the current year of the
rupiah
1.4.1 The amount of start-up capital
that is increased to increase
turnover and asset value
through business cooperation
with the industry
rupiah
1.5.1 Total Science Techno Park
income per year
rupiah
1.5.2 Total contributions of Science
Techno Park to the parent
agency
rupiah
1.6.1 Number of research
technology applied to
tenants/clients
research
2.1.1 Number of tenants who
support the potential of areas
tenant
2.2.1 Number of colleges and
research institutions to
support the development of
Science Techno Park
institutions
2.3.1 Total Applied Research and
Development is carried out
research
2.4.1 Total collaboration with
regional institutions (in the
form of employment
contracts)
institutions
2.4.2 Number of collaboration with
international institutions (in
the form of employment
contracts)
institutions
2.4.3 Number of collaboration with
international institutions (in
the form of employment
contracts)
institutions
2.5.1 Percentage of the budget
obtained from Science
Techno Park services and the
contribution of partners
outside the parent institution
to the total operating budget
of Science Techno Park
percent
2.6.1 Amount of funds for the
investment program
rupiah
2.6.2 Percentage of program
facilities development
programs
2.6.3 Percentage of procurement of
goods
goods
2.7.1 Number of new technologies
produced
HKI
2.8.1 Existence of proof of land
ownership for Science
Techno Park
certificates
Designing a Performance Measurement System at Science Technopark using the European Union Model
71
Index Indicator Unit
3.1.1 Percentage of products and
services that can be accepted
and utilized by the
community
percent
3.2.1 Number of managers of
Science Techno Park
people
3.2.2 Percentage of certified
managers
percent
3.2.3 Number of meeting managers
to improve manager
communication
meeting
3.2.4 Number of HR development
programs/managers
implemented
programs
3.2.5 Number of HR training
(certification) development
programs implemented
programs
3.3.1 Number of active and
implemented MoUs that
reflect the completeness of
the Academic, Business,
Government, and Community
(ABGC) partner
MoU
3.4.1 Number of workshops, focus
group discussions (FGD),
seminars conducted to
improve the competence of
tenant
workshop
3.4.2 Number of research,
development, and technology
business facilities to support
the basic functions and
services of Science Techno
Park
facilities
3.4.3 Number of innovation
services (R&D, technology
transfer services, specialized
high-value scientific
equipment)
services
3.5.1 Percentage of internet and
website utilization as media
branding and information
percent
3.5.2 Number of socialization and
promotion programs for the
Science Techno Park
branding of the community
program
3.5.3 Number of conferences,
business meetings, business
matching
conferences
3.5.4 Number of contracts resulting
from conferences, business
meetings, business matching
contracts
3.6.1 Existence of a meeting room space
3.6.2 Existence of secretariat
services
space
3.6.3 The existence of worship
places
space
Index Indicator Unit
3.6.4 The existence of a cafe and
recreation facilities
space
3.6.5 The existence of the
exhibition center
space
Table 2 is a performance indicator that is formed
based on the results of the mapping of maturity
assessment of the Techno Park dimensions and
adjusted to the rules that apply to Science Techno
Park. From the performance indicators formed, then
the performance indicator properties are compiled,
which include the nature of the measurements, the
frequency of measurements, the frequency of
reviews, formulas, and data sources. The majority of
measurement properties are higher is better, except
for the Science Techno Parkland valuation element,
and the supporting facilities are zero one. The
measurement frequency is adjusted to the maturity
assessment conducted by the Ministry of Research,
Technology, and Higher Education, which is
quarterly so that the average measurement frequency
is also done quarterly. While the frequency of reviews
is done per semester. The formula is a formula used
to calculate performance indicators. And the data
source is a document that is needed to calculate
performance achievements.
After the performance indicators and performance
indicator properties are formed, then an expert is
validated to determine whether the performance
indicators and performance indicator properties that
are formed are valid. If it is considered valid by an
expert, then a dashboard of performance
measurement is designed to help in measuring
performance.
Figure 1 Home Page Dashboard
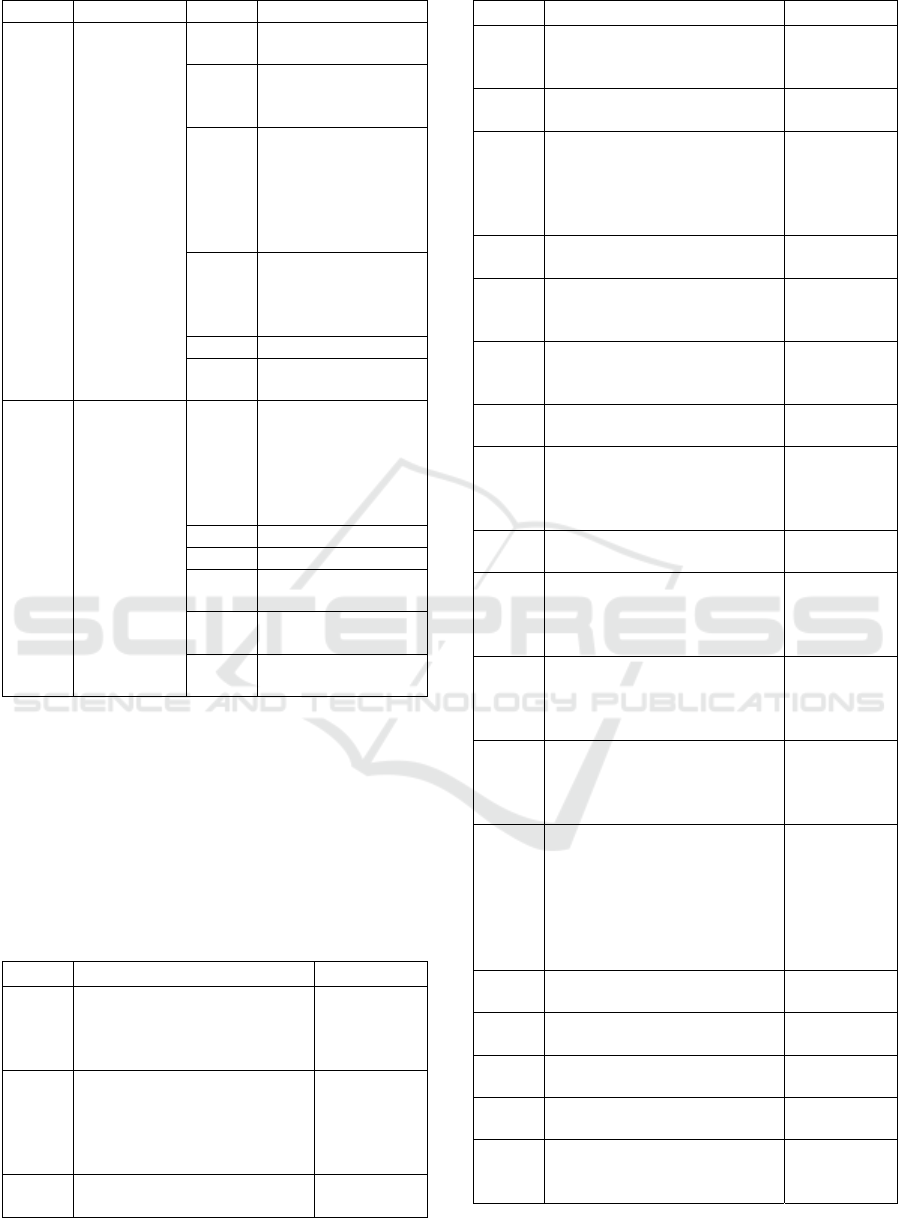
Figure 2 Menu Page Dashboard
ICONIT 2019 - International Conference on Industrial Technology
72
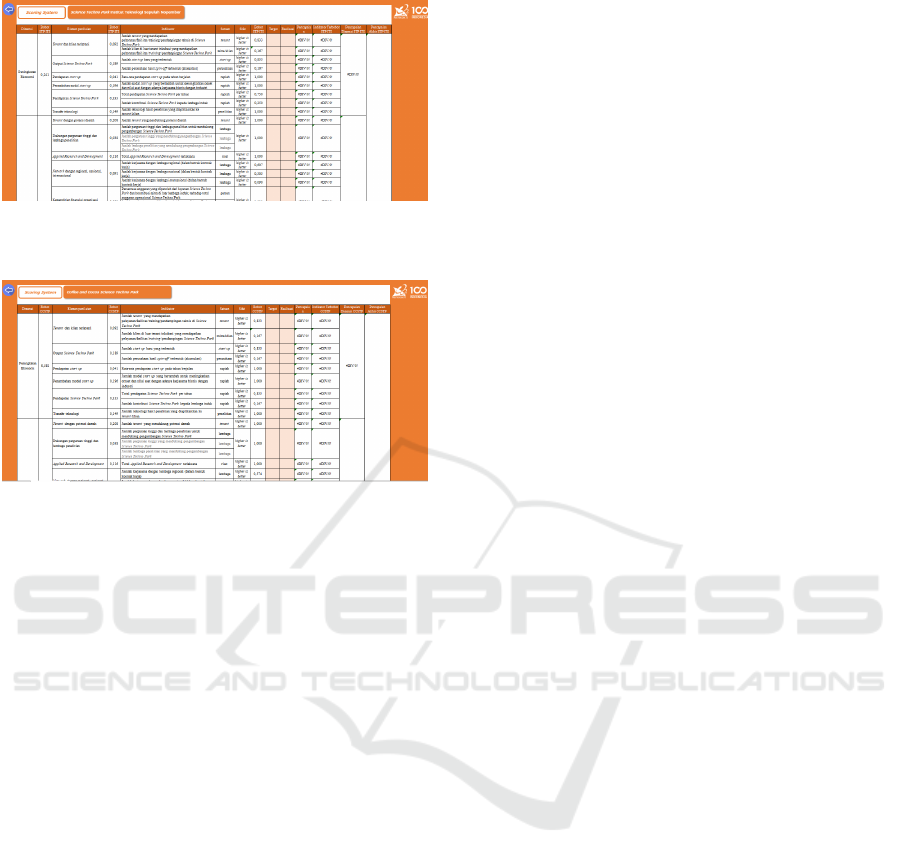
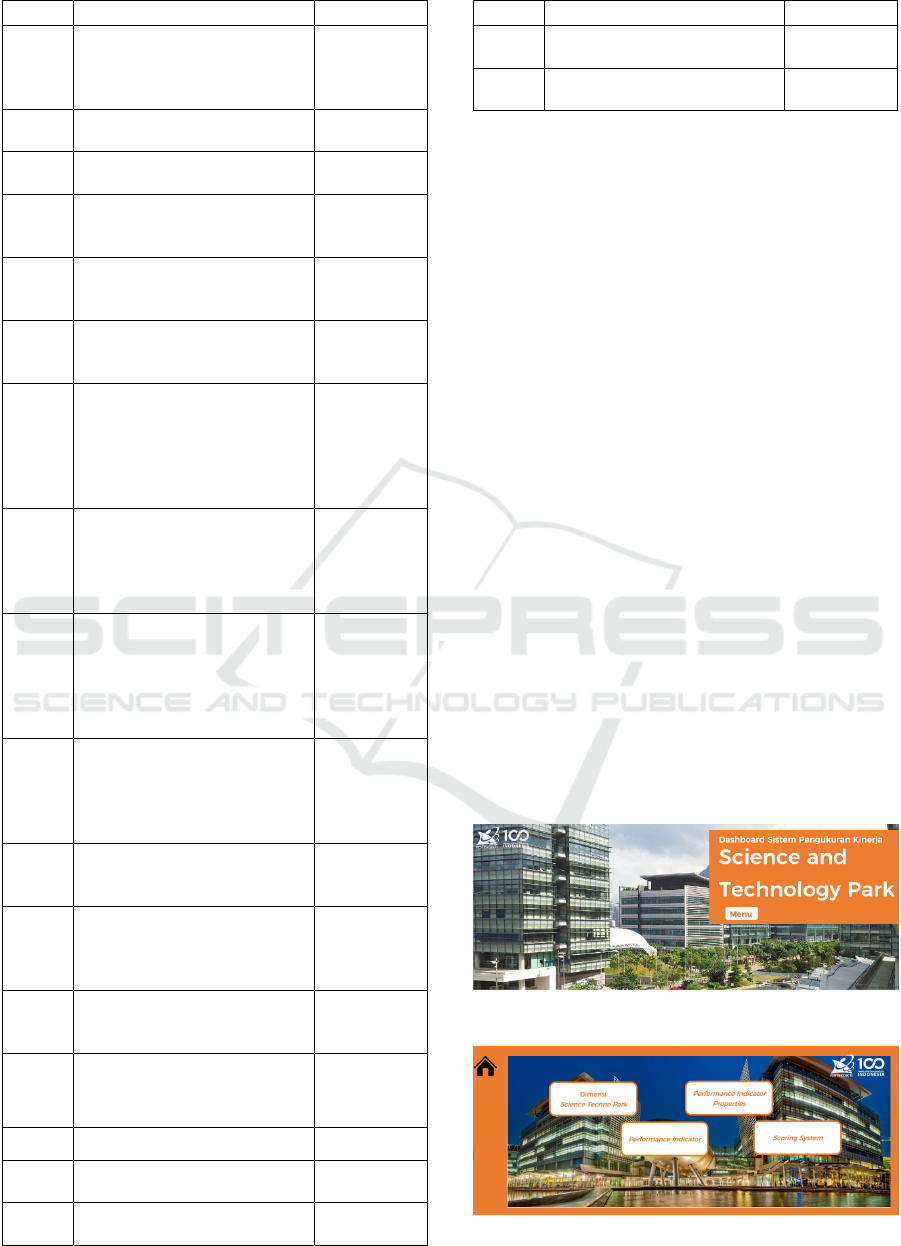
Figure 3 Scoring Page Science Techno Park ITS
Figure 4 Scoring Page Coffee and Cocoa Science Techno
Park
Figure 1, Figure 2, Figure 3, and Figure 4 are
some of the views on the dashboard measuring the
performance of Science Techno Park. Figure 1 shows
the first page that appears on the dashboard as the
home page. Figure 2 shows the menu on the
dashboard. There are four menus provided, namely
the Science Techno Park dimension menu, the
Performance Indicator menu, the Performance
Indicator Properties menu, and the Scoring System
menu. Figures 3 and 4 are the views on the Scoring
System menu. Figure 3 only shows the scoring system
for Science Techno Park at the Sepuluh Nopember
Institute of Technology, and Figure 4 shows the
scoring system for Coffee and Cocoa Science Techno
Park.
Scoring on the performance assessment of
Science Techno Park can be done by entering the
target value and realization in the target and
realization column. After completing the target values
and realization, the dashboard will process the results
of the achievement of the performance of Science
Techno Park.
Dashboards can also be used by Science Techno
Park other than the Science Techno Park of the
Sepuluh Nopember Institute of Technology and
Coffee and Cocoa Science Techno Park but must first
enter the weight of each indicator, element, and
dimension on the dashboard
3 MODEL VERIFICATION
3.1 Trials at the Techno Park Science
of Sepuluh Nopember Institute of
Technology (ITS)
Based on the weighting trial results, dimension 2
(sustainability) has the greatest weight compared to
other dimensions. Because the dimension of
sustainability has the greatest weighting of 54.8%, it
will simultaneously make the element of financial
independence have the greatest weight among the
other elements. This is because the element of
financial independence is in the sustainability
dimension. So the success of this element will drive
the success of Science Techno Park in measuring
overall performance.
Based on the results of trials at the Science
Techno Park of Sepuluh Nopember Institute of
Technology in 2018, only target a number of arranged
indicators. The targets determined only cover tenant
indicators that receive services/facilities/ training /
technical assistance in Science Techno Park, number
of new start-ups, number of technology transfers,
existence of certificates, applied R&D implemented,
number of HR development programs, number of HR
certification development programs, the number of
new technologies in the form of IPR, the number of
innovation services, and the target of procuring
conferences / business meetings / business matching.
In addition to the limitations on setting targets, many
of the realization of the indicators on the performance
measurement system have not been filled because
Science Techno Park does not yet have a
comprehensive record of all activities and agreements
on Science Techno Park. The record on the
performance of the Science Techno Park Sepuluh
Nopember Institute of Technology, is the most
staggering at each center, with varying availability at
each center. There are centers that set targets, don't
set targets, take notes, or don't take notes. Given the
limitations on-target information and realization for
Science Techno Park, it causes obstacles to
conducting a comprehensive performance
measurement of the Science Techno Park Sepuluh
Nopember Institute of Technology.
Even though overall performance measurements
cannot yet be carried out, a trial of performance
measurement at the Science Technology Park of the
Sepuluh Nopember Institute of Technology can show
indicators that have not yet been achieved by the
Science Techno Park Sepuluh Nopember Institute of
Technology, which is indicated by the traffic light
system. Performance that needs to be improved and
Designing a Performance Measurement System at Science Technopark using the European Union Model
73

improved is the formation of a new startup from the
results of incubation. In the current year, no start-up
was formed from a total of seven tenants incubated.
Improved performance results can be done by
providing more intensive services or providing
motivation for tenants to follow the incubation
process better. In addition to the number of newly
formed start-ups that are far below the target, the
discovery of applied research and development that is
still less than the target so that the performance
achievement is 70%. In addition to applied research,
the number of new technologies or IPRs is still less
than the specified target. This was conveyed by the
interviewees that the desire for innovation by
researchers is still lacking. The existence of
innovation is more inclined because of the motivation
from outside, such as government funding that has
been given and must be used for innovation activities.
This requires the implementation of innovation so
that funds can be accounted for by the government
3.2 Trials at Coffee and Cocoa Science
Techno Park
Based on the weighting trial results, dimension 1
(economic improvement) has the greatest weight
compared to other dimensions. Because the
dimension of economic improvement has the greatest
weighting of 58.1%, this is because economic
improvement is the main objective of the existence of
Coffee and Cocoa Science Techno Park and is the
vision of Science Techno Park. Then at the same time
will make the tenant element, and the underserved
client will have the greatest weight among the other
elements. This is because the tenant element and the
underserved client are in the dimension of economic
improvement. So the success of this element will
drive the success of Science Techno Park in
measuring overall performance.
Based on the results of trials of performance
measurement models at Coffee and Cocoa Science
Techno Park, in 2018, it has set targets for
performance. This is indicated by the fulfillment of
targets, and the realization of the indicators arranged.
However, there are two indicators that have not been
targeted and do not yet have available documents,
namely the indicator of Science Techno Park's
income per year and the number of contributions of
Techno Park to the parent institution. If the overall
performance measurement is done by giving 0% or
100% achievement on the two performance
indicators, it will get a value of 51.182% and
60.843%. So that if the two indicators can be
measured, the achievement of performance in Coffee
and Cocoa Science Techno Park will be in the range
of values of 51.182% to 60.843% with each
dimension achieving 13.699%, 20.203%, and
16.089% for the dimensions of economic
improvement, sustainability, and process in a row.
Achievement performance of 51.182% to
60.843% shows that there are still many
performances that need to be improved and improved
to get better performance achievements. There are 14
performance indicators that get red traffic light,
which shows that the performance is still far below
the target and needs to be evaluated to improve the
results.
The fourteen indicators found the need to be given
an evaluation, such as holding a conference with
better preparation, so that it will provide an outcome
in the form of additional investment funds from
conference participants, as well as additional start-up
capital to increase turnover. With the addition of
funds to the investment program, the procurement of
goods carried out will be smoother. Evaluation can be
done together with all relevant stakeholders so that it
will give better consideration.
Therefore, recommendations in general for 2019
and beyond, namely recording all things contained in
the Science Techno Park business process, and
evaluating the performance in the previous year so
that they will get a strategy for implementation in the
following year while increasing the results of
performance appraisal.
4 CONCLUSIONS
1. The success of Science Techno Park is driven
by three dimensions, namely the dimension of
economic improvement, the dimension of
sustainability, and the process dimension to
achieving economic improvement as well as
sustainability.
2. The preparation of performance measurement
models using rules related to the guidelines for
the development and development of Science
Techno Park, namely Presidential Regulation
No. 106 of 2017, and Development Guidelines
by BAPENNAS, and assessment of maturity
by the Ministry of Research, Technology and
Higher Education.
3. Maturity rules and assessments that apply are
categorized or mapped against the dimensions
of Science Techno Park so that we get 6
elements and 9 indicators on the economic
improvement dimension, 8 elements and 12
indicators on the sustainability dimension, and
ICONIT 2019 - International Conference on Industrial Technology
74

6 elements and 19 indicators on the process
dimension.
4. Performance indicator properties that are used
as guidelines in measuring the performance of
Science Techno Park are general in nature so
that they can be used for a variety of Science
Techno Park, which includes units, properties,
frequency of measurement, frequency of
reviews, formulas, and data sources.
Performance measurements are also displayed
in the form of a dashboard using Visual Basic
in Microsoft Excel.
5. A trial of performance measurement is carried
out at the Science Techno Park Sepuluh
Nopember Institute of Technology and Coffee
and Cocoa Science Techno Park, which shows
that both Science Techno Park already had
targets and performance documents in 2018.
From the performance measurement trials it is
known that Coffee and Cocoa Science Techno
Park scores in the range of 51.182% to
60.843%, while the Science Techno Park
Sepuluh Nopember Institute of Technology,
the results of overall performance
measurements are not yet known because there
are a number of target documents and the
realization of indicators that are not yet
available.
ACKNOWLEDGMENTS
This research was partially supported by the Coffee
and Cocoa Research Center and the Sepuluh
Nopember Institute of Technology. Dr. Eng. Kriyo
Sambodho, S.T. dan Ibu Sulistyani Pancaningtyas,
S.P., who provided insight and expertise that greatly
assisted the research, although they may not agree
with all of the interpretations/conclusions of this
paper.
REFERENCES
Institut Teknologi Sepuluh Nopember, “Laporan Akhir
Master Plan Science Techno Park Institut Teknologi
Sepuluh Nopember,” Institut Teknologi Sepuluh
Nopember, Surabaya, 2016.
Kementian Riset, Teknologi, dan Pendidikan Tinggi,
“Pedoman Pembangunan dan Pengembangan Taman
Sains dan Teknologi (Science Techno Park),” Web
Resmi Kementrian Riset, Teknologi, dan Pendidikan
Tinggi, Jakarta, 2015.
Pemerintah Republik Indonesia, “Peraturan Presiden
Republik Indonesia Nomor 2 Tahun 2015 Tentang
Rencana Pembangunan Jangka Menengah Nasional,”
Sekretariat Negara, Jakarta, 2015.
Regional and Urban Policy, Setting Up, Managing and
Evaluating EU Science and Technology Parks,
Luxemburg: Publications Office of The European
Union, 2014.
Designing a Performance Measurement System at Science Technopark using the European Union Model
75
