
Performance of Crossflow Wind Turbine by the Variation of Blade
Slope and Diameter Ratio
Diniar Mungil Kurniawati, Aprian Dwi Prasetyo, Gad Gunawan and Illa Rizianiza
Institut Teknologi Kalimantan
Keywords: Blade slope, Crossflow, Diameter ratio, Performance
Abstract: Crossflow wind turbines have a good ability to capture wind, so it is very suitable to be developed in areas
with low wind speeds. The efficiency of a crossflow wind turbine is taken from two sides, so its turbine has
high efficiency. The first side is when the wind enters the turbine pushes the front face of the blade, and the
second side is when leaving the turbine, the wind pushes the rear face of the blade. In designing a crossflow
wind turbine, design parameters can affect the height or low performance of the turbine. The main objective
of this study was to determine the flow characteristics and performance of crossflow wind turbines. The
turbine is designed with a diameter ratio of 0.5 and a blade slope of 90˚. The number of blades used as a test
is 18 blades. Turbines were simulated with at 3 m / s of wind speed on TSR 0.1 – 0.5. The results obtained
from this study are wind flow visualization and cross-flow wind turbine performance parameters. The
crossflow wind turbine performance parameters are power coefficient, moment coefficient, and tip speed
ratio.
1 INTRODUCTION
Nowadays, much development is being carried out
on vertical axis wind turbines placed on the roofs of
high rise buildings. The idea was developed because
urban communities consume a lot of electricity so
that alternative energy is needed to overcome the
swelling of the use. TASV research has several
advantages in the form of construction with
relatively low cost, operating at a low tip speed, and
does not require high wind speeds to spin (Latif,
2013). The main advantage of TASV is that the
turbine does not have to be directed towards the
wind to be effective so that it is suitable for areas
with varying wind directions. TASV consists of
several types of rotors, one of which is a crossflow
type wind turbine. The crossflow rotor type of wind
turbine is a vertical wind turbine with a simple type
of rotating wheel due to the force of drag (Dharma,
2016).
In the design of wind turbines, there are several
design parameters that can affect the performance
of the turbine, including the number of blades,
geometric design, wind speed, and the shape of the
turbine blades. Geometry design is still an
interesting concern for the design development of
crossflow wind turbines. Turbine geometry is
expressed in the form of aspect ratio. The aspect
ratio is the ratio between the outer diameter and
inner diameter of the turbine or the ratio of the
outer diameter and height of the turbine. The effect
of aspect ratio on the performance of a wind
turbine can increase the power coefficient.
Savonius type vertical axis wind turbines with
greater aspect ratio show good performance due to
low losses (Mahmoud, 2012). Similarly, a
crossflow wind turbine that has an aspect ratio of
the outer diameter of the turbine to a large turbine
height (D / H) has low losses (Akwa et al., 2012).
The influence of geometry design on crossflow
wind turbines has a very important role in
performance. One of the influential geometry
designs is the diameter ratio. The diameter ratio in
the crossflow wind turbine is the ratio between the
diameter of the inside and the outside diameter. In
making cross-flow wind turbines with diameter
ratio variations of 0.58, 0.63, 0.68 and 0.73 where
each variation is tested with wind speeds of 2 m / s
and at TSR 0.1-0.4 with intervals of 0, 1 Turbines
with a diameter ratio of 0.68 and number of blades
of 20 produce the highest power coefficient of 0.5
at TSR 0.3 (Purbaningrum, 2016).
The number of blades affects the turbine
solidity. Turbines with a certain number of blades
will produce a good performance. High turbine
52
Kurniawati, D., Prasetyo, A., Gunawan, G. and Rizianiza, I.
Performance of Crossflow Wind Turbine by the Variation of Blade Slope and Diameter Ratio.
DOI: 10.5220/0009405200520057
In Proceedings of the 1st International Conference on Industrial Technology (ICONIT 2019), pages 52-57
ISBN: 978-989-758-434-3
Copyright
c
2020 by SCITEPRESS – Science and Technology Publications, Lda. All rights reserved

solidity produces low CP and vice versa. Low
solidity indicates a higher tip speed ratio. At a low
TSR, the blade does not strongly affect the flow of
air through the wind surface area. Increasing the
number of blades in savonius wind turbines results
in low rotor torque. Therefore the number of blades
must be increased (Qing'anli et al., 2016). A certain
number of blades is likely to benefit the rotor in
wind extraction (Akwa et al., 2008). The
determination of the number of blades is
determined based on the advantages and
disadvantages of the number of blades. Increasing
the number of blades will improve airflow and
reduce the number of blades, which leads to lower
friction between wind currents and turbine blades
(Mandis et al., 2008).
An experimental test on a cross-flow wind
turbine is carried out by varying the ratio of the
diameter and the number of blades. The variation
of the diameter ratio used was 0.58, 0.63, 0.68, and
0.73, while the variation in the number of blades
used was 16, 20, and 24. Testing was carried out at
wind speeds of 3 m / s to 4 m / s. Experimental test
results show that the configuration between the
diameter ratio of 0.68 and 20 blade number is the
best configuration that has a power coefficient of
0.049 and a torque coefficient of 0.185 (Susanto,
2017).
In addition to the diameter ratio, the
geometrical design that influences the performance
of the crossflow wind turbine is the slope of the
blade. The sop blade determines the direction of
angina coming, which can be extracted well by the
blade of the turbine. The slope of the turbine blade
is very influential on the power generated in the
wind turbine. One of the wind turbine designs by
varying the angle of the blade and the radius of the
blade's curvature is tested to determine its effect on
the power produced. The test results show that the
crossflow turbine with a 45º turbine blade tilt angle
produces greater power than the 60º and 90º blade
tilt angles under all curvature radius conditions.
While the turbine curvature radius has the
characteristics of each at each angle of the turbine
tilt. Crossflow wind turbines with a blade radius of
60 mm curvature at a 45 ° angle variation of the
blades produce a maximum power of 2.47 watts at
a wind speed of 4.31 m / s and a CP of 0.41 at a
TSR of 0.76 (Barriyah, 2016).
Wind turbine performance parameters are
represented in dimensionless numbers, CP, CT, and
TSR. CP, or commonly known as the power
coefficient, is the difference between measured
turbine power and theoretical turbine power. TSR
or tip speed ratio is the value of the difference
between the rotor tip speed and free wind speed.
For certain nominal wind speed, TSR will affect
the rotational speed of the rotor. Because of this
description, the research carried out focuses on the
angle of the blade, the ratio of the diameter and the
number of blades simulated at various wind speeds.
2 SIMULATION METHODS
Computational fluid dynamics (CFD) is the tool
used to determine the numerical solution of the
equation governing fluid flow and other physical
processes with the help of computer computing. The
principle is to complete the calculation of the fluid
flow equation in the form of certain covering the
desired area. The area is often called with cells, and
the process of division is called meshing. A cell
constitutes a control calculation that will be carried
out by the application. In each cell will The
calculation is done with domain restrictions and
boundary conditions that have been determined. This
principle is used in the calculation process by using
computer computing assistance (Hirsch, 2007).
Preprocessing is the process of defining the
geometry of the model to be a computational
domain, making the mesh and defining boundary
conditions in the research conducted. Pre-processing
is the first step in analyzing a CFD model. Before a
model can be analyzed, the geometry of the model
must be defined first into the computational domain.
Then make a meshing in accordance with the
geometry and analysis to be performed. Finally,
defining boundary conditions and the nature of the
fluid to be used. This information is used as a
solution to the problem of fluid flow that is defined
for each node in each cell. The accuracy of the
results of data processing by CFD is governed by the
number of cells in the grid. In general, a large
number of cells make CFD results have better
accuracy, but with computing costs, that also
becomes more. The following picture is a vertical
axis wind flow type turbine model used in this study
shown in Figure 1.
Figure 1. The model of Crossflow wind turbine
Performance of Crossflow Wind Turbine by the Variation of Blade Slope and Diameter Ratio
53
CFD solver is processing and calculation of the
conditions that have been set during pre-processing.
At this stage, a numerical computational process is
carried out using the finite volume numerical
method. The first step is the integration of the
governing equations of fluid along with all the
governing volumes of the domain. The equation is
then discretized, which involves the substitution of
various finite difference approaches to the integrated
flow equation so that the integral equation can be
converted into algebraic equations. The equation is
then solved using the iteration method, so a solution
is obtained.
The domain stage is the domain formation in the
crossflow type wind turbine geometry model. There
are two forms of domains, namely rotating domains
and static domains. The rotating domain is located in
the outer diameter of a circular wind turbine, and
this domain is used as a path in the rotating motion.
The fixed domain or static domain, which functions
as the location of the fluid flow, this domain does
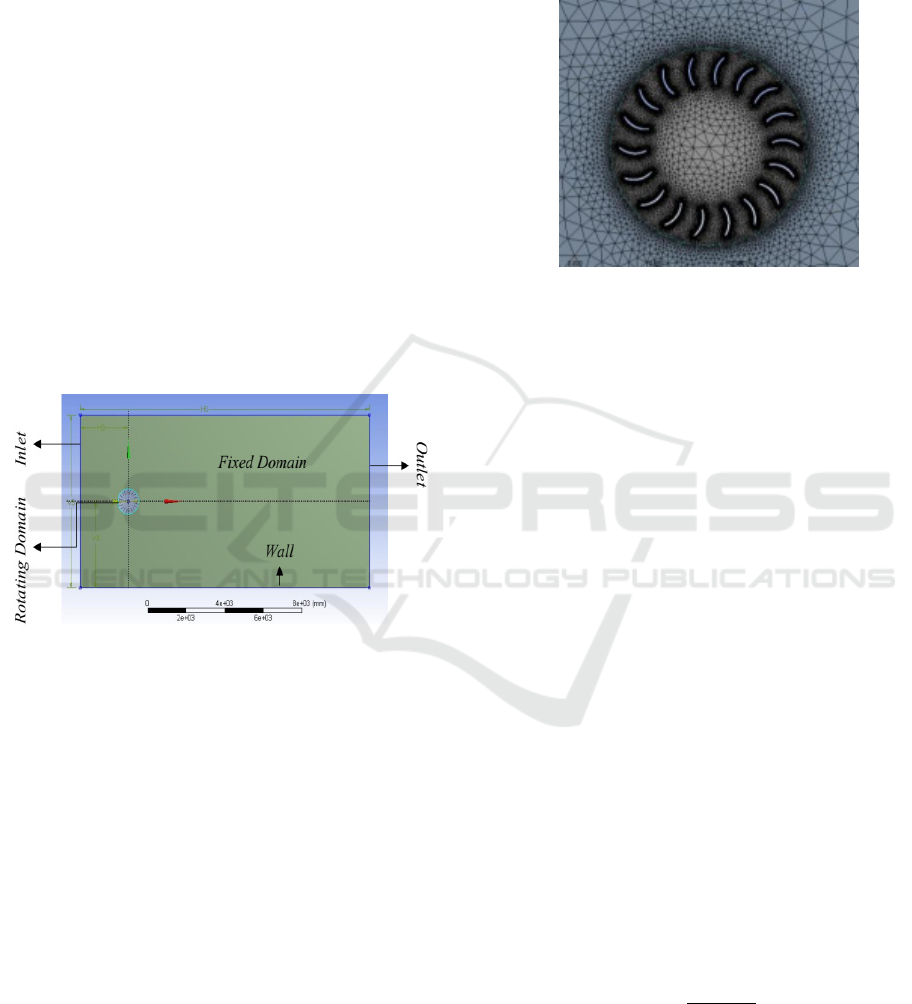
not move, as shown in the following Figure 2.
Figure 2. The domain of the wind turbine modeling
The results of the study were validated by 2D
modeling to ensure that the modeling created was an
accurate representation of the real phenomenon
being modeled. The domain used at the time of the
study was divided into two parts, namely the fixed
domain and the rotating domain. The shape of the
fixed domain is a rectangle with a length of 15000
mm and a width of 7500 mm. The rotating domains
are circular in diameter in accordance with the
research wind turbines; namely, crossflow type wind
turbines and rotating domains are located on the axis
of symmetry fixed domain with a distance of 2500
mm from the inlet or the left end.
Post-processing is the final step in CFD analysis.
At this stage, the results of the numerical
computations that have been made are visualized
and documented in the form of images, curves, and
animations.
The stage of meshing involves the division of
objects into smaller parts. To obtain an accurate
simulation, the meshing was made according to the
predicted flow pattern changes that will occur. The
following were the meshing processes (Figure 3).
Figure 3. The meshing pattern of the turbine
The process of meshing aims to divide the
solution domain into smaller parts. The amount of
this division will determine the accuracy of the
results of numerical computations performed. The
finer the meshing results, the results of numerical
computation will be more accurate later, but the
numerical computation time will be relatively
longer. The quality of triangular meshing can be
measured using a metric mesh.
The energy available in the wind is the kinetic
energy of most of the mass of air that moves above
the earth's surface. Wind turbine blades receive
kinetic energy and then convert it into mechanical or
electrical energy depending on end-use. The
efficiency of converting wind to other useful forms
of energy depends on the efficiency with which the
rotor interacts with wind flow (Hau, 2006). Wind
power can be written with the following equation:
P = 1/2 ρ A v
The theoretical power available in the wind flow
is in Equation 4.1. Whereas turbines cannot change
the power of the wind as a whole. When the flow of
wind passes through the turbine, some of its kinetic
energy is transferred to the rotor, and the air leaves
the turbine. This efficiency is usually expressed as a
power coefficient (Cp). Thus, the power coefficient
of the rotor can be defined as the ratio between the
actual power available at the wind as follows :
2
A comparison between the actual torque
produced by the rotor with the theoretical torque
produced by the turbine was expressed by the torque
coefficient (CT). So CT was stated as follows.
ICONIT 2019 - International Conference on Industrial Technology
54
2
The ratio between the tip rotor speed and wind
speed is expressed as a tip speed ratio (λ). So that,
Where Ω is the angular velocity. The power
coefficient and torque rotor coefficient can vary with
the tip speed ratio. Optimal TSR is a condition
where the most efficient energy transfer occurs, and
the power coefficient is at its maximum point (CP
max).
3 RESULTS AND DISCUSSION
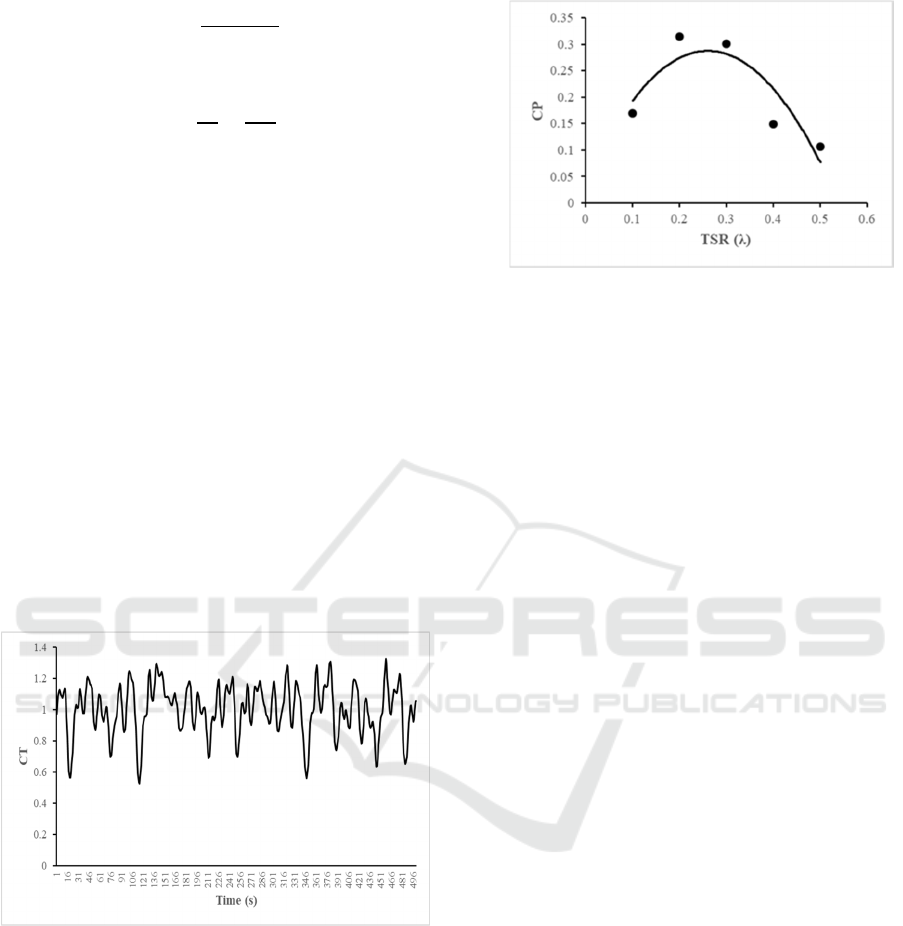
Torque Coefficient (CT) is one of the dimensionless
parameters useful to show the value of the moment
or torque in a wind turbine simulation. At the
beginning of the simulation, the situation is not
steady due to the iteration less is produced, and more
iteration is needed to achieve a steady-state. The
time taken for the torque coefficient value relatively
stable is taken in 10-15 s. From Figure 5 shown that
the research data taken for research starts from 10-
15 s.
Figure 5. Data of torque coefficient
It had been matter because the value is quite
stable so that the average value can be determined
used for further calculations. Here was the result of
simulation results cross-flow wind turbine with 18
blades and 90° blade slope with a diameter ratio of
0.5.
Figure 6. Data of power coefficient versus TSR
Choosing the right diameter and blade slope was
needed for the wind turbine to produce the best
power coefficient. The ratio of the diameter and
angle of the blade was very influential on the value
of the power coefficient due to the shape of the
blade that changes the shape of the blade so that it
can cause the amount of wind that hits the turbine
blade to not flow through a cross-section that is too
small or the wind can be hampered at a cross-section
that is too large and will cause pressure reverse and
can cause greater distance for energy transfer and
increase turbulence so as to cause a decrease in the
coefficient of power in the turbine. The selection of
the right diameter ratio is one important aspect in
producing a maximum power coefficient.
Rim radial is needed as the selection parameter.
If rim radial larger, then the amount of wind that hits
the blade will not be optimum because the wind
cannot pass through a cross-section that is too large,
which can cause back pressure so the power
coefficient value will be small. However, if the
width of the radial rim is too small, it will widen the
energy transfer distance so that it gets bigger and
increases turbulence, which causes the power
coefficient to decrease (Mockmore, 1949).
From the results of simulations, the rotational
speed of the turbine using an angle of 90° shown a
decreasing value because the turbine angle had more
upright. This is because the energy needed to move
the first level blade is not too large so that the energy
transmitted to crash into the next level blade will be
of great value as well.
However, at a more upright blade, the energy
needed to move the first level blade is greater so that
when it is forwarded to the second level blade, it will
be smaller so that it is likely that the flow of wind
does not crash at the second level blade. The blade
tilt angle variation is very influential and directly
proportional to the magnitude of the speed relative
to the blade and velocity (angle β), when the smaller
the angle of the blade tilt, the smaller the angle β.
Performance of Crossflow Wind Turbine by the Variation of Blade Slope and Diameter Ratio
55
The results of the study show that when the β
angle is small, the power generated is greater. This is
because the value of the absolute wind speed coming
out of the turbine is getting lower. When the wind
speed coming out of the turbine is low, it means that
the energy absorption carried out by the turbine is
getting maximum.
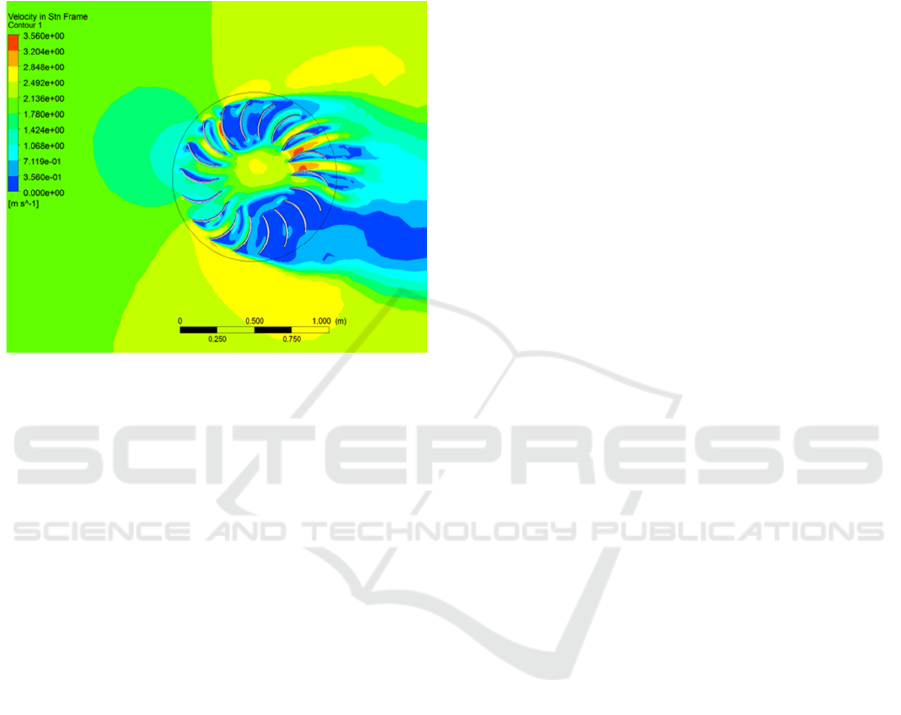
Figure 7. The flow contour of the cross-flow wind turbine
Figure 7 shows the speed contour produced by
the simulation process. The results of the speed
contour show that the process of extracting the
kinetic energy of the wind in the crossflow wind
turbine has a double interaction between the wind
and the blades of the wind turbine. The first
interaction occurred when the wind came in from the
inlet to the turbine so that it hits the first level blade.
Then the interaction of the two winds enters in the
wind turbine crevices and exits crashing into the
second level blades shortly before the wind exits
leaving the wind turbine.
In this wind turbine variation in the second level
blades, there is a lot of wind that is not well
extrapolated and more out of the turbine blades so
that the resulting performance is imperfect and not
better than other variations. This can happen
because, in the area of the second level, blades tend
to turn. The red areas in the next level blades
indicate an increase in speed in the blades. This, of
course, happens because of the large number of
blades and causes the blade gap to be narrow and the
presence of pressure, gravitational force, and viscous
friction on the turbine blade so as to produce high
speeds at several levels of blade crevices.
4 CONCLUSION
Based on the crossflow wind turbine simulation
results with a diameter ratio of 0.5, and the blade
slope is 90˚, the maximum CP value is 0.32 at TSR
0.2. Turbines in the back experience an increase in
speed caused by the flow of wind coming out of the
face of the turbine faster due to turbine rotation. In
the cross-flow wind turbine, there was negative
torque that caused the rotation speed of the turbine
hampered.
ACKNOWLEDGMENTS
The research was supported by Institut Teknologi
Kalimantan through PDB research grant , T.A. 2018,
REFERENCES
Akwa J.V., Júnior G.A.S, Petry A.P. 2012. Discussion on
the verification of the overlap ratio influence on
performance coefficients of a Savonius wind rotor
using computational fluid dynamics, Renewable
Energy Vol. 38, pp.141–149.
Barriyah, Kholifatul. (2016). “Uji Ekperimental Pengaruh
Sudut Kemiringan Sudu, Radius Kelengkungan Sudu
dan Kecepatan Angin Pada Turbin Cross Flow
Terhadap Daya yang Dihasilkan Pada Sistem
Pemulihan Energi yang Terintegrasi Dengan Menara
Pendingin”. Surakarta: Universitas Sebelas Maret.
Dharma, Untung S., dan Masherni. (2016), “Pengaruh
Desain Sudu Terhadap Unjuk Kerja Prototype Turbin
Angin Vertical Axis Savonius”, Jurnal Teknik Mesin
Univ. Muhammadiyah Metro Lampung, Vol. 5, No. 2,
Hal. 138-148.
Hau, E. 2006. Wind Turbines : Fundamentals,
Technologies, Application, Economics. New York :
Springer.
Latif, Melda. (2013). Efisiensi Prototipe Turbin Savonius
pada Kecepatan Angin Rendah. Jurnal Rekayasa
Elektronika Teknik Elektro Univertsitas Andalas, Vol.
10, No. 3, Hal. 147-152.
Mahmoud NH, El-Haroun AA, Wahba E, Nasef MH. An
experimental study on
improvement of Savonius rotor performance. Alex Eng J
2012;51(1):19–25.
Mandis, I.C., Robescu, D.N., Barglzan, M., Capitalization
of wind potential using a modified Banki wind
Turbine, UPB Scientifical Bulletin, Vol, pp. 70-4:
115-24.
Mockmore, C. dan F. Merryfield, (1949), The Banki
Water Turbine, Eng. Exp. Stn. Bull. Ser., vol. 25, no
February, pp. 1-28.
Purbaningrum, Pradityasari. (2016). “Studi Simulasi
Tentang Pengaruh Rasio Diameter dan Jumlah Sudu
ICONIT 2019 - International Conference on Industrial Technology
56

Terhadap Performa Turbin Angin Cross Flow Dengan
Menggunakan Software ANSYS-Fluent”. Surakarta:
Universitas Sebelas Maret.
Qing’an Li., Takao Maeda,. Yasunari Kamada., Kento
Shimizu,. Tatsuhiko Ogasawara., Alisa Nakai., Takuji
Kasuya., 2016. Effect of Rotor Aspect Ratio and
Solidity on A Straight-Bladed Vertical Axis Wind
Turbine in Three-Dimensional Analysis by The Panel
Method. Energy. Volume 121 (2017) 1-9.
Susanto, Sandi. (2017). “Uji Eksperimental pengaruh rasio
diameter rotor dan jumlah sudu terhadap performa
turbin angin crossflow”. Surakarta: Univeritas Sebelas
Maret.
Performance of Crossflow Wind Turbine by the Variation of Blade Slope and Diameter Ratio
57
