
Simulation Modelling of Warehouse Capacity Re-allocation to
Improve Inbound Logistics Performance: A Study Case
Muhamad Dinaryo, I Nyoman Pujawan, Niniet Indah Arvitrida
Institut Teknologi Sepuluh Nopember
Keywords: Discrete Event Simulation, Warehouse, Warehouse Capacity Re-Allocation
Abstract: The supply chain system in the fertilizer industry is quite complex because it involves many activities such
as internal logistic, material transportation processes, a number of factories, and warehouse management. The
process of raw materials handling that starting from the port to the warehouse is very influential on the
company's ability to carry out operational activities in the production department. To improve the
competitiveness of the company, the case company needs to take a number of strategic steps and to run a
transformation program for becoming an efficient, integrated, and sustainable fertilizer producer. The
problems that occur in the inbound logistics activities at the case company are the raw materials stored in
warehouses often overcapacity, causing a material accumulation when there is new raw material arriving at
the port. Therefore, warehouses need to periodically reorganize their storage in order to keep operating
inefficient manner. This research aims to help overcome the problems that occur in the company by examining
several alternative solutions in inbound logistics activities to reduce material transferred between port,
production warehouses, and buffer warehouses by using model simulation method. The method that is going
to be used to solve this problem is the Discrete Event Simulation (DES), in which the improvement system
does not disrupt the existing system and doesn't cost too much time and money. This research proposed a
scenario of warehouse capacity re-allocation for raw materials by prioritizing the highest frequency of raw
material arrival. By using the improved system, it reduces the total average volume of material transferred
from the port to production warehouses by 13.29%, from port to buffer warehouses by 10.21% and from
buffer warehouses to production warehouses by 17.43%.
1 INTRODUCTION
The supply chain system in the fertilizer industry is
quite complex because it involves many internal
logistics activities, raw material transportation, and
warehouse management. The costs absorbed by
activities in supply chain functions are generally very
dominant so that if the company has an efficiency
program, then the greatest improvement potential is
in activities related to supply chain functions. Thus,
the product can be produced and distributed in the
right amount and timely manner to minimize costs
and provide service satisfaction to consumers with the
aim of achieving a minimum overall cost of the
system and also achieving the desired service level
(Levi, 2000).
Successful supply chain management is a very
complex job because there are numerous players
involved, and each of them has different interests and
goals. Those conditions are a challenge that must be
faced by Pupuk Indonesia Holding Company as a
fertilizer producer on behalf of the Indonesian
Government, an agrarian country where the
agricultural sector plays an important rule that
influences the national economy. PT Petrokimia
Gresik is one of the largest Indonesian fertilizer
producers established under the auspices of PT Pupuk
Indonesia. PT Petrokimia Gresik is the complete
fertilizer producer in Indonesia, which produces
various kinds of fertilizers and chemical products for
agro-industrial solutions that have a cross-country
supply chain network and distribution throughout the
country.
The problem that occurs in the inbound logistics
activities of the case company is the raw materials
stored in warehouses are often overcapacity, causing
a material accumulation when there are new raw
materials arriving at the port. One indication that
causes overcapacity in warehouses is the presence of
several raw materials stored in warehouses that are
12
Dinaryo, M., Pujawan, I. and Arvitrida, N.
Simulation Modelling of Warehouse Capacity Re-allocation to Improve Inbound Logistics Performance: A Study Case.
DOI: 10.5220/0009403300120020
In Proceedings of the 1st International Conference on Industrial Technology (ICONIT 2019), pages 12-20
ISBN: 978-989-758-434-3
Copyright
c
2020 by SCITEPRESS – Science and Technology Publications, Lda. All rights reserved

not intended. This has a negative impact because it
can cause the ship that has arrived at the port to have
to wait to unload the material.
Due to seasonal fluctuations in demand or high
inventory levels, initially assigned storage in the
warehouse may become suboptimal from time to
time. Fragmented storage is a particular issue, where
the optimal storage location of a product is not only
dependent on its turn-over rate but also on the storage
locations of items that frequently occur in the same
picking job (Kofler, 2010). Therefore, warehouses
need to periodically reorganize their storage in order
to keep operating inefficient manner.
Experiment with the operation of the real system
to study the effects of the change can lead to a more
efficient and advanced system than the current one.
But it is not a wise idea to implement the change
directly in the real system as it can cause unexpected
results, which ultimately disrupts the working of the
system. Therefore, a model is defined as a
representation of a system for the purpose of studying
the system. The model should be built so as to permit
valid conclusions to be drawn about the real system.
Sometimes, different models of the same system are
required to be built to study different aspects of the
real system.
2 LITERATURE REVIEW
This research is a development from some similar
previous researches. The previous researches are
mostly developed on the uncertain scope of inbound
activity. Some similar previous research only
discussed one or two of three the scope of inbound
logistics activities such as ports, warehouses, and
transportation. There is no research that combines
these three scopes of inbound logistic activities.
Therefore, to develop this research using three the
scope of inbound logistics activities such as ports,
warehouses, and transportation.
The purpose of this research is to find the best
alternative solutions in order to improve the
performance of the inbound logistic activity of the
case company. This research is used Discrete Event
Simulation (DES) because the improvement system
does not disrupt the existing system and does not cost
too much time and money. Besides that, DES can
provide some information about the behavior and
performance of real processes in the company and
predict the occurrence of the problem in existing
conditions.
2.1 Logistics and Supply Chain
Management (SCM)
Effective management of infrastructure, materials,
technology, and people is utterly needed to integrate
the flows between material, money, and information
because interruptions in any of the above four flows
affect an organization's raw materials supply
(purchasing), manufacturing (operations) and
marketing (distribution) functions. According to the
Council of Supply Chain Management Professionals
(2010), activities that can be managed in the supply
chain consist of planning, management, and
coordination from procurement, conversion, and
logistics management activities.
2.2 Inbound Logistics
Harrington (2008) explained that focusing on
logistics and inbound logistics planning gives firms
an opportunity for substantial savings and attains
supply chain reliability. Even though there is no
standard definition of inbound logistics, three
significant inbound logistics practices can be
identified, and these are transportation, inventory
control, and warehousing (Baker et al., 2008).
Inbound logistics practices are reliant on existing
infrastructure like warehouse building, terminuses,
highways, communication networks, and energy
supply amenities that need long-term investment
from both governments and the private sector. They
also involve long lead-times to develop and thereafter
maintenance investments over time, which determine
the quality of entire logistics operations (Blecker el
at. 2014).
2.3 System and Model
There are several ways to design, analyze, and
operate a system; one of those is by modeling the
system. System modeling is a very useful tool for
analyzing and designing systems. The model can
show how an operation of the system works and
analyze the problems and potential improvements
that can be made. Model is defined as a logical
description of how the system works or the
components interact. By making a model of a system,
it is expected to be easier to carry out analysis (Law
and Kelton, 1991).
Simulation Modelling of Warehouse Capacity Re-allocation to Improve Inbound Logistics Performance: A Study Case
13
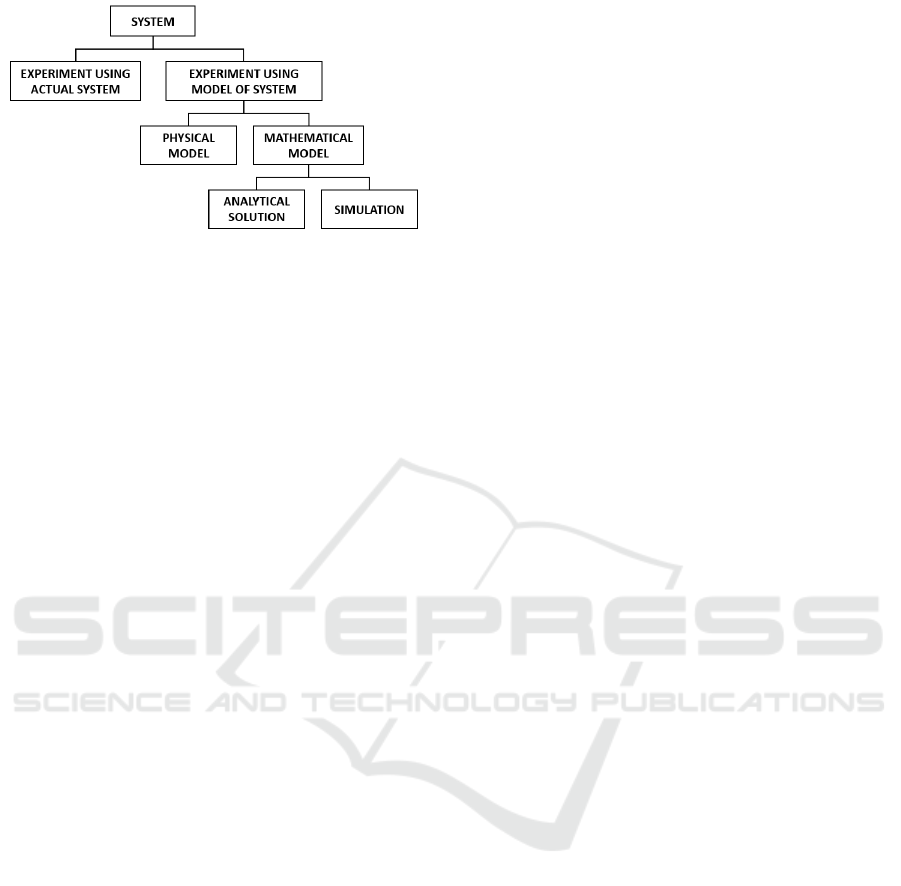
Figure 1: Various Ways to Learn System
(Law and Kelton, 1991)
Figure 1 shows an overview and an explanation
about how to study the system. The system in this
research can be explained as Experiment Using
Actual System vs. Experiment Using Model of
System. It means if a system physically allows and
does not cost a lot to operate with the conditions
(scenario) that we want, then this method is the best
way because the results of this experiment really fit
the system. But those systems rarely exist, and
stopping the operation of the system for experimental
purposes will be very costly. In addition, for systems
that still not yet exist or systems that are still in
design, experiments with actual systems clearly
cannot be done, so the only way is to use the model
as a representation of the actual system.
2.4 Model Simulation
2.4.1 Discrete Event Simulation (DES)
DES (Discrete Event Simulation) is the process of
codifying the behavior of a complex system as an
ordered sequence of well-defined events. In this
context, an event comprises a specific change
system's state at a specific point in time. DES
modelers often invest a great deal of effort analyzing
historical data to capture process means, variances,
and distributions, but once entered into the model,
these parameters often remain fixed. There is less
emphasis on DES models on identifying events that
might trigger changes in the model's parameters.
The experiment requires the operation of the real
system to study the effects of the change, which can
lead to a more efficient and advanced system than the
current one. But it is not a wise idea to implement the
change directly in the real system as it can cause
unexpected results, which ultimately disrupts the
working of the system. A model is defined as a
representation of a system for the purpose of studying
the system. The model should be built so as to permit
valid conclusions to be drawn about the real system.
Sometimes, different models of the same system are
required to be built to study different aspects of the
real system.
A discrete-event simulation model is both
stochastic and dynamic with the special property that
the changes occur at discrete times only. A stochastic
simulation model has one or more random variables
as inputs. Random inputs lead to random outputs.
Since the outputs are random, they can be treated only
as approximations of the true characteristics of a
model.
2.4.2 Arena
The arena is a model builder program and also as a
simulator. The arena is a mixture of two categories, a
combination of ease of use that is owned by high-
level programs and flexibility that characterizes
general-purpose simulation language. Arena users
can build models, templates and can even create their
own modules if needed using the help of programs
such as Visual Basic, FORTRAN, and C / C ++.
2.4.3 Verification and Validating
The verification and validation process is a simulation
phase that is carried out to test whether the simulation
model and the conceptual model have represented the
system in its actual state. In the process of converting
conceptual models into simulation models, there are
many possible errors.
2.5 Similar Research
The previous researches are mostly developed on the
uncertain scope of inbound activity. Some similar
previous research only discussed one or two of three
the scope of inbound logistics activities such as ports,
warehouses, and transportation. There is no research
that combines these three scopes of inbound logistics
activities, such as:
1. Jean Philippe et al., 2007. “A Simulation
Model to Improve Warehouse Operations."
The scope is the warehouse. Develops a DES
model of the logistic operations that could help
managers in assessing the performance of
different storing and picking strategies and
evaluate the specific strategies to share the
storage space.
2. Lauri Lattila, 2012. “Improving Transportation
and Warehousing Efficiency with Simulation-
Based Decision Support System." Scopes are
transportation and warehouse. Argued that
ICONIT 2019 - International Conference on Industrial Technology
14

simulation-based decision support systems
need to take various issues into account to
make a functioning decision support system.
3. Mariam Kotachi et al., 2013. “Simulation
Modelling and Analysis of Complex Port
Operations with Multimodal Transportation."
The scope is port. Analyze the complex
operations involved, as well as the utilization
of resources. The outcome of the port flow is
various scenarios motivated by changes in
different inputs to measure their impact on the
outputs that include throughput, resource
utilization, and waiting times.
This research is a development from some similar
previous researches and discussed three the scope of
inbound logistics activities such as ports, warehouses,
and transportation. This research is to find the best
alternative solutions in order to improve the
performance of the inbound logistic activity of the
fertilizer company.
3 RESEARCH METHODOLOGY
3.1 Preliminary Study Phase
The preliminary study is performed for studying the
system element in the research object. The system
elements are system objectives, system boundaries,
input and output, and system activities.
3.2 Data Collection & Processing Phase
The collection of data is done to support the
conducted research. Data is collected through
historical data of the case company, interviews with
related parties, and supporting sources on the internet.
All data that has been collected then processed to
find the type of distribution fitting. The results of this
data processing are the results of distribution fitting
for material arrival and material transfer. Numerical
data that need to be done with the fitting distribution
before became the input variable are the inter-arrival
time of raw material in port, raw material supply, and
raw material demand. Fitting distribution needed to
describe the uncertain event, so the distribution will
describe the frequencies of future repetitions of the
experiment. Fitting distribution is done by input the
two years of historical data into the input analyzer in
Arena Software. The distribution will follow the best
fit distribution or the theoretical distribution, which
has been used before for certain conditions.
3.3 Simulation Phase
At this stage, the design of the conceptual model and
simulation model is designed, which describes the
actual process activities. The real system is built into
a model through several processes.
3.3.1 Conceptual Model Development
A conceptual model is made in accordance with the
current conditions of ship unloading system at the
Port of company case, the transportation scheme of
raw materials to storage warehouses, and material
transfers that occur between production warehouses
and buffer warehouses. This conceptual model will
later be used as a reference for the simulation model
carried out on Arena software.
3.3.2 Simulation Model Development
This research uses Arena Software to run the
simulation. Based on the modules chosen in the
simulation model built, the data that has been
collected acts as the input in the development of the
model.
3.3.3 Verification
There are three ways to do the verification process.
First, debug the model to know whether the model has
a syntax error. Second, by observing the animation
movement between models. Third, check the output
reasonableness from the simulation result.
3.3.4 Number of Replication Calculation
The number of replications and half-width should be
determined so that the simulation results in a good
estimation interval that is convincing for decision
making. Determining the number of replications is
started by setting the initial number of replication (n).
After the result of running n replications is obtained,
the half-width (hw) should be calculated. Then the
desired half-width (hw’) should be calculated by
setting the absolute error (e) to be compared later.
3.3.5 Validation
Validation is done by comparing the results of the
demand fulfillment material in the simulation running
model with the historic data of 2017-2018 demand
fulfillment material obtained from the Port
Department. Paired-t-test is done to know whether the
real system and simulation model are not significantly
Simulation Modelling of Warehouse Capacity Re-allocation to Improve Inbound Logistics Performance: A Study Case
15
different so that the simulation model can be declared
as valid.
3.3.6 Scenario Design and Run Experiments
This research proposes a scenario for improvement
that will be used as a recommendation for
improvement in the systems. The scenario made into
a condition to prioritizing the allocation of materials
that have the highest frequency of arrival.
The scenario is developed by taking into account
the frequency of raw materials arrival. Raw materials
that have the highest frequency of arrival will be
prioritized to be stored in the nearest Production
warehouse, and if possible, it not stored in buffer
warehouses.
3.3.7 Output Analysis
The output result of the scenarios is calculated as the
total volume of material transferred. Then, Paired-t-
test or ANOVA hypothesis analysis is used to know
whether the scenario shows a significant difference
with the existing condition. Paired-t-test or ANOVA
hypothesis testing analysis is performed based on the
number of population or scenario compared.
4 MODEL
CONCEPTUALIZATION
4.1 Overview of Inbound Logistic
Process
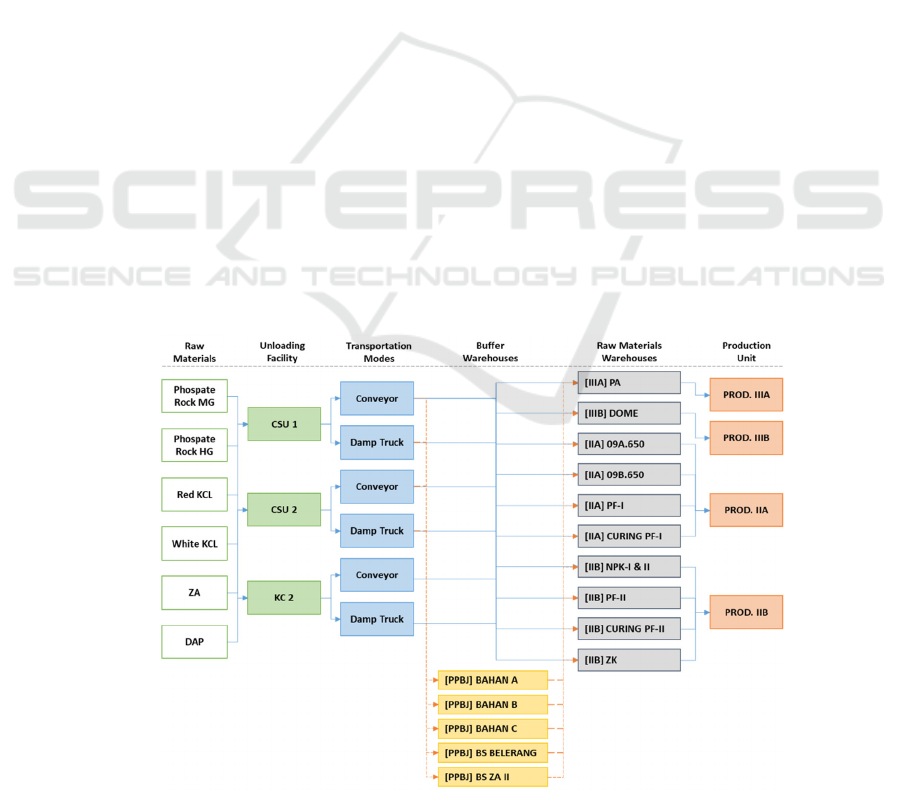
The raw material used to produce fertilizer is
Phosphate Rock High Grade (PR HG), Phosphate
Rock Medium Grade (PR MG), Red KCl, White KCl,
DAP, and ZA. When raw materials arrive at the port,
the company receives raw materials and carries out
unloading operations using port facilities. After being
dismantled, the raw materials are then distributed
using transportation modes in the form of conveyors
and trucks. The choice of transport mode prioritizes
the use of a conveyor. Since not all warehouses are
connected with conveyors and if the conveyor line
has been used to transport another raw material, then
the transportation mode used in the truck.
The raw material will later be transported to the
production warehouse in each production unit to be
used as a basic material in the fertilizer production
process. The Production Warehouse, which is located
directly in contact with the factory, has the highest
priority to receive the arrival of raw materials from
the port. If these Production Warehouses are unable
to accommodate the incoming raw materials, the
Buffer Warehouse is used as a second-choice
destination for raw materials that cannot be
accommodated in the Production Warehouse. The
detailed process of raw material handling at inbound
logistics in case the company is shown in Figure 2.
Figure 2: Raw Material Handling Process Flow
ICONIT 2019 - International Conference on Industrial Technology
16
4.2 Element of System
Elements of systems include entities, activities,
resources, and controls.
1. The entity used in this system is the raw
material used for fertilizer production. The type
of raw material are, Phosphate Rock High
Grade (PR HG), Phosphate Rock Medium
Grade (PR MG), Red KCl, White KCl, DAP,
and ZA.
2. Activities observed in the system are systems
for raw materials handling from unloading in
ports, transportation from ports with conveyors
or trucks, to placement in raw material
warehouses.
3. The resources used in this system are facilities
at the port (material unloading facilities;
Kangaroo Crane and CSU), transportation
modes (conveyors and trucks) and raw material
warehousing facilities
4. The control used in this handling system is the
assignment of allocating material carried out
from port to the raw material warehouse, which
has the highest availability of space and
readiness by considering the volume
transported.
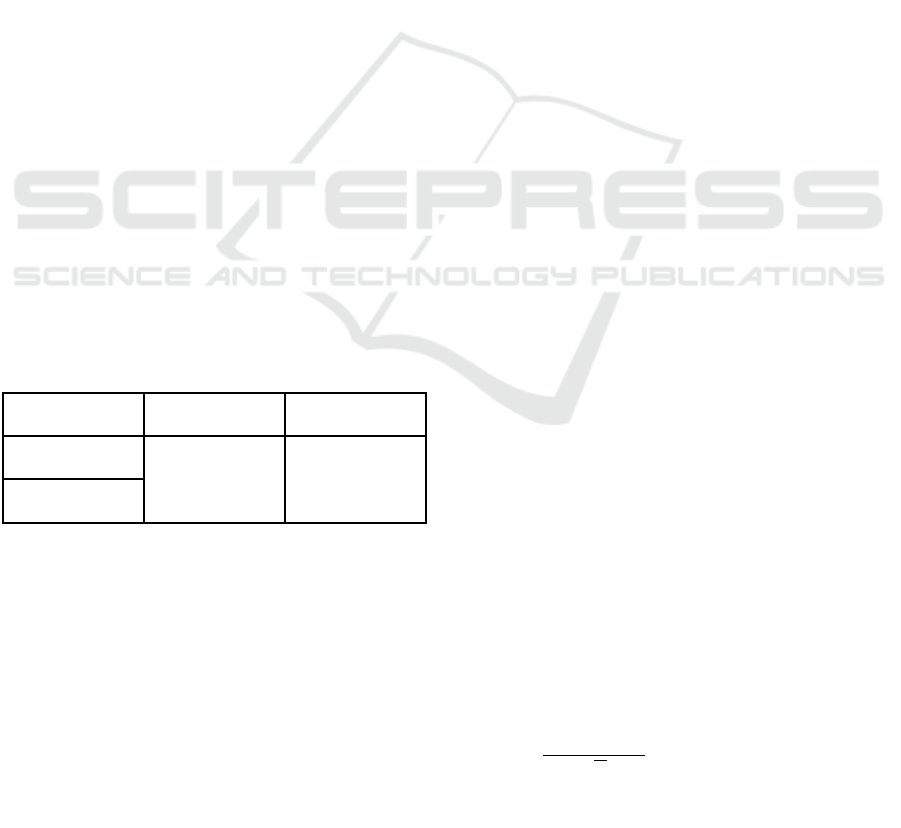
4.3 Variable of Systems
The variables of systems in this research's simulation
consist of decision variables and response variables.
More detailed, as seen in Table 1.
Table 1: Variables System for Raw Material Handling
Scope
Decision
Variables
Response
Variables
Transporting to
Warehouses
Raw Material
Allocation
Volume
The volume of
Transferred
Raw Materials
Warehouse
Allocation
5 SIMULATION MODEL AND
ANALYSIS
5.1 Model Verification
The model's verification implies that the simulation
model is error-free, and according to the conceptual
model, the logic is right. To check the syntax error in
the simulation model is by debugging in the software.
The verification of semantic error is done by
verifying whether the logic in the model is in
accordance with the logic it is supposed to be.
Checking the reasonableness in the simulation
report in the research is done by checking the total
demand fulfillment in the factory for two years, where
it must be less than or equals with total entities created
by creating a module as the factory demand.
Another way to check for reasonableness in the
simulation report is to see if there's an entity that
needs to be allocated to one of the production
warehouses, it should be allocated to the one that is
the nearest one from the port. In a simulation report,
it can be seen from the results in two years that there
is no allocation of entities in the production
warehouse that skips the order of the nearest
warehouse. For example, red KCl is allocated in
warehouse 09A.650, 09B.650, and 02.650 for
production warehouse IIA, arranged from the nearest
one, respectively. It is impossible if in two years total
red KCl entities are allocated in warehouse 09B.650
is equal to zero while the total red KCl entities
allocated in warehouse 02.650 is more than zero.
5.2 Number of Replications
The number of replications is determined to know
how many replications are needed in the simulation,
so the simulation results will represent different
patterns of supply and demand every day. The method
used to determine the number of replications in this
research is using the total demand fulfillment of raw
material. In this research, the method that is used to
determine the number of replication is an absolute
error with α = 5%.
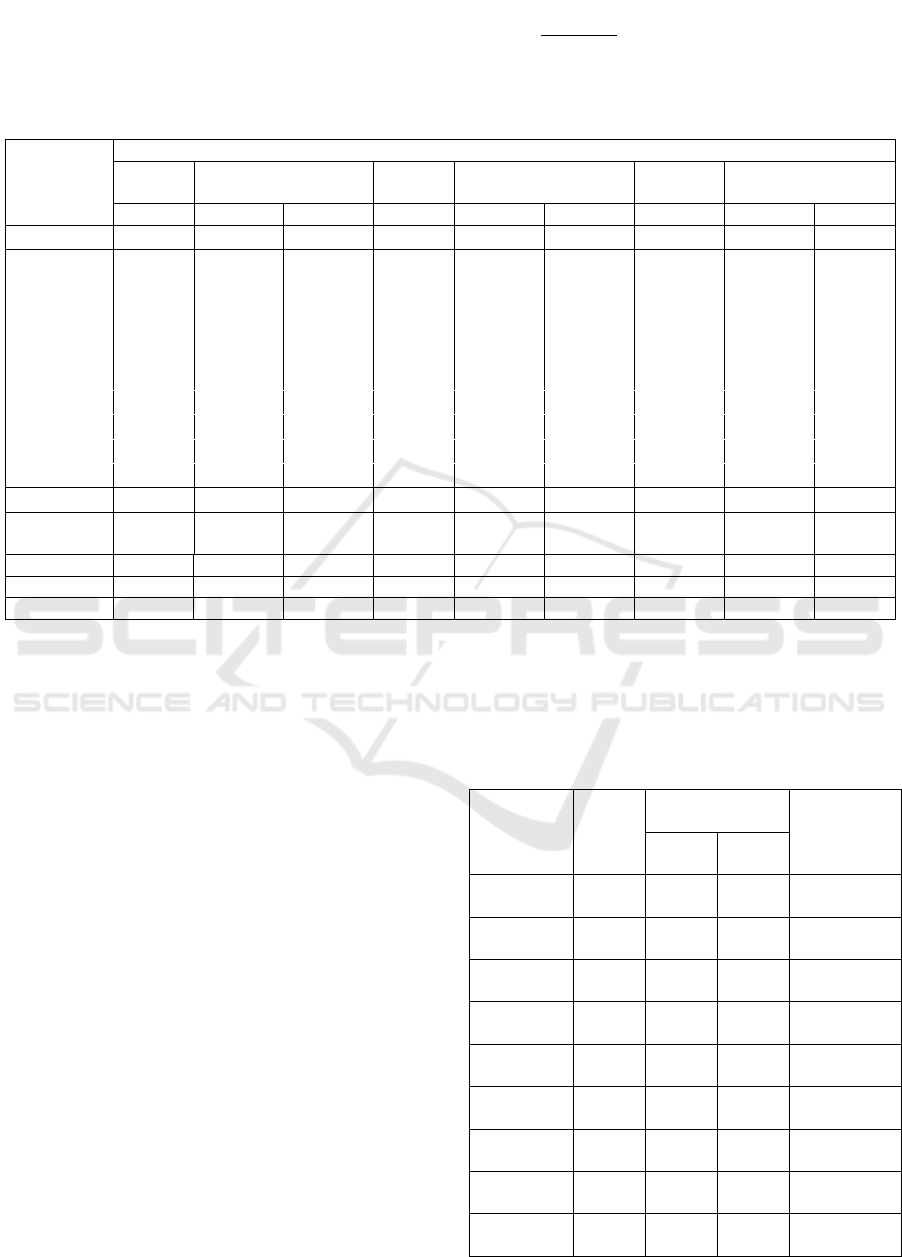
The simulation is run with ten replications (n) and
resulting the total demand fulfillment for one year in
ten replications. Then the half-width of the result of
ten replications simulation is calculated with equation
1 for all raw materials with hw’ has the desired error
value does not exceed 5% from historical data as
shown at equation 2. The number of replications (n’)
is calculated with equation 3. The result of the
calculation can be seen in Table 2.
Based on the calculation in Table 2, every raw
material has a different value of n’. To fulfill the
requirement for every raw material, then the highest
value of n’ is used as the number of replications for
simulation. Therefore, the number of replications
used in this research is 10 replications.
𝒉𝒘
𝒕
𝑵𝟏,
𝜶
𝟐
𝑺
√
𝒏
(1)
𝒉𝒘
𝟓% total demand fulfillment
(2)
Simulation Modelling of Warehouse Capacity Re-allocation to Improve Inbound Logistics Performance: A Study Case
17
𝒏
𝒁
𝜶
𝟐
𝑺
𝒉𝒘′
𝟐
(3)
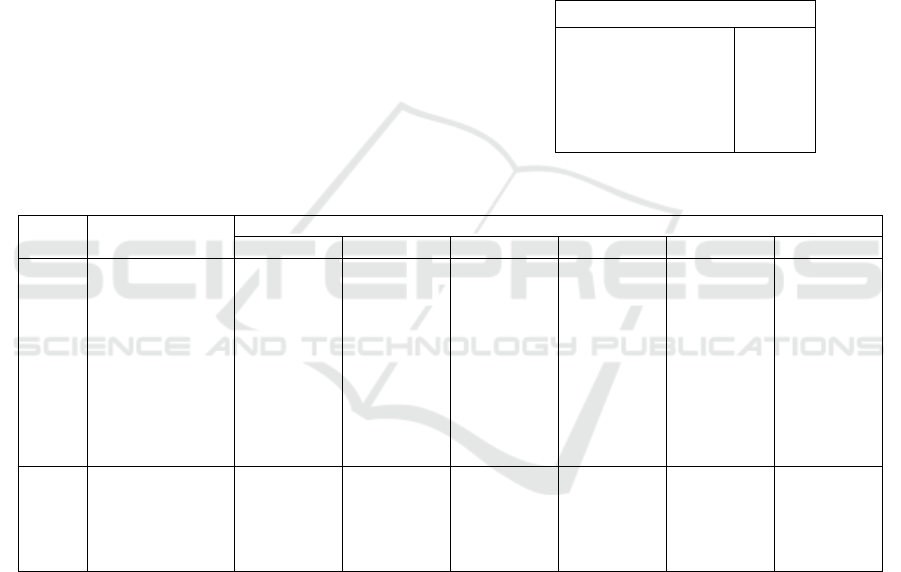
Table 2: Result of Demand Fulfilment Simulation with 10 Replications
Replication
Demand Fulfillment (Tons)
DAP Red KCl
White
KCl
PR HG PR MG ZA
IIB IIA IIB IIB IIIB IIIA IIA IIA IIB
Existing 182,586 318,630 249,964 84,552 538,697 501,567 294,716 251,833 190,140
1 186,600 330,700 254,800 85,150 472,550 516,250 313,650 257,200 192,700
2 171,500 333,200 251,150 87,100 479,900 509,700 296,350 208,700 160,400
3 168,350 301,550 246,100 90,000 526,100 481,500 301,650 250,900 193,500
4 179,450 324,550 252,600 85,650 512,400 504,250 295,050 239,600 178,650
5 183,050 296,850 226,150 90,450 543,300 505,900 256,250 250,050 178,750
6 166,250 323,650 245,150 80,950 481,900 509,600 296,300 238,900 180,500
7 165,650 323,100 248,350 80,050 557,250 528,350 288,100 254,250 190,800
8 178,000 286,000 252,700 84,300 553,200 511,300 248,800 252,650 182,850
9 147,950 264,400 232,100 84,100 530,750 481,750 292,300 254,000 185,100
10 194,150 323,450 242,800 80,200 543,800 464,650 275,150 258,600 194,300
Average 174,095 310,745 245,190 84,795 520,115 501,325 286,360 246,485 183,755
Standard
Deviation
13,076 22,636 9,366 3,718 31,834 19,270 20,369 14,837 10,250
hw 0.05 0.05 0.03 0.03 0.04 0.03 0.05 0.04 0.04
hw' 9,129 15931.48 12498.08 4227.60 26934.84 25078.33 14735.80 12591.66 9506.99
n’ 10 10 3 4 7 3 10 7 6
5.3 Validation
The method used for validation is using Paired-t-test
hypothesis testing with a parameter used for
validation is the demand fulfillment of each raw
material in each factory. The demand fulfillment of
each raw material in each factory considered can
capture the whole behavior of the system, starts from
the supply up to the demand. The recapitulation of
total raw material demand fulfillment in factories is
presented in Table 2.
In this hypothesis testing Paired-t-test, the null
hypothesis is that there is no significant difference
between the average results of the simulation results
with the existing condition. The alternative
hypothesis is that there is a significant difference
between the average results of the simulation results
with the existing condition.
H0: 𝝁
𝟏
𝝁
𝟐
H1: 𝝁
𝟏
𝝁
𝟐
The recapitulation of hypothesis testing using the
Paired-t-test is simplified in Table 3. Based on the
result of hypothesis testing, the null hypothesis is
accepted because the t stat falls between the range -
2.101 < t Stat < 2.101. Such a condition shows that
there is no significant difference between the actual
and the simulation system.
Table 3: Validation Hypothesis Testing Result
Validation
Parameter
t Stat
t Critical two-
tail
Conclusion
Lower
Limit
Upper
Limit
DAP at IIB -2.054 -2.101 2.101 Accept Ho
Red KCl at
IIA
-1.101 -2.101 2.101 Accept Ho
Red KCl at
IIB
-1.611 -2.101 2.101 Accept Ho
White KCl
at IIB
0.207 -2.101 2.101 Accept Ho
PR HG at
IIIB
-1.864 -2.101 2.101 Accept Ho
PR HG at
IIIA
-0.040 -2.101 2.101 Accept Ho
PR MG at
IIA
-1.297 -2.101 2.101 Accept Ho
ZA at IIA 0.104 -2.101 2.101 Accept Ho
ZA at IIB -1.970 -2.101 2.101 Accept Ho
ICONIT 2019 - International Conference on Industrial Technology
18
6 SCENARIO DEVELOPMENT
AND ANALYSIS
6.1 Scenario Development
The proposed scenario in this study aims to minimize
the total transferred volume of raw material that
occurs between the warehouses, especially in the
buffer warehouses, by finding the best configuration
of raw material composition. Scenarios are developed
by taking into account the variables that cause the
accumulation of raw materials when in port,
transportation, and storage. This is in the spotlight
because to place raw materials in buffer warehouses
requires a considerable distance of transportation
while the production warehouse capacity is
insufficient to accommodate all existing raw
materials. The scenario condition design in this
research is by prioritizing raw material movement
based on the highest frequency of shipment arrival.
The scenario is developed by taking into account
the frequency of raw materials arrival. Raw materials
that have the highest frequency of arrival will be
prioritized to be stored in the nearest Production
warehouse, and if possible, it not stored in buffer
warehouses. Table 4 shows the rank of the material's
arrival frequency until August 2018.
For scenario development, Phosphate Rock High
Grade must be prioritized to be stored in the nearest
production warehouse from the port and has a larger
storage portion than the other raw materials. The raw
material in the next priority then placed in the nearest
production warehouse, which still has storage
capacity for its type as the previous scenario
adjustment method. Table 5 shows the new raw
material allocation.
Table 4: Rank of Raw Material Arrival Frequency
Arrival Frequency
Phosphate Rock HG 66
ZA 38
Red KCl 35
DAP 13
Phosphate Rock MG 12
White KCl 5
Table 5: New Raw Material Capacity Allocation
6.2 Scenario Significance Test
A significance test between the existing system and
scenario is performed to provide better decision
making on the selected scenario. Simulation of
scenario resulting in 3 parameters of volume
transferred material, which will be tested by using
ANOVA (Analysis of Variance). ANOVA Test is the
method used to compare the scenarios with
confidence level 95%. This significance test is to use
the hypothesis statement as follows.
H0: 𝜇
𝜇
H1: 𝑎𝑡 𝑙𝑒𝑎𝑠𝑡 𝑜𝑛𝑒 𝑝𝑜𝑝𝑢𝑙𝑎𝑡𝑖𝑜𝑛
𝑖𝑠 𝑠𝑖𝑔𝑛𝑖𝑓𝑖𝑐𝑎𝑛𝑡 𝑑𝑖𝑓𝑓𝑒𝑟𝑒𝑛𝑡
The result of the parameters significance test
between existing conditions and scenarios can be seen
in Table 6. It shows that the F value is larger than F
critical only on Parameter 1. It can be said, there is at
least one population is significantly different in
Parameter 1. Meanwhile, for Parameter 2 and 3, there
is no significant different. Therefore, scenario can
only be performed for Parameter 1
Dept Warehouses
New Ca
p
acit
y
Allocation
(
Tons
)
PR
(
HG
)
PR
(
MG
)
Red KCl White KCl ZA DAP
IIA 09A.650
16,000
IIA 09B.650
2,000 23,000
IIA 02.650
7,000 9,000
IIA PF-I
40,000
IIB Z
K
500
IIA CURING PF-I
4,000
IIB CURING PF-II
3,197 4,803
IIIA PA 110,000
IIIB DOME 50,000
IIB NP
K
-I & 2
14,000 2,000 2,000
Buffe
r
PF-II
45,000
Buffe
r
BS BELERANG
8,000
Buffe
r
BUFFER A 10,850 12,934 24,216
Buffe
r
BUFFER B
19,262
19,301
Buffe
r
BUFFER C
32,500
Simulation Modelling of Warehouse Capacity Re-allocation to Improve Inbound Logistics Performance: A Study Case
19
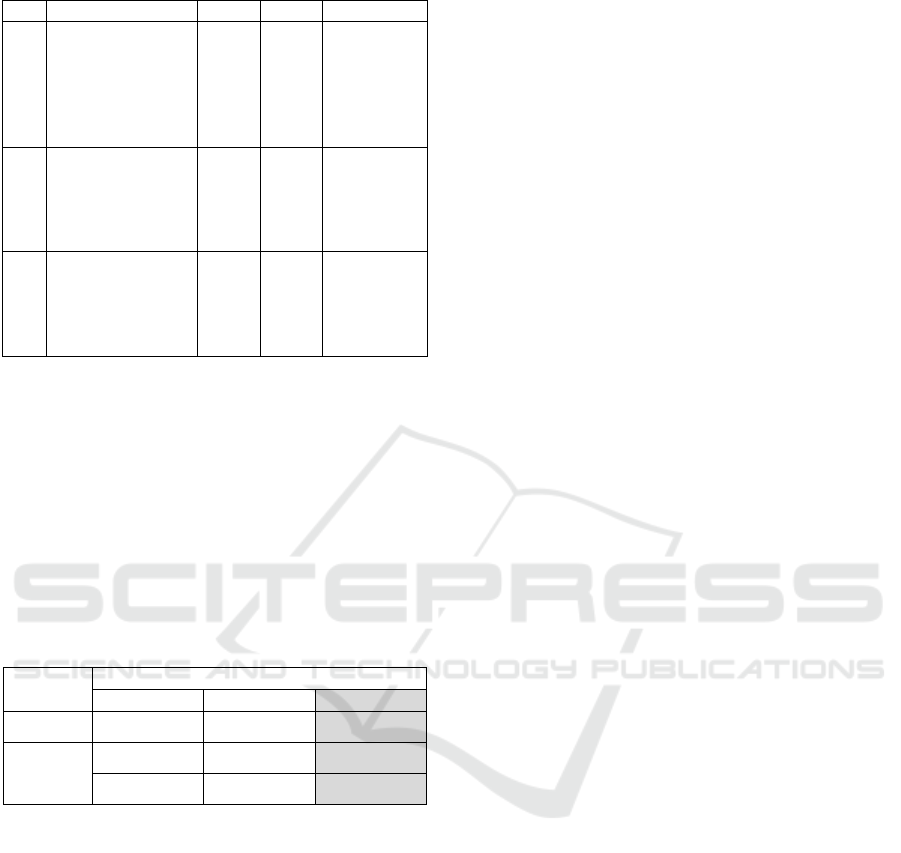
Table 6: Parameter Validation Hypothesis Testing Result
6.3 Scenario Analysis
The scenario model is developed by modifying the
raw material allocation in each production warehouse
and buffer warehouse. There is an obvious interest in
identifying the best out of a group of scenarios by
inspecting the mean results for each scenario. Table 7
shows that the proposed scenario gives the decreasing
result for the mean value for material transferred from
buffer warehouse to production warehouse.
Table 7: Comparison of Mean Value
Parameters
3 2 1
Existing 2,012,385 1,665,415 425,130
Scenario
1,744,895 1,495,345
351,050
-13.29% -10.21% -17.43%
The proposed scenario shows the minimum result
of the total volume of materials transferred under the
same condition of supply, demand, and material
handling equipment resources are available. The
scenario might show different performances if the
input of the system changes.
7 CONCLUSIONS AND
RECOMMENDATIONS
7.1 Conclusions
Based on calculations and discussions that have been
done, it can be concluded that:
1. The best warehouse capacity allocation is by
prioritizing the raw material that has the highest
frequency of shipment arrival to be allocated in
the nearest production warehouse and nearest
buffer warehouse from the port.
2. The improvement in warehouse allocation is
reduced an average of 17.43% of raw material
transferred from buffer warehouse to
production warehouse compared to the existing
condition.
3. The improvement in warehouse allocation has
reduced an average of 10.21% of raw material
transferred from the port to buffer warehouse
compared to the existing condition.
4. The improvement in warehouse allocation is
reduced an average of 13.29% of raw material
transferred from port to production warehouse
compared to the existing condition.
7.2 Recommendations
Recommendation for future similar research are:
1 Consider the improvement based on the cost
that occurs during the material transferred
activity.
2. Develop scenarios by investing additional
handling equipment such as conveyor line and
discharging equipment at the port.
REFERENCES
Blecker, T., Kersten, W., and Ringle, W. (2014). Innovative
Methods in Logistics and Supply Chain Management.
1st Edition. Hamburg, Berlin.
Council of Supply Chain Management Professionals.
(2010). Supply Chain Management Terms and
Glossary.
http://cscmp.org/sites/default/files/user_uploads/resour
ces/downloads/glossary.pdf. Lastly visited October 8th
2018.
Harrington, L. (2008). The Evolution of Inbound Logistics-
Choosing Inbound: Natural Selection.
http://www.inboundlogistics.com/cms/article/the-
evolution-of-inboundlogistics-choosing-inbound-
natural-selection/. Lastly visited October 8th 2018.
Kofler, M., Beham, A., Wagner, S., Affenzeller, M., and
Reitinger, C. (2010). Reassigning Storage Locations in
a Warehouse to Optimize the Order Picking Process.
Technical Report HEAL-2010-181. Rusia.
Law, A.M., and Kelton, W.D. (1991). Simulation
Modelling and Analysis. 2nd Edition. McGraw-Hill
International.
No Paramete
r
F F crit Conclusion
1
Material
Transferred from
Buffer
Warehouse to
Production
Warehouse
4.467 2.579 Reject Ho
2
Material
Transferred from
Port Warehouse
to Buffer
Warehouse
2.033 2.579 Accept Ho
3
Material
Transferred from
Port Warehouse
to Production
Warehouse
2.079 2.579 Accept Ho
ICONIT 2019 - International Conference on Industrial Technology
20
