
Perception and Reality of Corruption: A Spatiotemporal Analysis
in Indonesia Sub-national Level
Zuhairan Yunmi Yunan
Ph.D. Candidate at the National Centre for Social and Economic Modelling
University of Canberra, Australia
Keywords: Corruption Patterns, Spatial Distribution, Regional Perception Indicators, A Judicial Report
Abstract: This paper employs regional perception and judicial report of corruption to investigate the patterns of
corruption at districts and municipalities level in Indonesia. To describe the distribution of the existing data,
spatial distribution has been utilized supported by the correlation for each measurement. Spatiotemporal
analysis has been used to see changes among regions or overtimes. The number of corruption incidents and
state financial loss increased significantly in Indonesia while the perception is showing a better condition
against corruption. The comparison among regions shows the perceptions toward the level of corruption tend
to be higher in the region, which has fewer incidents of corruption. However, corruption perceptions tend to
improve when corruption incidents/value increase in one particular region, indicating the effectiveness of
judicial systems enhances business sectors' perception of corruption over time. The main lesson highlighted
from this paper is the necessity for regional corruption measurement to explain corruption patterns in
Indonesia.
1 INTRODUCTION
Corruption is extraordinary and unique since it is hard
to determine the right victims afflicted by corruption.
The objective data are difficult to obtain, and to date,
all existing approaches have not yet described the
actual level of corruption. The measurement of
corruption should be emphasized that there is no
general agreement on corruption definition in the
world that ultimately affects the level of corruption in
each country (Johnston, 1996, 2002, 2010; Jain, 2001;
Kurer, 2005; Brown, 2006; Miller, 2006; Philp,
2006). Many factors that cause corruption are very
difficult to define or measure. Besides, it is hidden
activities; the acceptance of corruption is different
based on variations in culture, law, customs
(Svensson, 2005). In addition, the definition of
corruption in either explicitly or comprehensively is
not clearly explained by the United Nation
Convention against Corruption (UNCAC). Therefore,
measuring the real corruption is exceptionally
challenging as it is an essential part for analyzing the
impact of corruption that can be used to design
corruption eradication policy.
The debate on corruption measurement is very
interesting among economists since corruption has an
impact on economic variables and vice versa.
Although it is impossible to measure real corruption
(Johnston and Kpundeh, 2002), some scholars claim
that measuring corruption is reasonable since
monitoring corruption can be done through various
approaches and indicators in either subjective or
objective, aggregate or disaggregate, cross as well as
the single country (Kaufmann, 2005; Kaufmann,
Kraay and Mastruzzi, 2007). There are some reasons
why it is important to measure this phenomenon.
First, it is essential to figure out the problem scale
since what it is dealing with can be recognized
(Belousova, Goel, and Korhonen, 2016). Second, to
see whether there are any clear patterns to identify
explanatory variables that explains why and where
corruption developed (Mauro, 1995). Third,
corruption measurement can help policymakers
where they need to take any actions and examine
whether it has been effective or not (Rose and
Mishler, 2010; Bohn, 2012; Gutmann, Padovano and
Voigt, 2015).
In general, the explanation of corruption
measurement can be narrated by dividing it into four
possible approaches, i.e., perception indicators,
surveys, indirect and outcome indicators (Kenny,
2009), judicial system reports (Bhargava and
220
Yunan, Z.
Perception and Reality of Corruption: A Spatiotemporal Analysis in Indonesia Sub-national Level.
DOI: 10.5220/0009402202200228
In Proceedings of the 1st International Conference on Anti-Corruption and Integrity (ICOACI 2019), pages 220-228
ISBN: 978-989-758-461-9
Copyright
c
2020 by SCITEPRESS – Science and Technology Publications, Lda. All rights reserved

Bolongaita, 2004; Del Monte and Papagni, 2007).
Although corruption is a part of criminal activities, it
is difficult to find the studies describing the pattern of
corruption by regional mapping using those
approaches.
In the context of Indonesia, since the system of
governance has changed to decentralization after a
massive protest in reformation 1998, much of the
government authorities have been transferred to the
district level, and the corruption pattern has changed
from centralized (Mcleod, 2000) to be spread to the
regional level. However, studies on corruption in
Indonesia have not discussed how the pattern of
corruption in this era. The country that has more than
17,000 islands with diverse cultures and languages, it
is likely that corruption level is varied in a different
area of the country. Current measurements are not
able to describe the level of corruption in the regional
context (districts or municipalities). Therefore, it is
important to know how the level of corruption in each
area in Indonesia. Consequently, understanding
corruption in Indonesia requires investigation at its
regional level.
This paper provides information on how the
pattern of corruption in Indonesia's districts and
municipalities has been changed since
decentralization. Following this, it is structured into
four sections. In the second section, it elaborates a
literature review discussing corruption definition, the
concept of perception indicators as well as judicial
system reports, and spatiotemporal analysis in the
context of a criminal issue. Data and method applied
to analyze this paper are explained in the third
section. Findings of this research are written in the
fourth section discussing the international approach
on corruption measurement, the distribution of
judicial report on corruption, regional perception, and
reality on corruption. The fifth section presents the
conclusion as well as contribution and
recommendation for future empirical studies on
corruption measurement in Indonesia region.
2 LITERATURE REVIEW
2.1 Corruption Definition
Understanding of corruption literature is very varied.
Corruption can be defined from many perspectives
such as religious, law, sociology, politics, and even
economics. Some institutions and scholars can also
explain corruption definition. However, the definition
of corruption in this study focuses on economic
thought. It is believed that addressing definition early
in this paper is essential to develop strong academic
arguments regarding corruption terminology. The
discussions of corruption definition become an
important issue because it provides more pertinent
information for measuring corruption.
Some institutions give the definition of
corruption. Although United Nations Convention
against Corruption (UNCAC) as a world institution
which focuses on corruption issues does not define
precisely about its context since corrupt behavior
differs one and another (United Nations, 2004), others
define corruption in almost the same meaning. For
instance, World Bank implies that corruption is an act
of influencing other people whether directly or
indirectly in an inappropriate manner while
Transparency International defines corruption as the
misuse of public power for private profit or the
misuse of entrusted power for private gain. As for
Organisation for Economic Co-Operation and
Development (OECD) does not have a specific
definition about corruption; however, they set up a
range of corrupt behavior as mentioned in UNCAC
such as influencing on trading, bribing public
officials whether domestic or international,
obstruction of justice, embezzlement. Likewise,
International Monetary Fund (IMF) concludes the
definition from several institutions is becoming "the
abuse of public office for private gain," and it is
included whether financial gains or not (IMF, 2017).
Among scholars, the spreading of corruption
definition is still highly debated and not agreed yet
(Mikkelsen, 2013). The concept of corruption was
traditionally restricted to the destruction of integrity
in the discharge of public duties (Theobald, 1990).
The definition of corruption usually associated with
public officials and the performance of public duties
influenced by bribery. However, it is now
increasingly accepted that the act of corruption may
apply to both public and private individuals and may
extend beyond bribery (Ng, 2006).
Wedeman (2004) stated that corruption includes
bribery, embezzlement, concealment, and laundering
of proceeds, and trading in influence. Corruption is
not about manipulation only, but it is also related to
cronyism, money politics, bribery, and gratification.
It has been classified as administrative and legislative
corruption. However, understanding of corruption is
closely related to the norms and conventions of its
original state because the limitation of the definition
of corruption is still difficult to determine even
though the term corruption is very easy to understand
by many people (Kurer, 2005).
In Indonesia context; however, the view and
definition of corruption have been shifting as well as
Perception and Reality of Corruption: A Spatiotemporal Analysis in Indonesia Sub-national Level
221

judicial processes (Butt, 2012). Finding a national
consensus on corruption definition is necessary.
There is no consensus about corruption definition in
either among scholars as well as international
organizations. However, corruption is closely related
to the norms and conventions of its original state
(Kurer, 2005). Hence, this paper uses the definition of
corruption based on Indonesian corruption
eradication act. No. 20 of 2001 on the changes in law
No. 31 of 1999.
In a juridical sense, the definition of corruption is
not only limited to the actions of public officials that
cause state financial loss but also includes the actions
is detrimental to individual or public. Such as Bribery,
both active (bribing) and passive (bribed);
Embezzlement; Extortion; Trading in influence;
Gratification; and Fraud. Accordingly, the
understanding of corruption measurement in this
paper is in-line with the definition of corruption
referred.
2.2 Corruption Perception Indicator
Scholars interested in the complex phenomenon of
corruption have been trying to measure corruption,
although the issues over the definition of corruption
remain unsettled. Initially, the efforts were based on
obtaining objective measurements such as a number
of asserts and convictions for corruption, counts of
newspaper stories on corruption, and other official
records and statistics. In this approach, it is hard to
define whether the criminal justice system (anti-
corruption agencies, prosecutors, and judges) are
effective or not. Meanwhile, in highly corrupt
countries, the media has not had an important role in
reporting serious corruption.
Over the past 30 years, the efforts to proxy
corruption as valid and reliable data have been more
developed by academicians, the international
organization, as well as non-government organization
using subjective measure developed perception and
experience-based measures. It has been derived from
a range of surveys, business and expert assessments
based on their experiences to corruption, for instance,
whether they have been offered as well as received or
given a bribe in a country.
The most perception indicators commonly used to
see the level of corruption across the world and have
become established as cited indicator for the
economics of corruption research is the Corruption
Perception Index (CPI). The data has been published
by Transparency International (a non-governmental
organization based in Berlin dedicated to raising
public awareness about the severity of the global
corruption problem). First released in 1995, the CPI
has quickly become the best known of corruption
measurement tools. The CPI is a composite index (a
survey of surveys) that draws on existing global
expert evaluations and business opinion surveys from
a variety of third party sources, including commercial
risk rating agencies, think tanks, NGOs, and
international organizations. It provides information
about corruption from administrative and political
aspects around the world yearly according to the
perceived level of public sector corruption as
determined by experts, business people, and analysts
(Heinrich and Hodess, 2011).
Since Transparency International first released,
the CPI has quickly become the best-known
corruption indicator worldwide. This index has been
broadly used by many scholars to measure corruption
in every country level as well as compare and analyze
cross-countries' level of corruption. From the first
publication, the CPI’s score countries are from 1 to
10 scale, where 0 represents the most corrupt while
10 represents the least corrupt. However, from 2012
until now, the scale has changed becoming on a zero-
to-hundred. The CPI has been widely credited with
making a comparative and large number of studies of
corruption possible, as well as putting the issue of
corruption squarely in the international policy
agenda. Despite its enormous influence on both
academic and policy fronts, the CPI is not without
critics. One often noted critique is that the CPI relies
solely on surveys of foreign businesspeople and the
expert assessments of cross-national analysis; as
such, the CPI mainly reflects international experts'
perceptions, not the perceptions of each country's
citizens.
Although perception measurement is more stable
across time and it represents the quality of institutions
(Kenny, 2009), these are much different from actual
occurrence and real corruption level (Treisman, 2007;
Rose and Peiffer, 2012). For control of corruption
indices, business elites could give bias information
when describing corruption since they have political
interest (Rohwer, 2009).
In addition, Malito (2014) has particularly
emphasized evaluating perception indicators to the
three matters. First, there are biases in subjective data
since the perception avoids the absolute amount of
corruption. Second, the technique of aggregating
multiple data may be risked. The third is the problem
of gathering and missing data since for some
indicators, and it affects the researcher to reach other
information without considering about aggregation.
Internal validity could be low because the indices
depend on different sources for most of the years.
ICOACI 2019 - International Conference on Anti-Corruption and Integrity
222
Andersson & Heywood (2009) state that those indices
have created a "corruption trap"; however, it is widely
recognized that perception-based measure has
contributed to the efforts of corruption eradication
agenda through promoting good governance system.
According to the explanation above, although CPI
has some benefits to see the level of corruption in
Indonesia and the source of data received from
various Indonesia region, it is very difficult to analyze
deeper about corruption in sub-national level.
Therefore, it is imperative that regional perception-
based should be considered in either from the
municipality or district level.
3 DATA AND METHOD
3.1 Data
This paper employs two approaches as indicators to
measure corruption in Indonesia. First, it is a
subjective approach using the Corruption Perception
Index (CPI) data issued by Transparency
International Indonesia. Second, the data on
corruption cases are legally binding from the
Supreme Court, which is an objective approach. CPI
itself is only available in the 4-year period (2004,
2006, 2008, 2010) using a scale from 0 to 10 (0 is
highly corrupt, and 10 is very clean). For 2004, it
covers 26 cities/districts in Indonesia, while 2006
becomes 37 cities/districts. Whereas the coverage
area in 2008 and 2010 are 55 cities/districts.
Corruption cases data are from 2001 to 2014,
which are divided into two types. First, the number of
corruption cases indicated by the number of
perpetrators, and second, the value of state losses due
to corruption. During the data period, the number of
corruption cases was 3050 spread across 230 districts
and 64 cities, while the total of state financial loss was
USD8.1 Billion. This research uses 294
districts/municipalities as a spatial unit based on the
1996 version from the number of
districts/municipalities in Indonesia. Since the
decentralization era, the latest consistent region in
Indonesia can be used to analyze spatial distribution
is in 1996. All region that has divided after
decentralization will be re-adjust to the number of
regions in 1996.
3.2 Method
To describe the distribution of the existing data,
spatial distribution has been utilized supported by the
correlation for each measurement of corruption that
has been used to see the relationship between regional
CPI and judicial report data. Spatiotemporal analysis
has been employed to see changes among regions or
overtimes. Since corruption is a part of crime issue,
spatiotemporal is used to see understanding location
and connectivity through interaction when incidence
at the same time close in regional space (Jacquez,
1996; Kulldorff and Hjalmars, 1999), and regular
occurrence in the timing and spacing (Bowers and
Johnson, 2005; Sagovsky and Johnson, 2007).
Further understand the characteristic of the region
(Block and Block, 1995; Brantingham, P. L.
Brantingham, 1999; Loukaitou-sideris, 1999).
Likewise, an increase or decrease of corruption level
in an area over time can be approached using this
method which as it is done by (Grubesic and Mack,
2008) in analyzing crime trend.
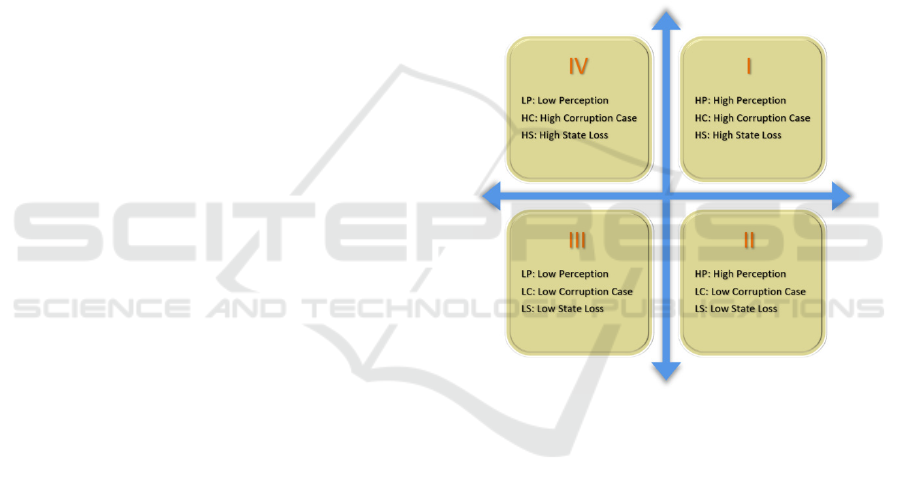
Figure 1: Corruption perception (x-axis) and corruption
reality (y-axis) quadrant.
To get more understanding about those
connections, this paper has divided and grouped the
area with the same patterns into four quadrants (see
figure 1). In general, regions that have a high
perception of corruption, the number of corruption
cases and their state financial loss are low (quadrant
II), and vice versa (quadrant IV). It means that there
is a negative relationship between perception and the
incident of corruption.
Perception and Reality of Corruption: A Spatiotemporal Analysis in Indonesia Sub-national Level
223
4 FINDINGS
4.1 An International Approach to
Corruption Measurement
The result shows that the country's perception of
corruption tends to improve and positively related to
the number of corruption cases handled in Indonesia.
It indicates that the more corruption cases treated, the
perception index will increase over time. The trend
between national CPI, regional CPI, and state
financial loss have the same pattern as well. Table 1
shows that the correlation between the three
measurements is positive. It means that corruption
perception is in-line with corruption reality.
Table 1: Correlation matrix of National CPI, Corruption
Cases (CC), and State Financial Loss (SFL).
CPI CC SFL
CPI 1.000 – –
CC .810** 1.000 –
SFL .628* .790** 1.000
** Significant at the 0.01 level
* Significant at the 0.05 level
4.2 The Distribution of Judicial Report
on Corruption
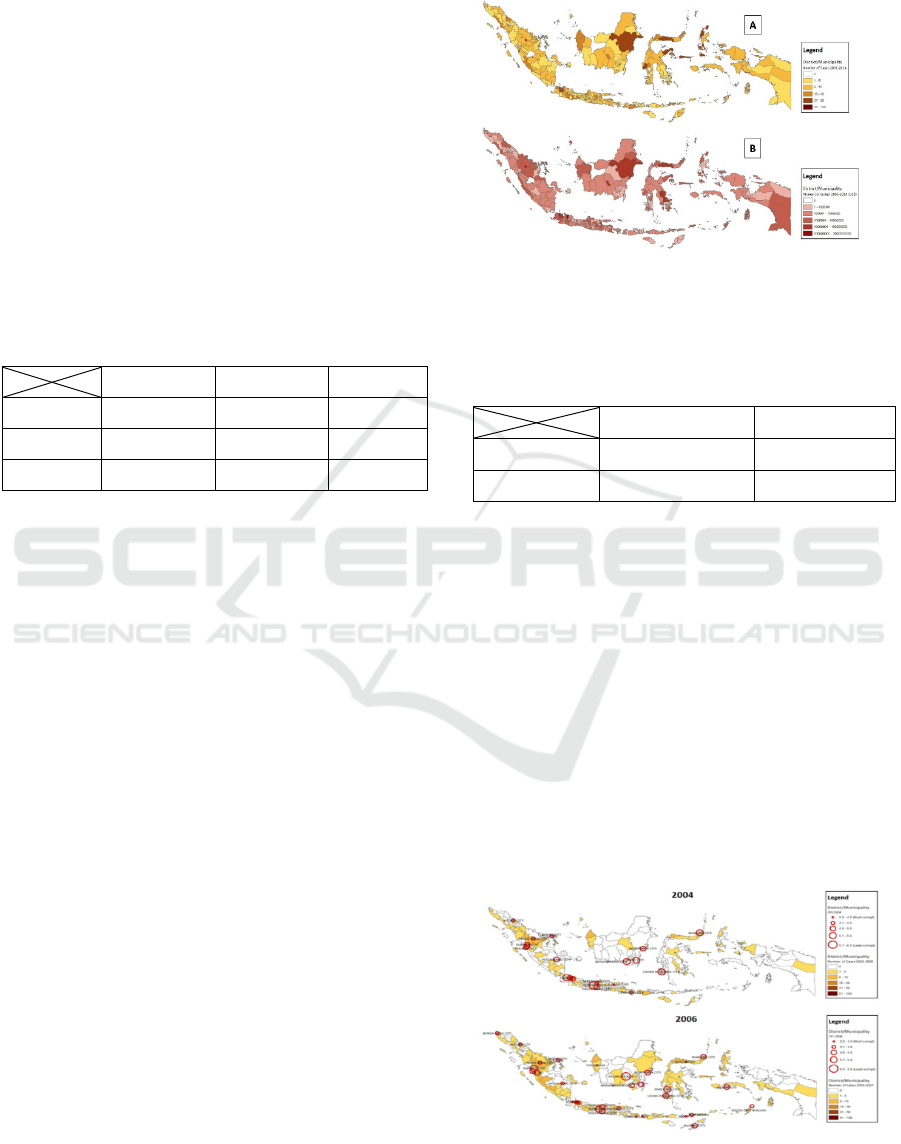
At the regional level, the distribution of corruption
cases and state financial loss can be seen since 2001.
Ogan Komering Ilir District was the largest in the
number of corruption cases and state financial loss at
that time. The corruption cases had increasingly
spread in various regions in 2014, Cirebon City was
the highest number of corruption cases, while the
biggest state financial loss was in Bekasi District. At
this year, the western part of Indonesia dominates
corruption practices while some are in the central
region and only a few regions in the eastern.
However, almost all regions in Indonesia have
corruption cases with various types of corruption
from 2001 to 2014; It was found that only two regions
were not indicated by corruption. There were Bungo
Tebo District in Jambi Province and Sintang District
in West Kalimantan Province (see figure 2).
This result has been strengthened by a significant
and positive correlation between the corruption cases
and the state financial loss (see table 2); nevertheless,
the island of Sumatra, Kalimantan, Bali and Nusa
Tenggara are stronger than Java and Sulawesi. In
addition, there is no significant correlation between
Maluku and Papua. It means that many corruption
cases in that area indicated do not result in state
financial loss.
Figure 2: Spatial distribution of corruption in Indonesia (A-
the number of corruption cases from 2001-2014, B-the
value of state financial loss from 2001-2014).
Table 2: Correlation matrix of Corruption Cases (CC), and
State Financial Loss (SFL).
CC SFL
CC 1.000 –
SFL .419** 1.000
** Significant at the 0.01 level
4.3 Regional Perception and Reality of
Corruption
The more specific result found in the relation between
regional CPI (red circle) and two judicial report data.
In 2004, corruption perception data showed that
Kalimantan and Sulawesi Islands have a higher
perception than Sumatra, Java, and Bali Island.
Hence, it indicates that perceptually, Kalimantan, and
Sulawesi are cleaner than other areas. The same
condition had also occurred in 2006. Despite there is
an increase in corruption cases in several areas of
Kalimantan and Sulawesi, the perception has not
significantly changed (see figure 3).
Figure 3: The pattern of corruption perception and
corruption cases between 2004 and 2006.
ICOACI 2019 - International Conference on Anti-Corruption and Integrity
224
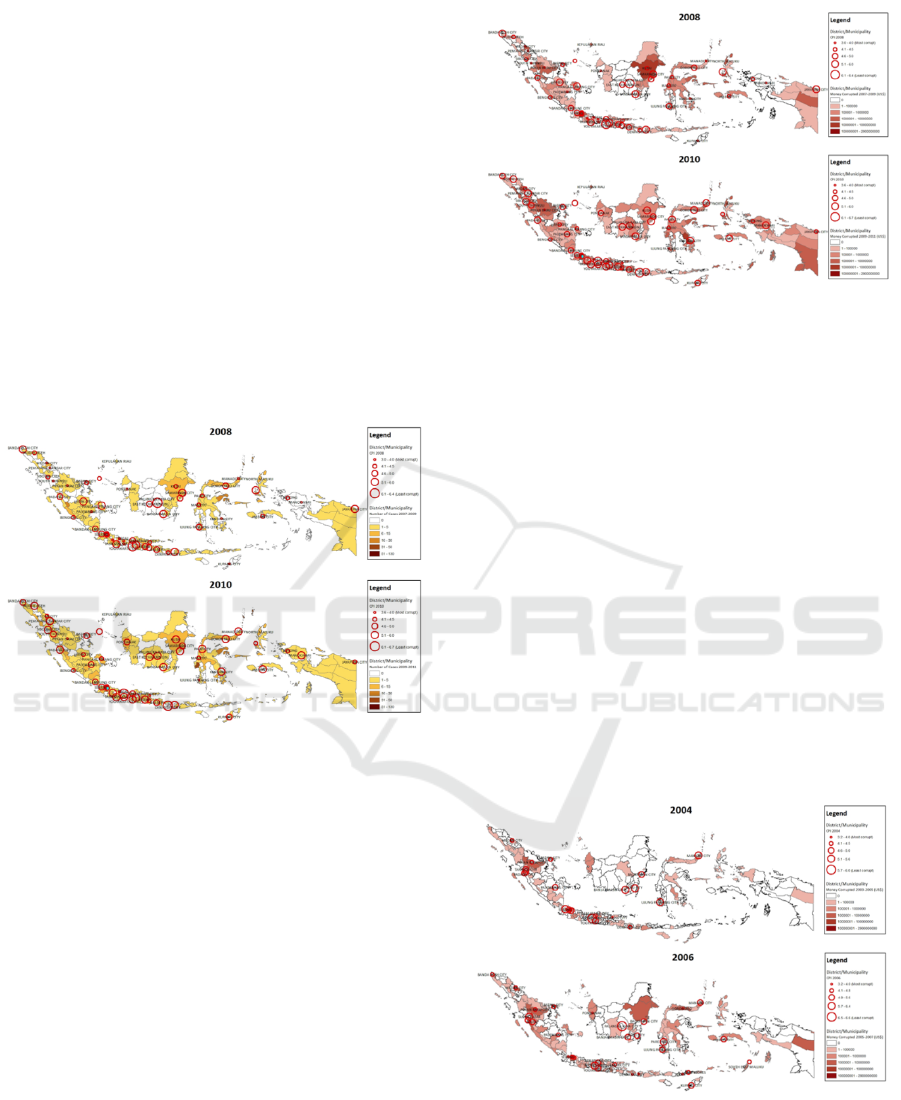
An interesting comparison was shown in 2008 and
2010. For instance, in 2008, while there were no
corruption cases revealed in the period of 2007-2009,
the perception of corruption has a different score.
This difference may occur because the region has
different administrative types, namely District and
City. So that the perception of corruption built in the
City is far greater than in the District if there are no
corruption cases in that area. In 2010, where the
number of corruption cases increased in the period of
2009-2011, the corruption perception in
Palangkaraya City declined. Interestingly, the
perception in East Kotawaringin slightly rose.
Probably, it is because of the influence between
regions. There is a view that this area is still cleaner
than others around it, although the number of
corruption cases in the region itself increases (see
figure 4).
Figure 4: The pattern of corruption perception and
corruption cases between 2008 and 2010.
In the relation between regional perception and
state financial loss should be noted that the areas with
a large number of cases do not necessarily have a
huge amount of state losses. As shown by the
previous correlation coefficient below than 0.5.
Therefore, the value of state loss varies for each
region in a given year. For instance, in the period of
2005-2007, the number of corruption cases in
Gorontalo and Manado City is equal (5), but the value
of state financial loss in both regions is different. The
corruption that occurred in Gorontalo City resulted in
US$ 1,516,590, while in Manado City, it was US$
526,922. Interestingly, the corruption perception in
Manado City is much better than Gorontalo City in
2006. It shows that there is a negative relationship
between perception and state financial loss in both
regions (see figure 5).
Figure 5: The pattern of corruption perception and state
financial loss between 2004 and 2006.
Another interesting discussion is in the Papua
region. In the period of 2007-2009, there was no state
financial loss in Manokwari and Sorong District.
However, the corruption perception index in 2008 in
both regions was very small, although Sorong District
was still better than Manokwari District. It means that
businesspeople feel a state financial loss in that area,
but it has not been revealed by a law enforcer.
Changes occurred in the perception of corruption in
2010 for both regions. Corruption perceptions in
Manokwari District rose significantly from 3.39 to
5.81 with the value of state financial loss US$
149,242, while the perception of corruption in Sorong
declined from 4.39 to 4.26 with the value of state
financial loss US$ 416,197. From this description, it
can be said that there is a negative correlation
between perception and state financial loss in both
regions (see figure 6).
Figure 6: The pattern of corruption perception and state
financial loss between 2008 and 2010.
Perception and Reality of Corruption: A Spatiotemporal Analysis in Indonesia Sub-national Level
225

4.4 The 4-quadrant of Corruption
Measurement
From the 4-year period of regional CPI, it can be seen
several regions are in quadrant II and IV. It shows the
regions that have a small number of corruption cases,
the perception of business actors tends to improve,
and the regions that have a large amount of
corruption, the perceptions tend to deteriorate. This
result is in-line with the previous paper using
corruption perception and corruption incidence in
Russia (Belousova, Goel, and Korhonen, 2016). They
found that there is a positive relation between
perception and reality. Please take note that in their
paper, they use different perception meaning which is
0 is very clean and 10 is very corrupt. That is why the
correlation sign is positive.
Interestingly, in fact, some regions are also in
quadrant I and III. I expect that the perceptions
formed in these areas were accentuated comparing the
number of corruption cases with other regions so that
the perception is directly proportional to reality.
Over time, there are different patterns in each
region. For example, in South Jakarta, the number of
corruption cases increased in the period of 2003-
2011. In line with this, the perception of corruption is
also getting better. It describes that the more
corruption cases revealed, the perception of business
actors on corruption is getting better as well. In
Padang City, the number of corruption cases is
relatively the same in the period of 2004-2006, while
the corruption perception experienced a significant
increase in this region. However, until 2010, this
perception has decreased as the number of corruption
cases handled has declined. A much different pattern
occurred in Surabaya, the increase in the number of
corruption cases in the period 2003-2011 did not give
much chance to the corruption perception in the
period of 2004-2010 (see appendix 1).
An interesting discussion is in Manado City.
Within the four period measurements, the amount of
state financial loss rose in this city, while the
corruption perceptions also increased during this
period. It shows that there is a positive relationship
between perceptions and state financial loss overtime
in one region. Hence, people tend to have a positive
view that the state is working hard to eradicate
corruption and prosecute those implicated in it, when
the justice system is properly enforced (Bohn, 2012).
Therefore, corruption perception tends to improve in-
line with the effectiveness of law enforcement. The
same pattern also occurs in West Jakarta. The
increase in the number of state losses improves the
perception of businesspeople against corruption in
that region (see appendix 2).
5 CONCLUSION
Regional corruption measurement is essential to see
the pattern of corruption. There are three points that
can be highlighted to conclude this paper. First, there
is a negative correlation between corruption
perception and corruption reality among regions.
Second, there is a positive correlation between
corruption perception and corruption reality over
time. Third, corruption perception, corruption cases,
and state financial loss have complemented each
other in explaining the pattern of corruption in
Indonesia sub-national level.
ACKNOWLEDGMENTS
The author, thanks to the Ministry of Religious
Affairs, the Republic of Indonesia, who provides the
scholarship for this research through 5000 Doktor
program.
REFERENCES
Andersson, S. and Heywood, P. M. (2009) ‘The Politics of
Perception: Use and Abuse of Transparency
International's Approach to Measuring Corruption,'
Political Studies, 57(4), pp. 746–767. doi:
10.1111/j.1467-9248.2008.00758.x.
Belousova, V., Goel, R. K. and Korhonen, I. (2016)
‘Corruption perceptions versus corruption incidence:
Competition for rents across Russian regions’, Journal
of Economics and Finance, 40(1), pp. 172–187. doi:
10.1007/s12197-014-9298-y.
Bhargava, V. and Bolongaita, E. (2004) Challenging
Corruption in Asia: Case Studies and a Framework for
Action. Washington, D. C: The World Bank.
Block, R. L. and Block, C. R. (1995) ‘Space, place and
crime: Hot spot areas and hot places of liquor-related
crime’, Crime and Place, 4(2), pp. 145–184.
Bohn, S. R. (2012) ‘Corruption in Latin America:
Understanding the Perception-Exposure Gap’, Journal
of Politics in Latin America, 4(3), pp. 67–95. doi:
10.1177/1866802X1200400303.
Bowers, K. J. and Johnson, S. D. (2005) ‘Domestic
Burglary Repeats and Space-Time Clusters’, European
Journal of Criminology, 2(1), pp. 67–92. doi:
10.1177/1477370805048631.
Brantingham, P. L. Brantingham, P. J. (1999) ‘A theoretical
model of crime hot spot generation’, Studies on Crime
& Crime Prevention, 8(1), pp. 7–26.
ICOACI 2019 - International Conference on Anti-Corruption and Integrity
226

Brown, A. J. (2006) ‘What are we trying to measure?
Reviewing the basics of corruption definition’, in
Sampford, C. et al. (eds) Measuring Corruptionsuring
Corruption. Burlington, VT: Ashgate Publishers, pp.
57–79.
Butt, S. (2012) Corruption and law in Indonesia. New York:
Routledge Contemporary Southeast Asia Series.
Grubesic, T. H. and Mack, E. A. (2008) ‘Spatio-Temporal
Interaction of Urban Crime’, Journal of Quantitative
Criminology, 24(3), pp. 285–306. doi: 10.1007/s10940-
008-9047-5.
Gutmann, J., Padovano, F. and Voigt, S. (2015) ‘Perception
vs. Experience: Explaining Differences in Corruption
Measures Using Microdata’, SSRN Electronic Journal.
doi: 10.2139/ssrn.2659349.
Heinrich, F. and Hodess, R. (2011) ‘Measuring
Corruption’, in Graycar, A. and Smith, R. G. (eds)
Handbook of Global Research and Practice in
Corruption. Massachusetts: Edward Elgar Publishing,
Inc., pp. 18–33.
IMF (2017) The Role of the fund in governance issues -
Review of the guidance note - Preliminary
considerations - Background notes. Washington, D. C.
Available at:
http://www.imf.org/external/pp/ppindex.aspx.
Jacquez, G. M. (1996) ‘A k Nearest neighbour test for
spade-time interaction’, Statistics in Medicine, 15(18),
pp. 1935–1949. doi: 10.1002/(SICI)1097-
0258(19960930)15:18<1935::AID-SIM406>3.0.CO;2-
I.
Jain, A. K. (2001) ‘Corruption: A review’, Journal of
Economic Surveys, 15(1), pp. 71–121. Available at:
https://onlinelibrary.wiley.com/doi/abs/10.1111/1467-
6419.00133.
Johnston, M. (1996) ‘The search for definitions: the vitality
of politics and the issue of corruption’, International
Social Science Journal, 48(149), pp. 321–335. doi:
10.1111/1468-2451.00035.
Johnston, M. (2002) ‘Measuring the New Corruption
Rankings: Implications for Analysis and Reform’, in
Political Corruption. Routledge, pp. 865–884. doi:
10.4324/9781315126647-69.
Johnston, M. (2010) ‘Assessing Vulnerabilities to
Corruption’, Public Integrity, 12(2), pp. 125–142. doi:
10.2753/PIN1099-9922120202.
Johnston, M. and Kpundeh, S. J. (2002) ‘The measurement
problem: a focus on governance’, in Dijk, J. Van and
Ruggiero, V. (eds) Forum on Crime and Society. New
York: United Nations Publication, pp. 33–44.
Kaufmann, D. (2005) Myths and Realities of Governance
and Corruption. 8089. Munich. Available at:
http://mpra.ub.uni-muenchen.de/8089/.
Kaufmann, D., Kraay, A. and Mastruzzi, M. (2007)
Measuring Corruption: Myths and Realities.
Kenny, C. (2009) ‘Measuring Corruption in Infrastructure:
Evidence from Transition and Developing Countries’,
The Journal of Development Studies, 45(3), pp. 314–
332. doi: 10.1080/00220380802265066.
Kulldorff, M. and Hjalmars, U. (1999) ‘The Knox Method
and Other Tests for Space-Time Interaction’,
Biometrics, 55(2), pp. 544–552. doi: 10.1111/j.0006-
341X.1999.00544.x.
Kurer, O. (2005) ‘Corruption: An alternative approach to
definitions of corruption’, Political Studies, 53, pp.
222–239.
Loukaitou-sideris, A. (1999) ‘Hot Spots of Bus Stop
Crime’, Journal of the American Planning Association,
65(4), pp. 395–411. doi: 10.1080/01944369908976070.
Malito, D. V. (2014) Measuring Corruption Indicators and
Indices. RSCAS 2014/13.
Mauro, P. (1995) ‘Corruption and Growth’, The Quarterly
Journal of Economics, 110(3), pp. 681–712. Available
at: https://www.jstor.org/stable/2946696.
Mcleod, R. H. (2000) ‘Soeharto ’ s Indonesia : A Better
Class of Corruption’, Agenda: A Journal of Policy
Analysis and Reform, 7(2), pp. 99–112.
Mikkelsen, K. S. (2013) ‘In murky waters: A disentangling
of corruption and related concepts’, Crime, Law and
Social Change, 60(4), pp. 357–374. doi:
10.1007/s10611-013-9474-6.
Miller, W. L. (2006) ‘Perceptions, experience and lies:
What measures corruption and what do corruption
measures measure?’, in Sampford, C. et al. (eds)
Measuring Corruption. Burlington, VT: Ashgate
Publishers, pp. 163–185.
Del Monte, A. and Papagni, E. (2007) ‘The determinants of
corruption in Italy: Regional panel data analysis’,
European Journal of Political Economy, 23(2), pp. 379–
396. doi: 10.1016/j.ejpoleco.2006.03.004.
Ng, D. (2006) ‘The impact of corruption on financial
markets’, Managerial Finance, 32(2003), pp. 822–836.
doi: 10.1108/03074350710688314.
Philp, M. (2006) ‘Corruption definition and measurement’,
in Sampford, C. et al. (eds) Measuring Corruption.
Ashgate Publishers, pp. 45–56.
Rohwer, A. (2009) Measuring Corruption: A Comparison
between the Transparency International’s Corruption
Perceptions Index and the World Bank’s Worldwide
Governance Indicators. Munich. Available at:
http://hdl.handle.net/10419/166975.
Rose, R. and Mishler, W. (2010) ‘Experience versus
perception of corruption: Russia as a test case’, Global
Crime, 11(2), pp. 145–163. doi:
10.1080/17440571003669175.
Rose, R. and Peiffer, C. (2012) Paying Bribes to Get Public
Services: A Comparative Guide to Concepts and
Measures. 494. Available at:
https://papers.ssrn.com/sol3/papers.cfm?abstract_id=2
180793.
Sagovsky, A. and Johnson, S. D. (2007) ‘When Does
Repeat Burglary Victimisation Occur?’, Australian &
New Zealand Journal of Criminology, 40(1), pp. 1–26.
doi: 10.1375/acri.40.1.1.
Svensson, J. (2005) ‘Eight Questions about Corruption’,
Journal of Economic Perspectives, 19(3), pp. 19–42.
Theobald, R. (1990) Corruption, Development and
Underdevelopment. Palgrave Macmillan, London.
Treisman, D. (2007) ‘What Have We Learned About the
Causes of Corruption from Ten Years of Cross-
National Empirical Research?’, Annual Review of
Perception and Reality of Corruption: A Spatiotemporal Analysis in Indonesia Sub-national Level
227
Political Science, 10(1), pp. 211–244. doi:
10.1146/annurev.polisci.10.081205.095418.
United Nations (2004) United Nations convention against
corruption. New York, USA.
Wedeman, A. (2004) ‘The Intensification of Corruption in
China’, 35(116), pp. 85–103.
APPENDIX
1. Reginal CPI and corruption cases
2. Regional CPI and state financial loss
ICOACI 2019 - International Conference on Anti-Corruption and Integrity
228
