
Determination of Thorax Exposure Factors in Conventional X-rays
Imaging using the Artificial Neural Network Method
Donni Maulana Sipa and Jamrud Aminuddin
Department of Physics, Faculty of Mathematics and Natural Science, Universitas Jenderal Soedirman, Purwokerto, Indonesia
Keywords: X-ray, Exposure Factor, Neural Network.
Abstract: The application of artificial intelligence in the medical field is indispensable for providing optimum results.
Conventional X-ray imaging is the fastest, most common and least expensive diagnostic imaging system
available. However, an effective X-ray examination depends on the range of radiation given to the subject.
The radiation from an X-ray primarily depends upon X-ray tube current (mA), tube voltage (kVp) and
exposure time(s); these parameters define the dosage. X-ray radiation has a negative impact on the human
body; this danger is not visible, but X-ray radiation can damage human cell tissue. This work aims to explore
and analyze X-ray exposure parameter levels to the thorax with an artificial neural network, which helps to
diagnose exposure of the tissue that is being irradiated. By entering distance, weight and height into the
software, radiographers will get the optimum exposure factor settings for the patients’ thorax. The subjectivity
of exposure factor settings from radiographers can be objective, and optimum exposure settings for patients
can result in lower radiation with a good, detailed image, thereby reducing the impact of X-ray radiation.
1 BACKGROUND
A radiograph from X-ray imaging is produced based
on the suitability of the exposure factor chosen by a
radiographer. The exposure factor is chosen based on
the region of examination, the patient's body weight,
projection position, distance from X-ray to the patient
and the patient's physical condition (Carlton et al.,
2019). If the value of the exposure factor is too high
or too low, the radiograph will yield a shadow, which
has no diagnostic information, and the inappropriate
exposure factor also triggers a high radiation value. In
other words, the image on X-ray film will be over-
bright or over-dark, making it difficult to read by a
doctor and giving the effects of excessive radiation to
the patient (Gois et al., 2019).
The value of the exposure factor can be seen by
the state of the patient; underweight patients and
overweight patients have different exposure factor
settings. Because of the differing patient surface
areas, radiographers need to ensure that the value of
the exposure factor is a match to the patient. Every X-
ray device and every radiographer needs to have clear
parameters for overweight or underweight patients;
this makes the settings of exposure factor subjective
by the radiographer itself (Elster, 2010).
Exposure factor calculation using fuzzy logic has
been developed by Santoso et al., (2016). Fuzzy logic
succeeded in calculating the optimum exposure
factor. Instead of using fuzzy logic, however, we
employed the use of an artificial neural network.
Therefore, the aim of this work is to explore and
analyse X-ray exposure parameter levels to the thorax
with an artificial neural network, which helps to
diagnose exposure of the tissue being irradiated.
2 METHOD
2.1 Exposure Factor
A good image depends on the exposure factor. Image
quality also represents the amount of radiation
received by the patient during the imaging technique.
Three main factors that determine the image quality
are the kilovolt potential (kVp), which controls the
penetrating power of the X-ray; the milliampere
(mA), which controls the number of X-rays; and the
exposure time (S), which controls the duration of
exposure (Hiswara, 2002). These combinations will
decide the contrast sensitivity, detail and noise of the
radiograph. Variables from imaging techniques must
Sipa, D. and Aminuddin, J.
Determination of Thorax Exposure Factors in Conventional X-rays Imaging using the Artificial Neural Network Method.
DOI: 10.5220/0009388100330037
In Proceedings of the 4th Annual International Conference and Exhibition on Indonesian Medical Education and Research Institute (The 4th ICE on IMERI 2019), pages 33-37
ISBN: 978-989-758-433-6
Copyright
c
2020 by SCITEPRESS – Science and Technology Publications, Lda. All rights reserved
33

be precise so the radiograph from X-ray imaging
yields a good image with minimum radiation; this
also decreases the risk of X-rays radiation
(Lampignano and Bontrager, 2014).
2.1.1 Kilo Volt Potential
Energy from X-rays is controlled by a voltage
regulator. The potential difference setting usually has
the keV (kilo electron volt) or kVp (kilo Volt
potential) label. These are the important parts that
regulate the potential difference between anode and
cathode. The higher value of the potential difference,
the more energy is produced by X-rays (Omura,
2018). The high energy produced is contrary to the
contrast of the radiograph—the higher the energy, the
lower the image contrast.
2.1.2 Milliampere
Besides the potential difference, the current also
influences the imaging technique. This setting has the
label mA (milliampere); this represents how much
filament flows. The higher value of the mA (the tool
will get hotter) that is flowed through the filament, the
more electrons available in the ‘space charge’ to
accelerate through the target; the result is a high flux
of photons when energy flows. The effect of the
current is quite linear. To duplicate X-rays from the
tube, it can be done by doubling the previous tube
current settings. Changing the amount of current will
affect the blackness of the radiograph but it doesn’t
affect the contrast (Plaats, 1965).
2.1.3 Exposure Time
The final setting is the exposure time. With the s
(second) label, the exposure time is often associated
with regulating the tube current. The combination of
current and exposure time is often called mAs, or
milliAmpere second. For example, a 100-mA current
setting and a 0.5 s exposure time is the same as 50
mAs, as is a 50-mA current and 1 s exposure time; the
result is the same: 50 mAs. The combination of these
two factors is directly proportional to the effect on the
film (Sari and Fransiska, 2018). To produce a darker
radiograph, the value of mAs must be increased; and
to produce a brighter image, the value of mAs must
be reduced.
2.2 Body Mass Index
BMI is a comparison between weight and squared
height. The method of measurement is to measure his
weight and height. Then the BMI can be calculated
by:
BMI = (weight (kg)) / (height (m)) ^ 2
To determine the nutritional status of children
under five years of age (0–60 months) and children
aged 5–19 years, the BMI value should be compared
with the standard BMI value according to the
Republic of Indonesia’s Ministry of Health (2010). At
this time, the index is most often stated with Z-scores
or percentiles. Theoretically, the Z-score can be
calculated in the following way:
ZScore
BMI Mean of BMI from reference
Standard Deviation from reference
Classification is distinguished in the 0–60-month
age group and also in the 5–18-year age group
(Munish, 2015). Classification of BMI for ages 0–60
months is presented in Table 1, while BMI
classification for children aged 5–18 years is
presented in Table 2.
Table 1: BMI for newborn baby 0–60 months.
Category Z-score value
Abnormal Z-score < -3
Underweight -3 ≤ Z-score < -2
Ideal -2 ≤ Z-score < 2
Overweight 2 ≤ Z-score < 3
Obese Z-score ≥ 3
Table 2: BMI for kids/teenagers 5–18 years old.
Category Z-score value
Abnormal Z-score < -3
Underweight -3 ≤ Z-score < -2
Ideal -2 ≤ Z-score < 2
Overweight 2 ≤ Z-score < 3
Obese Z-score ≥ 3
In adults, measurement of nutritional status is
done by using body mass index (BMI). BMI
calculation is the same as above. The results are
compared with the BMI threshold values according to
the Indonesian Ministry of Health, and the boundary
values are presented in Table 3. In adults the age
factor is not considered when calculating BMI,
because the height is usually relatively stable, so
variations only occur in body weight (Baş Mor,
2018).
The 4th ICE on IMERI 2019 - The annual International Conference and Exhibition on Indonesian Medical Education and Research Institute
34
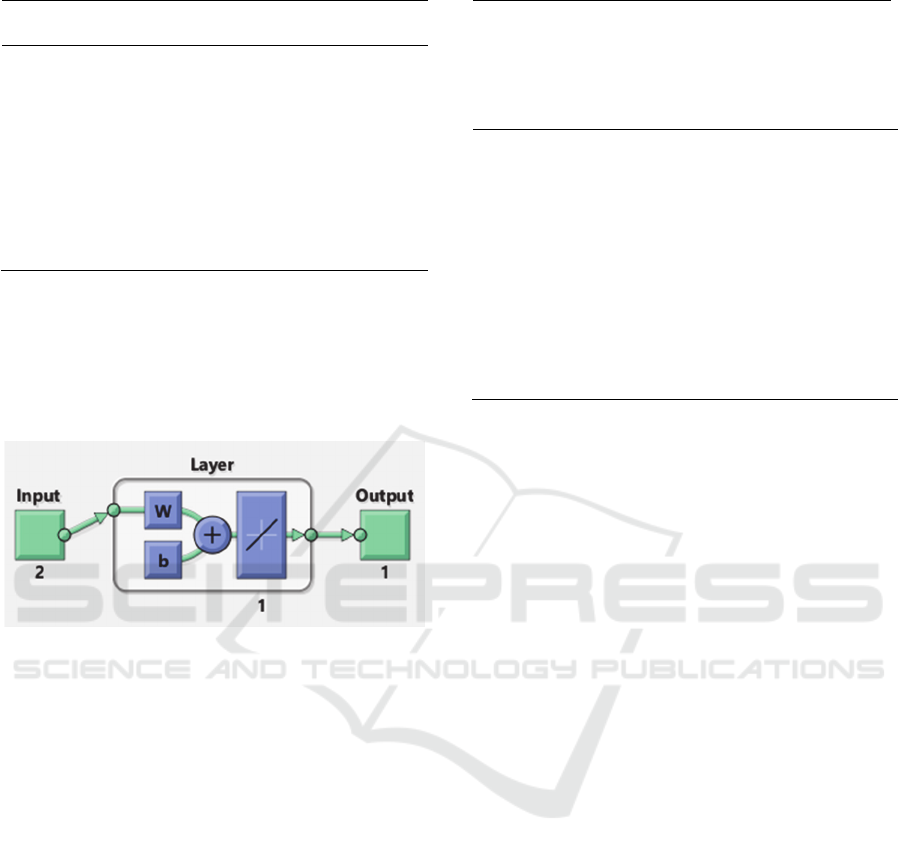
Table 3: BMI for adults.
Category BMI value
Abnormal BMI < 17.0
Underweight 17.0 ≤ BMI < 18.5
Ideal 18.5 ≤ BMI < 25.0
Overweight 25.0 ≤ BMI < 27.0
Obese BMI ≥ 27.0
2.3 Linear Neural Network
A linear network can only solve linearly separable
problems since its transfer function is linear. This
allows their outputs to take on any value.
Figure 1: Layer in Neural Network.
Like the human brain, nerve tissue also consists of
several neurons, and there are connections between
these neurons. Figure 1 shows the structure of
neurons in which neurons will transform information
received through the output connection to other
neurons.
By using the function newlind in Matlab toolbox
as follows:
Net = newlind (P, T)
This returns a linear layer designed to output T
given input P (MathWorks, 2019).
This reference data was obtained from
Conventional X-rays device kVp and mAs sheet in a
hospital, thus the data will be used as an input (P) for
artificial neural network.
Table 4: Exposure Factor for Thorax in Neural Network.
Age
Proje
ction
Exposure Factor
Abnor
mal
Under
weigh
t
Ideal
Over
weig
ht
Obese
kV/m
AS
kV/m
AS
kV/m
AS
kV/m
AS
kV/m
AS
Newborn
baby
AP 55/2
(0–2 y) LAT 55/2.5
Baby AP 55/2.5
(2–5 y) LAT 55/3
Kids/Teen
ager
AP 51/4 53/4 55/4 57/4 59/4
(5–18 y) LAT 61/4 63/4 65/4 67/4 69/4
Adults AP 61/16 63/16 65/16 67/16 69/16
(> 18 y) LAT 71/20 73/20 75/20 77/20 79/20
3 RESULTS
Without using loss function and optimizer in the
training of the linear neural network, the
determination of X-rays that come out for overweight
patients and with underweight patients is different.
Overweight patients require higher doses because of
the larger surface area and density of the body.
Likewise, underweight patients will require a lower
dose because of smaller surface area and body
density.
To obtain a good-image quality, optimal X-ray
output settings are needed with the patient because
the higher the X-ray output settings, the greater the
dose received by patients.
4 CONCLUSIONS
An artificial neural network program can be used to
determine the thorax exposure factor in the
conventional X-ray devices. By entering body weight
and body height, this program calculates the optimum
value of exposure factors that can be used to the
patient.
The output of this program is the value of kVp and
mAs. Compared to the reference, the value of kVp
and mAs is under the predetermined range, which
means the software can determine the optimum
exposure factor. Optimum exposure factors yield a
minimum dose of radiation and good image quality.
Determination of Thorax Exposure Factors in Conventional X-rays Imaging using the Artificial Neural Network Method
35
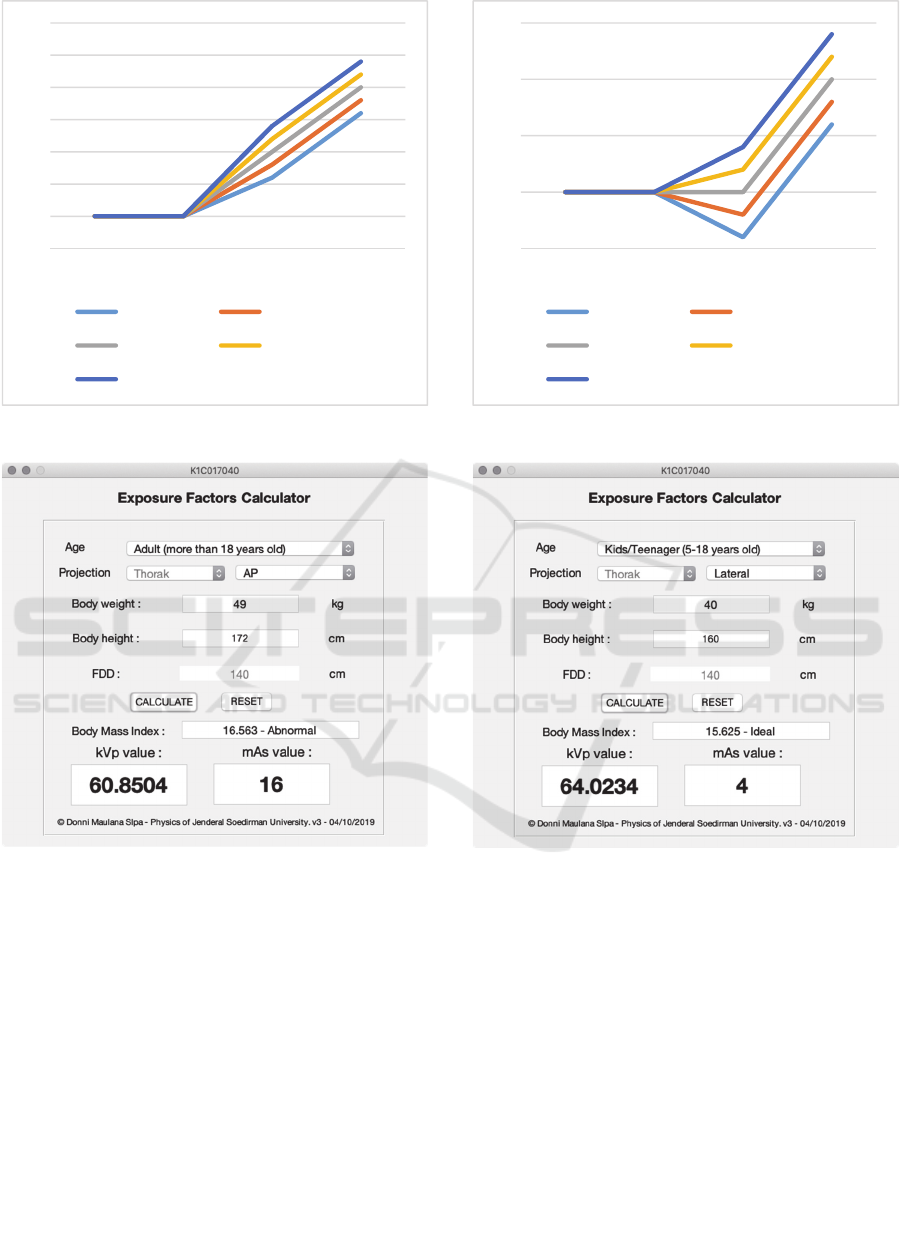
Figure 2: Thorax AP Graph.
Figure 4: Thorax AP.
ACKNOWLEDGEMENT
The authors are thankful to the Dean of Faculty of
Mathematics and Natural Sciences at Jenderal
Soedirman University and his staff for providing the
necessary facilities to complete this paper.
REFERENCES
Baş Mor, H., Altinsoy, N., & Söyler, İ. (2018). Estimation
of Adult Patient Doses for Chest X-Ray Examinations
and Comparison with Diagnostic Reference Levels
(DRLs). Radiation Protection Dosimetry, 182(3), 377–
Figure 3: Thorax Lat Graph.
Figure 5: Thorax Lateral.
385. http://doi.org/10.1093/rpd/ncy076.
Bontrager, K. L., & Lampignano, J. P. (2014). Bontrager's
Handbook of Radiographic Positioning and Techniques
(8th ed.). St. Louis, MO: Elsevier.
Carlton, R. R., Adler, A. M., & Balac, V. (2019). Principles
of Radiographic Imaging: An Art and a Science (6th
ed.). Clifton Park, NY: Delmar, Cengage Learning.
Elster, A. D. (2010). Effective Doses in Radiology and
Diagnostic Nuclear Medicine: A Catalog. Yearbook of
Diagnostic Radiology, 2010, 214–217.
Gois, M. L. C., Schelin, H. R., Denyak, V., Bunick, A. P.,
Ledesma, J. A., & Paschuk, S. A. (2019). Human
factor in exposure from conventional radiographic
examinations in very and extremely low birth weight
patients. Radiation Physics and Chemistry, 155, 31–37.
http://doi.org/10.1016/j.radphyschem.2018.09.016.
50
55
60
65
70
75
80
85
0‐2y 2‐5y 5‐18y >18y
Abnormal Underweight
Ideal Overweight
Obsese
50
55
60
65
70
0‐2y 2‐5y 5‐18y >18y
Abnormal Underweight
Ideal Overweight
Obsese
The 4th ICE on IMERI 2019 - The annual International Conference and Exhibition on Indonesian Medical Education and Research Institute
36

Hiswara, E. (2002). Pokok Dosimetri, Lokakarya Proteksi
Radisasi, Pusat Standarisasi dan Penelitian (PSPKR).
Jakarta: Badan Tenaga Nuklir Nasional.
Kementrian Kesehatan RI (2011). Standar Azntropometri
Penilaian Status Gizi Anak.
Linear Neural Networks. (2019). Retrieved October 7,
2019, from https://www.mathworks.com/help/deep
learning/ug/linear-neural-networks.html
Munish, K. S. (2014). Accuracy of Conventional X-Rays in
Diagnosing Airway Foreign Bodies among Children.
Indian Journal of Public Health Research and
Development, 6(2), 4–6. http://doi.org/10.5958/0976-
5506.2015.00061.3.
Omura, Y. (2018). Impact of X-ray Radiation on SOI
MOSFET: Insulator Film Degradation and Hot-Carrier
Reliability. ECS Transactions, 85(8), 59–64.
http://doi.org/10.1149/08508.0059ecst.
Santoso, S., Haddin, M., Nuryanto, E., & Utomo, A. S.
(2016). Penentuan Faktor Ekposi Pada Pembangkit
Sinar-X Konvensional Dengan Menggunakan Logika
Fuzzy. Prosiding SNST Fakultas Teknik, 1(1), 56–61.
Sari, A. W., & Fransiska, E. (2018). Pengaruh Faktor
Eksposi dengan Ketebalan Objek pada Pemeriksaan
Foto Thorax Terhadap Gambaran Radiografi. Journal
of Health, 5(1), 17–21. http://doi.org/10.30590/vol5-
no1-p17-21.
van der Plaats, G. J. (1965). Medical X-Ray Technique:
Principles and Applications (2nd ed.). Springfield, IL:
C. C. Thomas.
Determination of Thorax Exposure Factors in Conventional X-rays Imaging using the Artificial Neural Network Method
37
