
High Dynamic Range (HDR) Image Quality Assessment: A Survey
Ocarina Cloramidina, Salmaa Badriatu Syafa’ah, Irwan Prasetya Gunawan, Guson Prasamuarso
Kuntarto, and Berkah Iman Santoso
Informatics Engineering, Faculty of Engineering and Computer Science, Universitas Bakrie, Jakarta 12920, Indonesia
Keywords:
Image Quality Assessment (IQA), High Dynamic Range (HDR), Reduced-Reference (RR), Multi Exposure
Fusion (MEF), Inverse Tone Mapping Operator (ITMO)
Abstract:
This paper presents a survey on objective image quality measurement method for High Dynamic Range (HDR)
images. The emergence of HDR technology requires HDR image quality evaluation techniques to help max-
imize user satisfaction. In spite of its progress, HDR images have put more difficult challenges in quality
evaluation due to high sensitivity of Human Visual System (HVS) to the appearance of distortions in HDR
images. Several image quality assessment methods for HDR images will be discussed. It was found that for
HDR IQA, previous works in the literature are still focused on the full reference and no reference methods.
Therefore, there are some possibilities to develop reduced reference method for HDR IQA.
1 INTRODUCTION
High Dynamic Range (HDR) imaging is an advanced
visual-based technology capable of providing better
visual information representation for human view-
ers.Currently, there are various methods to form HDR
images from Low Dynamic Range (LDR) or Stan-
dard Dynamic Range (SDR) images; in general, they
can be categorized into Multi Exposure Fusion (MEF)
and Inverse Tone Mapping Operator (ITMO) algo-
rithms. MEF captures a series of images with dif-
ferent levels of exposure as input and combines them
into an output image with more information to show
and more attractive than any of the input images. On
the other hand, ITMO restores HDR information from
LDR/SDR image. These methods, however, may in-
troduce artifacts that can degrade the resulting visual
quality of the image. The emergence of HDR tech-
nology requires HDR image quality evaluation tech-
niques to help maximize user satisfaction. In spite
of its progress, HDR images have put more difficult
challenges in quality evaluation due to high sensitiv-
ity of human eye to the appearance of distortions in
HDR images.
In general, image quality assessment (IQA) can
generally be divided into two methods: subjective and
objective. Subjective methods rely on human sub-
ject and hence are considered reliable; however, they
could become very expensive and time consuming.
Objective quality method predicts image quality au-
tomatically without human intervention. Depending
on the availability as well as the accessibility of the
original images, this method can be categorized into
full reference (FR), reduced reference (RR), and no
reference (NR) methods (VQEG, 2000; VQEG, 2002;
VQEG, 2004). The objective model can be differen-
tiated based on the method to ‘quantify’ the quality.
There are methods based on error differences (Nar-
waria et al., 2015), structural information (Yeganeh
and Wang, 2013); (Aydin and Seidel, 2008); (Ma
and Wang, 2015), and even machine learning (Jia and
Bull, 2017).
For LDR/SDR images, various methods in FR,
NR, and RR have been around for quite some time.
However, for HDR imaging, there are plenty of
FR/NR methods but not many on RR.
Based on the explanation above, the present study
will survey the objective quality evaluation for HDR
images.
The rest of the paper is organized as follows. In
the next section, we will briefly describe typical HDR
imaging pipeline. Subsequently, in Section 3 we will
discuss image quality assessment in general, followed
by Section 4 that will outline some of the existing
HDR IQA models in the literature. This will then be
followed by conclusion in Section 5.
Gunawan, I., Cloramidina, O., Syafa’ah, S., Kuntarto, G. and Santoso, B.
High Dynamic Range (HDR) Image Quality Assessment: A Survey.
DOI: 10.5220/0009354900330040
In Proceedings of the International Conferences on Information System and Technology (CONRIST 2019), pages 33-40
ISBN: 978-989-758-453-4
Copyright
c
2020 by SCITEPRESS – Science and Technology Publications, Lda. All rights reserved
33
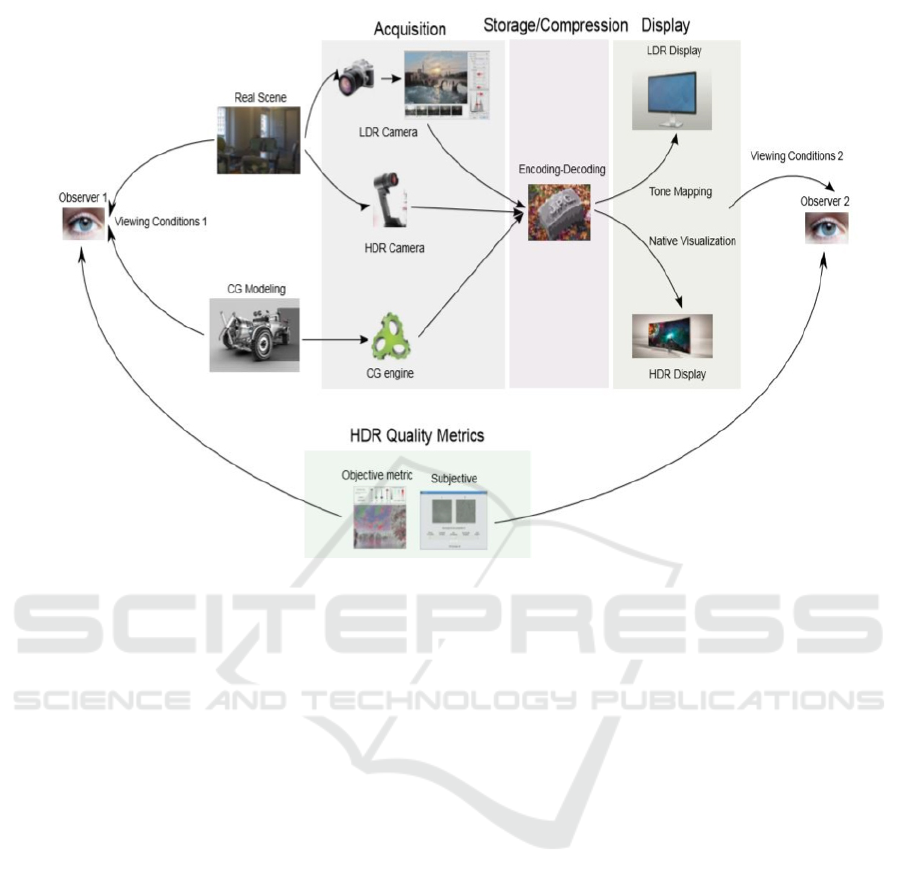
Figure 1: HDR imaging pipeline((Artusi and Mantiuk, 2017); (Mantiuk and Seidel, 2016)
2 HDR IMAGING PIPELINE
An illustration into HDR image and video processing
is given in Figure 1. It depicts an image pipeline from
acquisition through compression and quality evalua-
tion (Artusi et al., 2017; Mantiuk et al., 2016) in a
real world scene or in a rendered computer model.
Firstly, the HDR images are generated either by com-
puter graphic which makes a scene or captured form
a real world scene by a camera. Afterward, the im-
ages are compressed and encoded for storage or trans-
mission purposes. The encoding-decoding processes
are performed to convert the image into a more effi-
cient data format which requires less storage capacity.
Then, the images are visualized in a display device.
HDR content visualization is still limited by the
ability of the devices. To capture the dynamic range
of HDR by the lower specification device, tone map-
ping is employed. Other techniques such as color cor-
rection may also be used to handle the mismatches
between the HDR content and the display devices.
Conversely, there is also an Inverse Tone Mapping al-
gorithm with which an HDR content is reconstructed
from a single SDR content, and Multi-Exposure Im-
age Fusion (MEF) method that capable of generating
HDR images from SDR images.
Last but not least, the quality assessment of an im-
age or video is performed. The main goal of the qual-
ity assessment is to verify the algorithms of the stages
in the pipeline.
3 IMAGE QUALITY
ASSESSMENT
The demand for image-based applications is increas-
ing and causing the growing importance of the effi-
cient and reliable image quality evaluation (Moham-
madi and Shirani, 2014). There has been a rising
number of techniques and algorithms to perform im-
age quality assessment (IQA). IQA has found its us-
age in various applications; for example, image and
video coding, digital watermarking, denoising, image
synthesis, and many other areas. IQA can be used
for various purposes: quality monitoring, benchmark-
ing, or optimization in multimedia processing sys-
tems (Thung and Raveendran, 2009).
Imaging system can introduce a number of dis-
tortions or artifacts to the signal; this is an impor-
tant problem in the aspect of IQA (Patil and Sheel-
vant, 2015). The evaluation of human perception
comfort, namely Quality of Experience (QoE), is the
main objective of quality measurement of images
CONRIST 2019 - International Conferences on Information System and Technology
34

and videos (Opozda and Sochan, 2014). It was also
pointed out that image quality is affected by both ob-
server’s attributes and technical properties of presen-
tation (Opozda and Sochan, 2014).
Depending on how the evaluation is performed,
IQA can be achieved in one of two ways: subjective
and objective quality methods. Each of these methods
has its own unique way of evaluation. The following
sub-sections will describe a little bit more about these
evaluation methods.
3.1 Subjective Methods
Subjective quality assessment is a controlled exper-
iment with human participants used to measure per-
ceptual quality. In subjective assessment, human
judges are the golden standard without the advice of
others (Patil and Patil, 2017). Not only that, subjec-
tive methods can also (Ma et al., 2015):
• Provide data which is useful in the study of hu-
man behavior in the evaluation of image quality
perceptions
• Provide a set of tests to assess the relative per-
formance of various image processing algorithms
and methods and compare them
• Be used to assess the relative performance of ob-
jective Image Quality Assessment (IQA) models
that exist today in the prediction of integrated im-
age perceptual quality. This will also provide in-
sight into possible ways of improving it.
Based on the use of stimuli, subjective methods
are classified into single stimulus and double stimu-
lus (Patil and Patil, 2017). There are many different
methodologies and rules for the design of subjective
quality evaluation tests. Usually, in this type of as-
sessment, a number of observer are subjected to im-
ages with various degree of different quality, and are
asked to provide their quality evaluation of these im-
ages. Scores that are assessed by numerous subjects
arrive at the midpoint for each image to get an average
guess score.
Subjective method possess several drawbacks
(Hands, 1998):
• It takes time and money for the test;
• Recruit and pay for subjects;
• The equipment used must be tested and regulated;
• Laboratory;
• Experiments must run tests.
Subjective tests are usually complicated, imprac-
tical, and not feasible for certain applications (Win-
kler, 2005). People turn to objective tests for faster
and more practical results. Subsequently, objective
assessments are tested and verified based on selected
subjective judgments as the ground truth data.
3.2 Objective Methods
In numerous audio-visual services, objective mea-
surements are used to assess the influence of the cod-
ing system and transmission path on the quality of
multimedia data presentations. The goal is to for-
mulate mathematical models that automatically and
accurately predict the quality of the image. Some-
times the use of subjective judgments is necessary for
objective measurement that is appropriate as a refer-
ence evaluation. This allows precise measurements
for certain types of distortion: blur image, blurred
motion, edge, false contouring, granular noise, jerk-
iness, blockage, dirty window. Objective IQA is ap-
plied in various applications such as (Mohammadi
and Shirani, 2014):
• image quality monitoring in quality control sys-
tem
• image processing algorithms and systems com-
parison
• image processing and transmission systems opti-
mization
The Video Quality Expert Group (VQEG) has de-
fined three distinct methods for image/video quality
assessment based on the availability of reference im-
age: full reference (FR), reduced reference (RR), and
no reference (NR) methods (VQEG, 2000), (VQEG,
2002), (VQEG, 2004). These methods will be ex-
plained in the following Secio,
3.2.1 Full-Reference (FR)
Full-Reference (FR) method evaluates the perfor-
mance of the systems by comparing the undistorted
signal at the system input with the degraded signal at
the system output (Opozda and Sochan, 2014). In this
situation, the human visual system requires an allu-
sion sample to define an image’s excellent level (Patil
and Patil, 2017).
3.2.2 No-Reference (NR)
No-Reference (NR) image quality model makes use
of characteristics of HVS. Human eye does not need
a source test or is based only on the processed image
where the reference image is not available to deter-
mine the level of excellence of the image (Opozda and
Sochan, 2014); (Patil and Patil, 2017). The animation
quality rating scheme has no access to reference im-
ages in many tactical apps. It is therefore anticipated
High Dynamic Range (HDR) Image Quality Assessment: A Survey
35

that a measurement method will be developed that can
blindly assess image quality. NR method is also re-
ferred to as “blind models” (Patil and Patil, 2017).
The blind image quality size is difficult to design, but
it is more useful than a reference image.
3.2.3 Reduced-Reference (RR)
RR image quality assessment provides a useful solu-
tion method between the FR and NR quality assess-
ment approaches. They are designed with only partial
data about the reference pictures to predict percep-
tual image quality. Reduced-Reference (RR) method
evaluates system performance by comparing features
extracted from the undistorted signal at system input
with features extracted from the degraded signal at
system output (Gunawan, 2006) (Opozda and Sochan,
2014). The concept of RR quality assessment was
first suggested as a means of tracking the degree of
visual quality degradation of video information trans-
ferred through complicated communication networks.
The data rate used to encode side information
is a significant parameter in RR quality evaluation
schemes. If a high RR data rate is accessible, then
a big quantity of information about the reference im-
age can be included. If the data rate is big enough to
convey all the reference picture information, the re-
ceiver side can use the FR technique. While the RR
data rate is small, it is possible to send only a small
side information about the reference image. Some de-
sirable properties of RR characteristics are as follows:
• They should provide an efficient overview of the
reference image
• They should be susceptible to various distortions
of image, and
• They should have excellent perceptive signifi-
cance.
4 HDR IMAGE QUALITY
ASSESSMENT
In this section, we will outline some of the previ-
ous HDR image quality assessment models. The re-
view will be limited to cover the essential elements
in a full-reference and no-reference methodologies by
way of some examples.
4.1 HDR-VDP and HDR-VDP-2
HDR Visual Difference Predictor (HDR-VDP) (Man-
tiuk and Seidel, 2005) and its successor, HDR-VDP2
(Mantiuk and Heidrich, 2011) are two examples of
full reference model based on error/difference met-
ric that can predict perceived differences between
two images and, accordingly, the quality. The met-
rics were derived from several visual models capable
of measuring new contrast sensitivity for all lighting
conditions. As such, the models were calibrated and
tested against various contrast discrimination datasets
with arbitrary lighting range; e.g. LIVE database
(, 2006) and TID2008 (Ponomarenko and Battisti,
2009).
The model consists of alternative components that
were tested against a set of psychophysical measure-
ments, and the best components were selected and
adjusted to best fit the data. By doing this way, the
model was able to predict any differences between
two images as if it was observed by human viewer.
The components are:
• Psychophysical model that allows for the creation
of initial vision model;
• Advanced visual models for tone-mapping im-
ages;
• Quality metrics used predict the severity of the
image distortion
• Feature invariant metrics based on structural sim-
ilarity
Some of the components mentioned earlier are im-
portant elements to encourage the creation of all the
expected priorities. The first priority in their exper-
iment is accurate matching with experimental data,
whilst the second priority is computational complex-
ity, and then followed by the actual biological mech-
anism for reasonable modeling. The predictor of vi-
sual difference consists of two identical visual mod-
els; each of which is used to process the test and ref-
erence images.
HDR-VDP-2 was shown to have been able to out-
perform its predecessor, and hence it is considered
successful in becoming towards improved visibility
and quality predictors. However, despite its accom-
plishment, there are room for improvement. Model-
ing color vision and temporal processing are the two
main omissions. The temporal domain can be ex-
tended to include spatio-velocity and spatio-temporal
components. Existing achromatic models will benefit
from better spatial integration models, increased sen-
sitivity characteristics for each type of photoreceptor,
and enhanced masking models, calibrated to a wider
set of data. When distortion signals are not exactly
known, metrics can also consider less conservative as-
sumptions.
CONRIST 2019 - International Conferences on Information System and Technology
36

4.2 TMQI
Tone Mapped Quality Index (TMQI) (Yeganeh and
Wang, 2013) was proposed for objective quality eval-
uation on tone-mapped images. It is yet another full
reference model that combines the multi-scale deriva-
tion of structural similarity approach (SSIM) (Wang
and Bovik, 2003) with a measure of naturalness.
It is very common to visualize HDR images on
a standard screen, resulting in a display of LDR im-
ages, instead. This requires a tone mapping proce-
dure that may cause loss of information due to the
reduced dynamic range. Human viewer who is sub-
jected to the LDR version of the image may not real-
ize this loss, unfortunately. Hence, structural informa-
tion plays a significant role for the quality assessment
of tone mapped images. However, structural informa-
tion alone is not enough to provide an overal quality
assessment. In addition to preserving structural de-
tails, statistical properties are also important for get-
ting good quality mapped images.
Therefore, TMQI relies on the structural fidelity
of images as well as statistical naturalness as follows:
• Structural Fidelity, S The SSIM approach is a
practical method used to measure structural weak-
nesses between images. The original SSIM al-
gorithm contains three comparison components,
namely lighting, contrast and also the structure
applied locally.
• Statistical Naturalness, N Naturality is a quantita-
tively difficult to define subjective quantity. Sta-
tistical models of naturalness are based on statis-
tics at a gray-scale of around 3,000 8bits/pixel
representing different types of natural scenery.
• Quality Assessment Model The structural fidelity
and statistical naturalness described earlier char-
acterizes various aspects of image quality that are
mapped with tones. These two parameters must
be combined in several ways. The TMQI is de-
fined as equation 1.
Q = aS
a
+ (1 − a)N
β
(1)
where
– 0 ≤ a ≤ 1 is the relative significance of struc-
tural fidelity and statistical naturalness
– α and β determines the sensitivity of each
Since S and N are limited to unity, the overall
quality is also limited in the same way.
4.3 MEF IQA
MEF-IQA (Ma and Wang, 2015) is another full ref-
erence method that is specifically directed towards
MEFbased images. Similar to TMQI, MEF-IQA is
also based on multiscale structural similarity of MEF
images, but now it is combined with structural consis-
tency. MEF-IQA can also be used to set MEF algo-
rithms parameters.
To evaluate their model, a subjective evaluation
database was created. It consists of 17 sources se-
quences subjected to multiple exposure levels. The
MEF images were created by using eight classic and
sophisticated MEF algorithms.
The output of the quality model and the subjec-
tive data were then compared. This particular IQA
goal has the philosophy of highly adapting HVS to ex-
tract structural information from natural landscapes.
To balance the preservation of detailed scales and the
consistency of coarse luminaries, a multi-scale ap-
proach is used.
In designing and optimizing the new MEF algo-
rithm, a reliable objective model can play a key role.
To demonstrate this potential, the proposed model is
applied to adjust automatic parameters from a sophis-
ticated MEF algorithm. The problem of MEF can be
generally formulated as equation 2
Y (i) =
K
∑
k=1
W
k
X
k
(i) (2)
where
• K is the number of images with multiple expo-
sures in the source sequence
• X
k
(i) luminance value (or transformation domain
coefficient amplitude)
• W
k
is the i-th pixel weight the k-th exposure image
Eight MEF algorithms from various previous
studies were used in this experiment. These algo-
rithms are chosen based on methodology and behav-
ior that includes various types of MEF methods. MOS
values of 8 MEF algorithms are used for evaluation
and comparison with subjective test performance.
In addition, an examination of how the informa-
tion in the sequence of multi-exposure images is per-
formed in images that are fused at each spatial lo-
cation is based on the general construction of the
SSIM. The SSIM approach results in looking at image
patches from three distinct aspects: lighting, contrast,
and structure.
4.4 DL-NRIQA
This model was proposed by (Jia and Bull, 2017).
They produce No-Reference Image Quality Assess-
ment (NR-IQA) method by combining deep Convo-
lutional Neural Networks (CNNs) with saliency maps
on High Dynamic Range (HDR) images.
High Dynamic Range (HDR) Image Quality Assessment: A Survey
37

The strength of the CNN architecture is used to
extract quality features that can be used on the SDR
and HDR domains. Input images are broken down
into patches and based on the features presented in
each patch quality patch are carried out on CNN-
based methods. In the proposed method, CNN is only
applied to a subset of patch images that stand out for
evaluation.
For the experiment, they used two different
datasets, SDR and HDR datasets. In SDR datasets,
they use LIVE dataset and CSIQ dataset to learn SDR
quality feature. The HDR dataset is used to train the
proposed method and evaluate its performance.
The steps in their proposed method are as follows:
1. Normalize each image locally using the algorithm
proposed in each dataset
2. Divide each image into a set of small patches of
size 32 x 32 pixels
3. Use salience maps calculated on each image to
set weights for each patch instead of studying net-
work activation weights. Each pixel value of the
salience map is repeated back to the range [0,1].
The addition of pixel values in salient patches
is defined to represent the importance of image
patches.
4. Apply evaluation using the Linear Correlation
Coefficient (LCC) and the Spearman Rank-order
Correlation Coefficient (SRCC).
In the NR-IQA HDR experiment, the CNN-based
method with salient maps provides sophisticated per-
formance, competing with the full IQA reference
method.
4.5 Higrade
One paper discussing other NR models is written by
(Kundu and Evans, 2017). They proposed another
model of NR IQA for HDR images based on band-
pass standard measurements and on differential Nat-
ural Scene Statistics (NSS). The algorithm to be used
is obtained from the HDR Image GRADient Evalua-
tor (HIGRADE). They described the features used in
the model of NR-IQA. These features include estab-
lished descriptors of NSS quality and new features for
processing data in images of the HDR process. Typ-
ically, HDR process artifacts modify the NSS feature
extracted from image gradients. This deviation can be
used to enhance human subjective response predic-
tions. The following are some perceptually relevant
features used in the proposed NR-IQA model:
• Log-Derivatives/Log Gradient feature to predict
the natural image quality that artifacts (non-HDR)
are affected by processing.
• Spatial Domain Scene Statistics that were pro-
cessed with mean subtracted contrast normalized
(MSCN).
• Gradient Domain Scene Statistics for both gra-
dient magnitude and gradient orientation:
1. Gradient Magnitude Features calculated using
a simple Sobel operator to convert the image.
2. Gradient Structure Tensor Features based on
gradient magnitudes
Among the 12 NR-IQA models that were tested,
the proposed HIGRADE algorithms were found
to be the highest performing predictors of human
perceptual judgments of visual HDR artifacts. It
has also been shown that the HIGRADE features
are effective in evaluating the artifacts that arise in
SDR images.
4.6 NR HDR IQA
(Guan and Chen, 2018) proposed a quality rating
method without new references to HDR images. The
tensor space used in their study functions effectively
to define and extract new HDR image features and
representation space for new HDR features. In ad-
dition, image manifold features also used to evaluate
visual quality can produce results with higher subjec-
tive consistency. From the Tensor Decomposition and
Manifold Learning methods proposed, there are three
main points to become HDR image processing guides
that are briefly reviewed:
1. The tensor space is built and used to effectively
define and extract new HDR image features. The
tensor space is obtained by using tensor decom-
position to maintain three sets of HDR, assessing
HDR color image quality accurately and the struc-
ture of HDR image information;
2. Furthermore, in the first feature map, learning
manifolds are used to find inherent high dimen-
sional data geometric structures in low dimen-
sional manifolds. It contains primary energy and
important information about structural features on
the image;
3. In addition, in the first map features the first
extracted manifold structure multi-scale. While
multi-scale contrast features are extracted for
maps of the second and third features of HDR im-
ages, they reflect contrast information felt in detail
from the HDR image.
The extracted features were aggregated after per-
forming the above process by Supporting Vectors Re-
gression (SVR) to obtain the objective quality score
for HDR images.
CONRIST 2019 - International Conferences on Information System and Technology
38
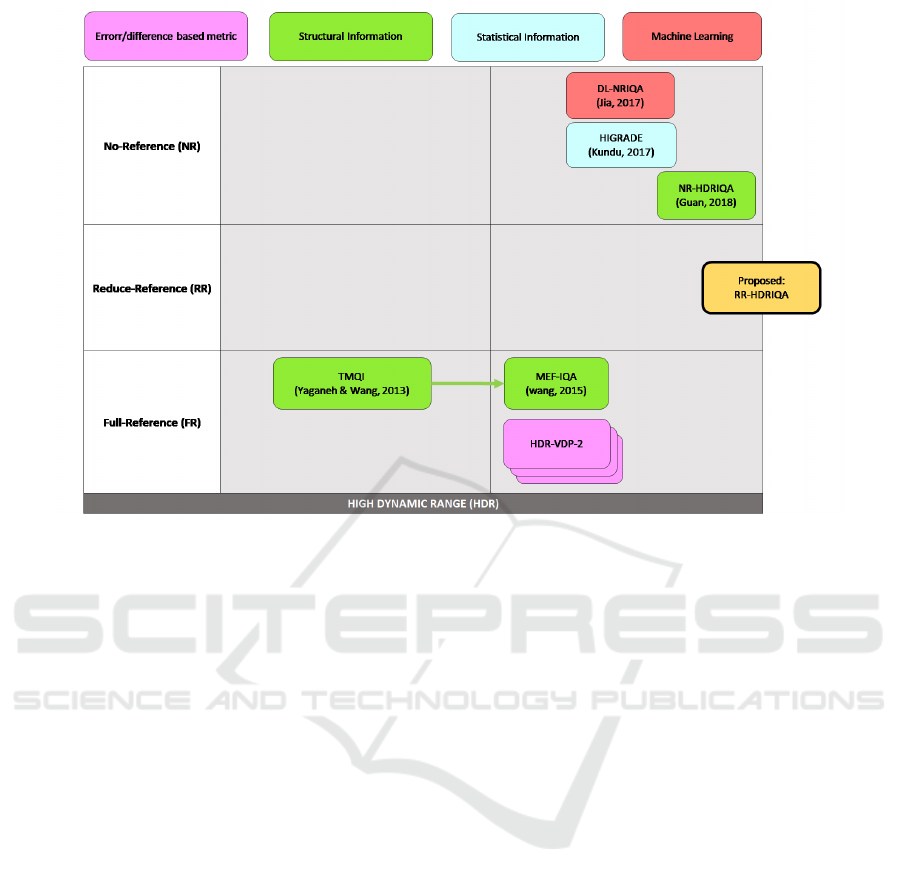
Figure 2: Our proposed research road map
Their results showed that the proposed method
is consistent with subjective data. For a certain
database, it even outperformed some of the full ref-
erence HDR IQA such as HDR-VDP-2.2 methods.
5 CONCLUSIONS
We have surveyed various HDR image quality as-
sessment in the literature and found that many have
focused on the development of FR and NR model.
Therefore, development on RR model is considered
necessary. In line with that argument, we have ini-
tiated research on the development of RR model for
HDR IQA, using a research roadmap presented in
Figure 2. Some of our preliminary results have also
been published in (I. P. Gunawan and Santoso, 2019a)
and (I. P. Gunawan and Santoso, 2019b).
ACKNOWLEDGEMENTS
The author would like to thank the Indonesian
Ministry of Research and Higher Education un-
der the contract No. 11/AKM/PNT/2019, and
Universitas Bakrie, Indonesia, under the con-
tract No. 086/SPK/LPP-UB/III/2019 and No.
141/SPK/LPPUB/III/2019 for the funding of the re-
search presented in this paper.
REFERENCES
(2006). Live public-domain subjective image quality
database.
Artusi, A., R. T. E. T. and Mantiuk, R. K. (2017). High
dynamic range imaging technology [lecture notes]. In
IEEE Signal Processing Magazine, 34(5), 165–172.
IEEE.
Aydin, T. O., M. R. M. K. and Seidel, H. (2008). Dynamic
range independent image quality assessment. In ACM
Trans. Graph., 27(3):69:1–69:10. ACM.
Guan, F., J. G. S. Y. Y. M. P. Z. and Chen, F. (2018). No-
reference hdr image quality assessment method based
on tensor space. In 2018 IEEE International Con-
ference on Acoustics, Speech and Signal Processing
(ICASSP), pages 1218–1222. IEEE.
Gunawan, I. P. (2006). Reduced-reference impairment met-
rics for digitally compressed video. University of Es-
sex, Essex, phd thesis edition.
Hands, D. S. (1998). Mental processes in the evaluation
of digitally-coded television pictures. University of
Essex, Essex, phd thesis edition.
I. P. Gunawan, O. Cloramidina, S. B. S. G. P. K. and San-
toso, B. I. (2019a). Hid3riqa: High dynamic range
reduced-reference image quality assessment methods.
In ICKII 2019 (IEEE International Conference on
Knowledge Innovation and Invention), 13–16 July
2019, Seoul, South Korea. IEEE.
I. P. Gunawan, O. Cloramidina, S. B. S. G. P. K. and San-
toso, B. I. (2019b). Hid3riqa: High dynamic range
reduced-reference image quality assessment methods.
In ICKII 2019 (IEEE International Conference on
High Dynamic Range (HDR) Image Quality Assessment: A Survey
39

Knowledge Innovation and Invention), 13–16 July
2019, Seoul, South Korea. IEEE.
Jia, S., Z. Y. A. D. and Bull, D. (2017). Blind high dynamic
range image quality assessment using deep learning.
In 2017 IEEE International Conference on Image Pro-
cessing (ICIP), pages 765–769. IEEE.
Kundu, D., G. D. B. A. C. and Evans, B. L. (2017). No-
reference quality assessment of tone mapped hdr pic-
tures. In IEEE Transactions on Image Processing,
26(6):2957–2971. IEEE.
Ma, K., Z. K. and Wang, Z. (2015). Perceptual
quality assessment for multi-exposure image fu-
sion. In IEEE Transactions on Image Processing,
24(11):3345–3356. IEEE.
Mantiuk, R., D. S. J. M. K. and Seidel, H.-P. (2005). Pre-
dicting visible differences in high dynamic range im-
ages: model and its calibration. In Human Vision and
Electronic Imaging X, volume 5666, pages 204–215.
International Society for Optics and Photonics.
Mantiuk, R., K. K. J. R. A. G. and Heidrich, W. (2011).
Hdr-vdp-2: a calibrated visual metric for visibility
and quality predictions in all luminance conditions.
In ACM Transactions on graphics (TOG), volume 30,
page 40. ACM.
Mantiuk, R. K., M. K. and Seidel, H.-P. (2016). High dy-
namic range imaging. In Wiley Encyclopedia of Elec-
trical and Electronics Engineering. Wiley.
Mohammadi, P., E.-M. A. and Shirani, S. (2014). Subjective
and objective quality assessment of image: A survey.
arXiv preprint arXiv:1406.7799.
Opozda, S. and Sochan, A. (2014). The survey of subjec-
tive and objective methods for quality assessment of
2d and 3d images. In Theoretical and Applied Infor-
matics, 26(1-2):39–67.
Patil, S. and Sheelvant, S. (2015). Survey on image
quality assessment techniques. In Int. J. Sci. Res,
4(7):1756–1759.
Patil, S. B. and Patil, S. R. (2017). Survey on approaches
used for image quality assessment. In 2017 In-
ternational Conference on Energy, Communication,
Data Analytics and Soft Computing (ICECDS), pages
987–991.
Ponomarenko, N., L.-V. Z. A. E. K. C. M. and Battisti,
F. (2009). Tid2008-a database for evaluation of full-
reference visual quality assessment metrics. In Ad-
vances of Modern Radioelectronics, 10(4):30–45.
Thung, K.-H. and Raveendran, P. (2009). A survey of image
quality measures. In 2009 international conference
for technical postgraduates (TECHPOS), pages 1–4.
IEEE.
VQEG (2000). Final report from the Video Quality Expert
Group on the validation of objective models of video
quality assessment – Phase I. VQEG.
VQEG (2002). Video quality experts group. VQEG.
VQEG (2004). RRNR-TV Group Test Plan Draft Version
1.7h. VQEG.
Wang, Z., S.-E. P. and Bovik, A. C. (2003). Multi-
scale structural similarity for image quality assess-
ment. In The Thrity-Seventh Asilomar Conference on
Signals, Systems & Computers, 2003, volume 2, pages
1398–1402. IEEE.
Winkler, S. (2005). Digital video quality: vision models
and metrics. John Wiley & Sons.
Yeganeh, H. and Wang, Z. (2013). Objective quality assess-
ment of tone-mapped images. In IEEE Transactions
on Image Processing, 22(2):657–667. IEEE.
CONRIST 2019 - International Conferences on Information System and Technology
40
