
Evaluating User Experience on E-learning using the User Experience
Questionnaire (UEQ) with Additional Functional Scale
Muhammad Qadhafi Laksono
1
, Sri Suning Kusumawardani
2
and Ridi Ferdiana
2
1
Master Student in Department of Electrical and Information Engineering, Gadjah Mada University, Yogyakarta, Indonesia
2
Department of Electrical and Information Engineering, Gadjah Mada University, Yogyakarta, Indonesia
Keywords: UX, LMS, E-learning, UEQ, SCORM
Abstract: eLisa is a Learning Management System (LMS) used by most Gadjah Mada University students. After an
extended usage period, eLisa has not undergone many changes and updates, so it is necessary to know the
user's wishes for the development of eLisa going forward. Currently, eLisa is focusing its development on the
mobile phone platform. This paper will explain the measurement of user experience scores (UX) using the
User Experience Questionnaire (UEQ) and combined with the reference model standards to meet the Sharable
Content Object Reference Model (SCORM). SCORM is combined with UEQ because it is considered an
appropriate standard for presenting functionality in LMS, so eLisa can represent educational content that can
be shared but also in the interface between eLisa content and e-learning platforms uses. The results of
evaluating user experience with a combination of these two methods show that from the calculated aspects
such as Attractiveness, Pragmatic Quality, Hedonic Quality and also Functionality. The evaluation value of
UX eLisa that we got was terrible. Where out of the nine scales we calculate, six of them got bad results, and
the other three were still below average.
1 INTRODUCTION
Indonesia is a country that has a positive trend in the
development of e-learning or online education. With
an average growth of 25% every year, Indonesia is
ranked 8th in the world based on the total e-learning
market (Squline.com, 2017). At present, the
community is developing into a society with high
mobility, so the need for learning media that supports
the level of mobility that exists in the community,
especially in universities.
There is a considerable interest in exploiting the
appeal of universal and abundant technology for use
in education, consequently learning with technology
becomes prevalent and becomes an ample
opportunity for research. In developing countries,
mobile phone are better devices than desktop or
laptop computers (Shen, Xie and Shen, 2014). So that
learning accessed via mobile phones becomes a new
opportunity in the development of future educational
technology.
One e-learning that is developing is the LMS
(Learning Management System). The university that
implements and develops its own LMS is Gadjah
Mada University (UGM), we commonly call this
LMS eLisa (eLearning System for Academic
Communities). The first goal of developing eLisa is
to be used intensively by lecturers in supporting all
teaching activities. However, in daily learning
activities, there are still many lecturers who have not
used eLisa well. Some lecturers prefer to use other e-
learning such as Google Classroom, Edmodo,
Schoology and others. eLisa serves to facilitate the
process of direct learning in class and online in the
context of lectures. The development of eLisa itself is
very much realized by the needs of users, especially
the needs of academics in the UGM campus
environment. It can be said that students and lecturers
play an essential role in developing eLisa in the
future. (Dahrurozak, 2017).
The Center for Innovation and Academic Studies
(PIKA) UGM, which is an eLisa developer, also
states that current eLisa users do not meet their
expectations. Therefore, there is a need to design
eLisa to be applied for mobile phones. This
development is expected to attract the interest of
eLisa users. There are two challenges that eLisa will
face in developing into applications that can be
accessed using mobile phones, and those challenges
18
Laksono, M., Kusumawardani, S. and Ferdiana, R.
Evaluating User Experience on E-learning using the User Experience Questionnaire (UEQ) with Additional Functional Scale.
DOI: 10.5220/0009339900180024
In Proceedings of the International Conferences on Information System and Technology (CONRIST 2019), pages 18-24
ISBN: 978-989-758-453-4
Copyright
c
2020 by SCITEPRESS – Science and Technology Publications, Lda. All rights reserved
are appearance and functionality. Therefore, it is good
to measure previous user experience to get someone's
perception and response from using eLisa. Different
interpretations are used to define user experience with
quality criteria using the User Experience
Questionnaire (UEQ) (Schrepp and Hinderks, 2014).
Also, to find out whether functionality also influences
user experience, the author tries to combine UEQ
with the SCORM reference model which is
considered a benchmark in the analysis and
comparison of e-learning platforms. The reference
model taken is only a specification divided into three
areas, namely content, interaction, and management,
to meet the SCROM online learning presentation
standards (Buendía and Hervás, 2006). This study
aims to analyze whether functionality affects the e-
learning user experience so that when eLisa is applied
to a mobile phone, eLisa becomes e-learning in
accordance with the user's wishes.
2 USER EXPERIENCE FOR
E-LEARNING
2.1 User Experience Questionnaire
(UEQ)
In 2005 UEQ was first designed by a data analysis
approach to ensure practical relevance for creating
different qualities at each scale. It consists of 229
potential items related to user experience in the
German version. Then it is reduced to 80 sets of items
from the questionnaire with evaluation from experts
(Schrepp and Hinderks, 2014). In several studies
focusing on product quality using 80 sets of raw
items, finally found 6 UEQ scales and items extracted
from several data sets that are considered to be
represent. Where each item represents two terms with
opposite meanings (Schrepp, 2015). Conversion to
some of their natural languages is also done to get
semantic differences like in UEQ. Some of the
languages that have been built and validated are
English, Spanish (Rauschenberger et al., 2013),
Portuguese (Cota et al., 2014), and many more. One
of them is Indonesian (Santoso et al., 2016). For
Germany, there are also simplified versions of
children and young people (Hinderks et al., 2012).
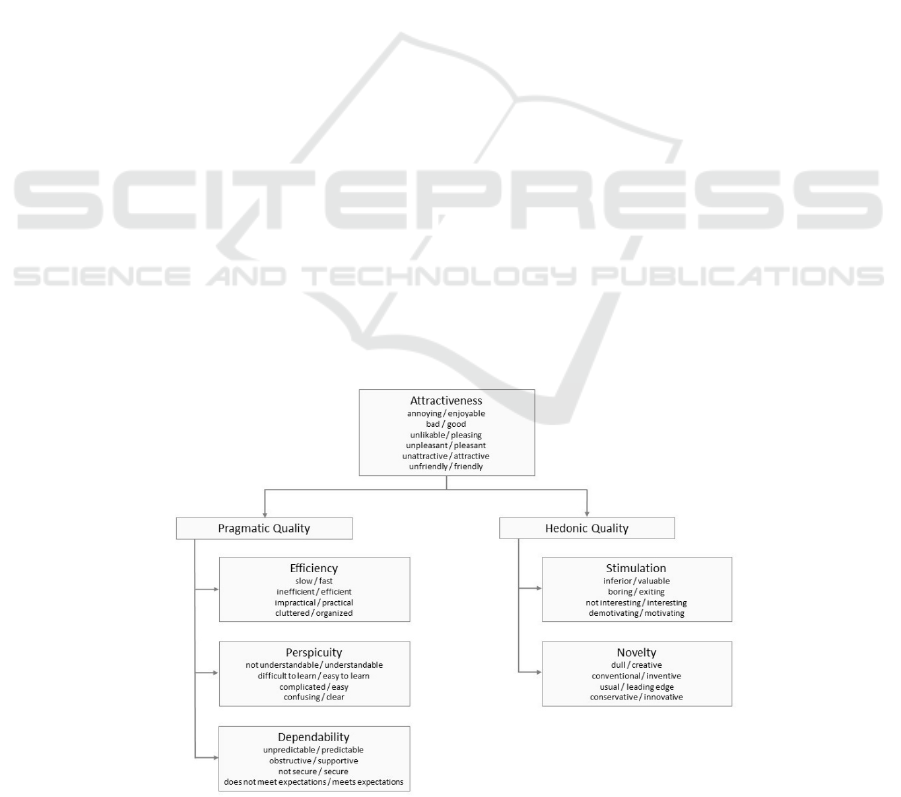
The following is an interpretation of the structure of
the UEQ scale which contains six scales with 26 items
in Figure 1. Attractiveness is a pure ranking
dimension, Perspicuity, Efficiency and Dependability
are pragmatic quality aspects (directed towards the
goal), and for the hedonic quality aspects there are
Stimulation and Novelty (Schrepp, 2015):
Attractiveness: Overall impression of the
product. Do users like or dislike is?
Perspicuity: Is it easy to get familiar with the
product? Is it easy to learn how to use the
product?
Efficiency: Can users solve their tasks with the
product without unnecessary effort?
Dependability: Do the users feel in control of
the interactions?
Stimulation: Is it exciting and motivating to use
the product?
Novelty: Is the product innovative and
creative? Does the product interest users?
Figure 1: Assumed scale structure of the UEQ.
Evaluating User Experience on E-learning using the User Experience Questionnaire (UEQ) with Additional Functional Scale
19
2. 2 Sharable Content Object Reference
Model (SCORM)
SCORM (Sharable Content Object Reference Model)
illustrates how learning content standards are
presented in LMS to make easy portability of LMS
learning content and reuse learning objects to other
platforms (Bohl et al., 2002). Not only its ability to
represent educational content that can be shared but
also the interface between content and the e-learning
platform it uses. There are two main components in
SCORM, namely CAM (Content Aggregation
Model), which defines a model for packaging
learning content and RTE (Run-Time Environment),
which defines the interface to allow communication
between learning content and other platforms
(Buendía and Hervás, 2006). The following Table 1
is a DemoScorm evaluation to meet the standard
reference model.
Table 1: DemoScorm evaluation criteria.
Criteria
Content
Writing / SCORM editions allowed
External sources can be seen
Multimedia content can be displayed
Organizational structure can be chosen
Content navigation is activated
Interaction
Announcement or discussion board available
Tasks can be sent
Collaboration tools can be used
Email service-connected
Management
SCORM packages can be imported
Navigation options can be configured
Assessment facilities are provided
Phone book items are allowed
SCO Grading is displayed
Phone book item updated
Item tracking allowed
Tracking results updated
3 METHOD
3.1 Research Object
The object of research is the e-learning system for the
academic community, commonly called eLisa. This
Learning Management System is one of the e-
learning developed based on user needs by UGM and
used by most academics at UGM. eLisa was
developed to support all incentive teaching activities
carried out by lecturers and work to facilitate the
learning process in lectures both in class and online.
Now eLisa can only be accessed through the website;
this is an obstacle to the lack of interest of UGM
users, especially lecturers, to support lectures
conducted at eLisa. For other users such as students,
they use eLisa if their lecturers use eLisa to support
teaching activities. The Center for Innovation and
Academic Studies (PIKA) UGM, which is an eLisa
developer, also states that current eLisa users do not
meet their expectations. Therefore, there is a need to
design eLisa to be applied for mobile phones.
However, before that, it must be known whether the
lack of functionality in eLisa affects the use of eLisa.
3.2 Research Subject
The subjects of this study were students from several
faculties at UGM who had used eLisa for at least one
semester. Demographically, the total number of
subjects is 30 people. We obtained our subjects by
distributing questionnaires through Google Forms,
which we have adjusted to UEQ for eLisa users on
UGM campus. To get respondents, we have difficulty
because eLisa users are currently very few. With
interviews, we do it with first-year and second-year
students in various faculties. The result is that many
lecturers no longer use eLisa. So we met a lot of first
and second-year students who never used eLisa and in
senior student interviews, most of them used eLisa in
their first year of college. So this qualification is not
suitable for them as our research respondents because
the majority of users who have long been difficult to
remember their experience when using eLisa. The data
we obtained were qualitative and quantitative data
from the questionnaires that we distributed,
quantitative data derived from UEQ questions, while
our qualitative data were obtained from open
questions related to objects in the study at the end of
the questionnaire session.
3.3 Implementation
Evaluations are carried out to get a quick assessment
of user experience and express feelings, impressions,
and attitudes that arise when they use eLisa on mobile
phones (Schrepp, Hinderks and Thomaschewski,
2017). The addition of question items to UEQ was
also carried out to find out if other factors influenced
the lack of user experience on eLisa mobile. The
items selected are questions related to functionality in
eLisa. This additional question is based on the
SCORM method, where this method is a standard that
is very often used to develop e-learning. This
application only covers reference models from
research conducted by Félix Buendía et al., A
benchmark called DemoScorm (Buendía and Hervás,
2006). This tool is used to get benchmarks from the
SCORM standard. UEQ has given a special
CONRIST 2019 - International Conferences on Information System and Technology
20
questionnaire to determine the scale of the most
suitable product, and they call it UEQ +. There is a
scale that is formulated to determine the value of
content that is Quality Content, but we want to try to
apply other methods to find the value of functionality
scale, especially those that are very suitable for e-
learning user experience.
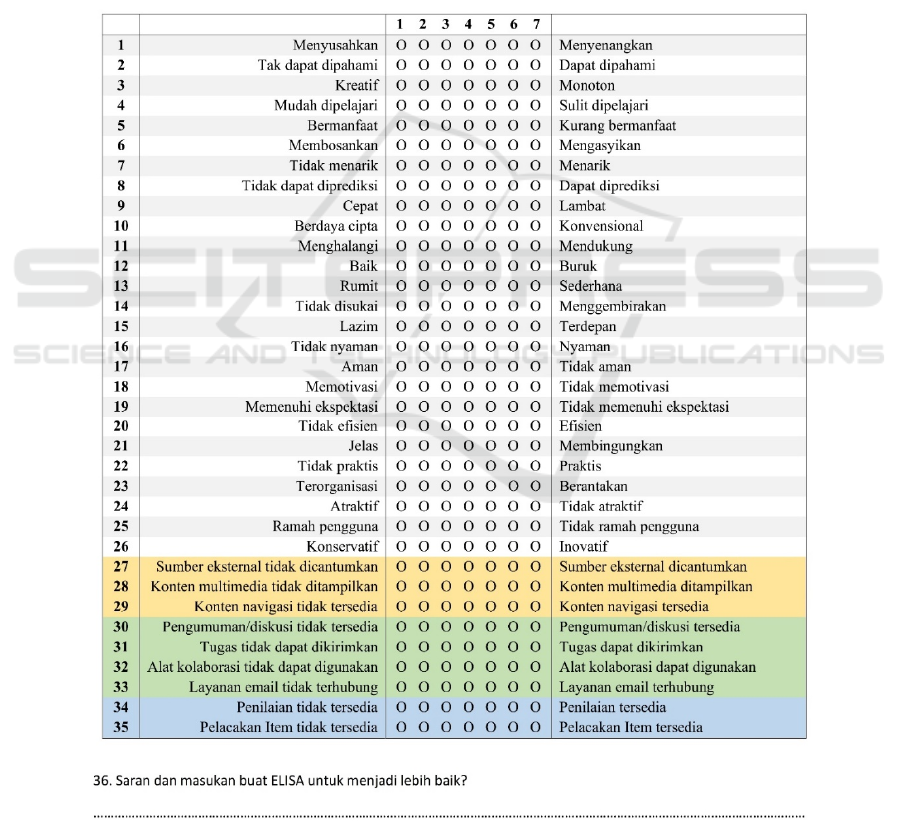
This reference model was changed to be a question
suitable for the UEQ questionnaire. We use UEQ with
the Indonesian version to match the language used by
respondents, so we also change the reference model
about SCORM to Indonesian. Examples of UEQ that
we have added to the SCORM reference model that
we will share with respondents are in Figure 2 in the
Indonesian version. Items 1 to item 26 are items from
UEQ, and the next items are items 27 to items 35.
These items is a reference model item from SCORM
that we have converted to the UEQ questionnaire
model. For the grouping of scales in the SCORM
reference model, we distinguish between several
colors, yellow for the content scale, green for the
interaction scale, and blue for the management scale.
Later there will be nine assessment scales resulting
from the six scales (Attractiveness, Perspicuity,
Efficiency, Dependability, Stimulation, and Novelty)
originating from UEQ and the other three scales
(Content, Interaction, and Management) are the
development of the SCORM reference model.
Figure 2: Combination of UEQ (Indonesian version) and SCORM standard reference model.
Evaluating User Experience on E-learning using the User Experience Questionnaire (UEQ) with Additional Functional Scale
21
4 RESULT AND DISCUSSION
In this study, we combine the UEQ and SCROM
methods to get different patterns when analyzing user
experience for e-learning. At the stage of combining
this method, we did not feel any significant obstacles.
Before continuing to analyze using the UEQ tool, we
determined three additional scales to be used from the
SCORM reference model, then we determined what
items we could use based on evaluating the
DemoScorm criteria in table 1 to match the e-learning
characteristics in eLisa. Because basically, eLisa does
not use SCORM as its framework, so not all the
criteria in SCORM that we apply to determine items
on three additional scales. We don't use a number of
criteria that don't match the eLisa character. For
example, on the content scale of the five criteria in
our DemoScorm evaluation, we only use three criteria
(External sources can be seen, Multimedia content
can be displayed, and Content navigation is
activated), then on the interaction scale we use all the
criteria (Announcement or discussion board
available, Tasks can be sent, Collaboration tools can
be used, and Email service-connected), and on the
management scale we use two criteria (Grading is
displayed, and Item tracking allowed) of the eight
criteria that will be determined to be items on three
additional scales. Questions about the SCORM
reference model that we have entered into UEQ can
be analyzed properly by the UEQ data analysis tool.
With a slight change in data input and pattern
adjustments, we performed a calculation analysis
with that tool. The first is determining the benchmark
intervals needed on three additional scales of the
SCORM reference model. Because there is no
research on this issue and UEQ only provides unique
benchmarks for two products (Schrepp, 2015), we
take the average benchmarks needed for each UEQ
scale and then apply them equally on our three
additional scales. In table 2, we explain the
comparison of the benchmarks we used in the study,
for three additional scales with the benchmarks we
marked in green.
Table 2: Interval comparison on the SCORM scale with the UEQ scale.
Attractiveness Perspicuity Efficiency Dependability Stimulation Novelty
SCORM
Item
Bad ≥ 1.75 ≥ 1.9 ≥ 1.78 ≥ 1.65 ≥ 1.55 ≥ 1.4 ≥ 1.67
Below
Average
≥ 1.52
< 1.75
≥ 1.56
< 1.9
≥ 1.47
< 1.78
≥ 1.48
< 1.65
≥ 1.31
< 1.55
≥ 1.05
< 1.4
≥ 1.4
< 1.67
Above
Average
≥ 1.17
< 1.52
≥ 1.08
< 1.56
≥ 0.98
< 1.47
≥ 1.14
< 1.48
≥ 0.99
< 1.31
≥ 0.71
< 1.05
≥ 1.01
< 1.4
Good
≥ 0.7
< 1.17
≥ 0.64
< 1.08
≥ 0.54
< 0.98
≥ 0.78
< 1.14
≥ 0.5
< 0.99
≥ 0.3
< 0.71
≥ 0.58
< 1.01
Excellent < 0.7 < 0.64 < 0.54 < 0.78 < 0.5 < 0.3 < 0.58
The results of the questionnaire analysis carried out
from 30 respondents, and literature studies show that
eLisa currently has a bad impression on its users. An
update is needed to attract more users using eLisa.
Figure 3 explains from our analysis that almost all
UEQ scales have shown bad results for the eLisa user
experience. Four of the six scales showed bad results,
and two other showed results that were still below
average.
The results we got from the SCORM reference model
is bad. In Figure 4 of the three scales that describe the
SCORM reference model, 2 of which are bad, and the
other results are still below average. These results
indicate that the functionality of eLisa also affects
users. The tendencies of users who are not
comfortable using eLisa influence each other.
Evidenced by the nine scales analyzed, almost all
scales produce bad result.
CONRIST 2019 - International Conferences on Information System and Technology
22
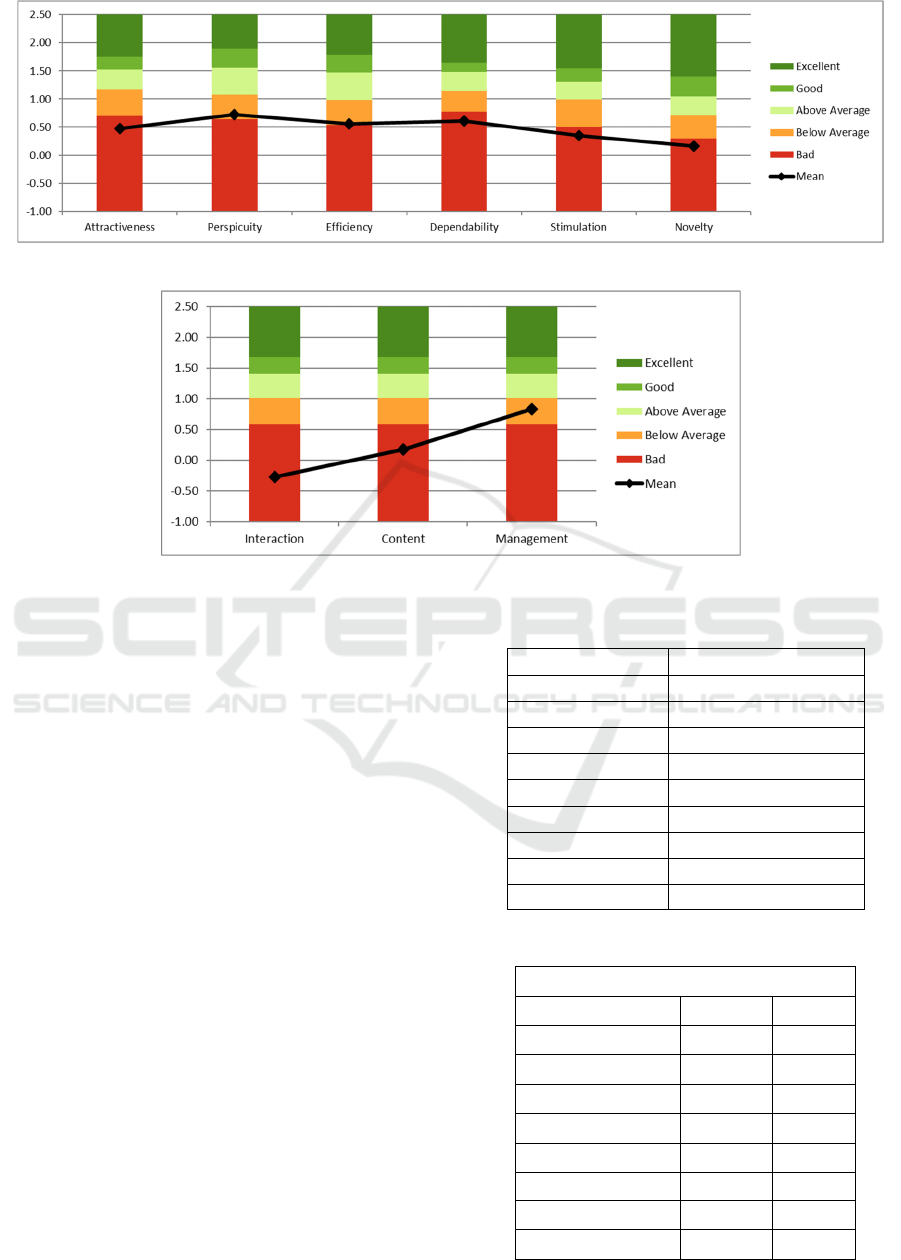
Figure 3: UEQ benchmark on eLisa.
Figure 4: SCORM reference model benchmark on eLisa.
Next, we can see the Cronbach Alpha coefficient
value, which represents the reliability of the data with
the consistency of all items contained in each scale.
UEQ evaluation data can be said to have high
consistency if the Cronbach Alpha coefficient value
is greater or equal to 0.7. The following Table 3
presents the Cronbach Alpha values of each scale
while in Table 4 describes the results for the mean and
variance. On the scale of interaction and content has
a low consistency because the scale of the interaction
of eLisa mobile now does have design limitations.
When we access eLisa through a smartphone, eLisa's
responsive design does not cover the entire page so
that on some pages our access will be directed back
to the web design version of eLisa and to scale the
content the problem is that many eLisa users switch
to using other e-learning, so that much content is not
updated. Based on the value calculation carried out by
combining the two methods with the UEQ calculation
format, this calculation can be used to support the
items needed. However, it needs to be understood
further. There must be a match of data taken for the
calculation and adjustment of the formula so that the
calculation can find results.
Table 3: Cronbach Alpha reliability coefficient.
Scale Cronbach Alpha
Attractiveness 0.91
Perspicuity 0.89
Efficiency 0.91
Dependability 0.85
Stimulation 0.90
Novelty 0.85
Interaction -2.76
Content 0.22
Management 0.75
Table 4: Calculation of mean and variance on eLisa.
UEQ Scale (Mean dan Variance)
Attractiveness 0.478
1.49
Perspicuity 0.725
1.75
Efficiency 0.558
2.19
Dependability 0.608
1.52
Stimulation 0.350
1.49
Novelty 0.158
1.26
Interaction -0.275
0.16
Content 0.178
0.60
Management 0.833
1.40
Evaluating User Experience on E-learning using the User Experience Questionnaire (UEQ) with Additional Functional Scale
23

5 CONCLUSION
Based on the results and discussion above it can be
concluded that the evaluation of user experience on
eLisa using UEQ and the scale of additional
functionality will be explained at the points below:
Adding the scale of functionality used is
suitable for knowing whether the content on
eLisa affects usage.
The use of the SCORM reference model is
perfect for evaluating e-learning functionality.
The results obtained from evaluating the user
experience of eLisa are bad. Of all the scales
measured, 6 scaled bad results, and three others
were below average. The following breakdown
of each score obtained is an attractiveness of
0.478, perspicuity 0.725, efficiency 0.558,
dependability 0.608, stimulation 0.350, novelty
0.158 and 3 additional scales namely
interaction -0.275, content 0.178, management
0.833.
Qualitative data obtained also show the same
level of badness. The majority of respondents
want a change in interface design and increased
interaction with eLisa.
These results become a reference so that eLisa in the
future gets an evaluation according to the user's
wishes. To add functionality to the scale, it is
necessary to adjust the input data, adjust the pattern,
and the analytical tools used to calculate the
appropriate UEQ. There are some limitations in
research that can be improved in further research.
Researchers may recruit more participants as simple
audiences in future studies as elisa users increase, so
the functionality scale has benchmark accuracy.
Additional scales for evaluating functionality may be
used in several other studies as items in UEQ
evaluations. But not all e-learning will be appropriate
using this functionality scale because this scale is
designed with the characteristics of eLisa. For future
research it is necessary to design further scale of
functionality so that it can be used as a benchmark for
other e-learning or general products.
REFERENCES
Bohl, O. et al. (2002) ‘The sharable content object reference
model (SCORM) - A critical review’, Proceedings -
International Conference on Computers in Education,
ICCE 2002, pp. 950–951. doi:
10.1109/CIE.2002.1186122.
Buendía, F. and Hervás, A. (2006) ‘An evaluation
framework for e-learning platforms based on
educational standard specifications’, Proceedings -
Sixth International Conference on Advanced Learning
Technologies, ICALT 2006, 2006, pp. 184–186.
Cota, M. P. et al. (2014) ‘Efficient Measurement of the User
Experience. A Portuguese Version’, Procedia
Computer Science, 27, pp. 491–498. doi:
https://doi.org/10.1016/j.procs.2014.02.053.
Dahrurozak, D. (2017) Analisis User Experience Elisa
Dengan Pendekatan User-Centered Design dan
Metode Evaluasi Usability Testing. Gadjah Mada
University.
Hinderks, A. et al. (2012) Konstruktion eines Fragebogens
für jugendliche Personen zur Messung der User
Experience.
Rauschenberger, M. et al. (2013) ‘Efficient Measurement
of the User Experience of Interactive Products. How to
use the User Experience Questionnaire (UEQ).
Example: Spanish Language Version’, International
Journal of Interactive Multimedia and Artificial
Intelligence, 2, pp. 39–45. doi:
10.9781/ijimai.2013.215.
Santoso, H. B. et al. (2016) ‘Measuring user experience of
the student-centered E-learning environment’, Journal
of Educators Online, 13(1), pp. 1–79.
Schrepp, M. (2015) ‘User Experience Questionnaire
Handbook Extension of the User Experience
Questionnaire View project No Project View project’,
Www.Ueq-Online.Org, (September). doi:
10.13140/RG.2.1.2815.0245.
Schrepp, M. and Hinderks, A. (2014) ‘Applying the User
Experience Questionnaire (UEQ) in Different
Evaluation Scenarios’, 8517(03). doi: 10.1007/978-3-
319-07668-3_37.
Schrepp, M., Hinderks, A. and Thomaschewski, J. (2017)
‘Construction of a Benchmark for the User Experience
Questionnaire (UEQ)’, International Journal of
Interactive Multimedia and Artificial Intelligence, 4(4),
p. 40. doi: 10.9781/ijimai.2017.445.
Shen, L., Xie, B. and Shen, R. (2014) ‘Enhancing user
experience in mobile learning by affective interaction’,
Proceedings - 2014 International Conference on
Intelligent Environments, IE 2014, pp. 297–301. doi:
10.1109/IE.2014.63.
Squline.com (2017) Indonesia Masuk Top 10 Pertumbuhan
E-Learning Di Seluruh Dunia, Squline Targetkan
Kenaikan 25% Dari Angka Pertumbuhan Bisnis.
Available at: https://squline.com/indonesia-masuk-top-
10-pertumbuhan-e-learning-di-seluruh-dunia-squline-
targetkan-kenaikan-25-dari-angka-pertumbuhan-
bisnis/ (Accessed: 3 October 2019).
CONRIST 2019 - International Conferences on Information System and Technology
24
