
C4.5 Implementation to Predict the Rate of Resignation
of Students in the University
Darsono Nababan
1
, Parasian D. P. Silitonga
2
, Magdalena Simanjuntak
3
, Rusmin Saragih
4
,
Yoseph P. K. Kelen
5
1
Department of Information and Technology, Timor University, Kefamenanu, Indonesia
2
Faculty of Computer Science, Santo Thomas Catholic University, Medan 20132, Indonesia
3
Department of Computer Science, STMIK Kaputama Binjai 20714, Indonesia
4
Department of Information System, STMIK Kaputama Binjai 20714,Indonesia
5
Department of Information and Technology, Timor University, Kefamenanu, Indonesia
4
evitha12014@gmail.com,
5
yosepkelen@unimor.ac.id
Keywords: Data Mining, Classification, Decision Tree, C4.5, Achievement Index Rating
Abstract : Classification is a process in data mining that is used to find models or functions that explain or differentiate
concepts or data classes. Classification of data is used to estimate a class of an object whose label is unknown.
One of the classification models is in the form of a decision tree and decision rules. The main function of
decision tree implementation is a decision tree's ability to break down the complex decision process into a
simpler one. This study uses the C4.5 method which is used to form a decision tree carried out on the data of
students at the University. Based on the decision tree that is produced, the causes that affect the resignation
of college students can be found. The attributes that are used in the decision tree in this research are student
Achievement Index Rating, parents' income and student attendance rate at lectures. Based on the results of
the research conducted, it was concluded that the parents' small income factors and small Achievement Index
Rating became the dominant factors that caused students to resign.
1 INTRODUCTION
Classification is a process in data mining that is used
to find models or functions that explain or
differentiate concepts or data classes (Saputra, Rizal.,
2014). Classification of data is used to estimate the
class of an object whose label is unknown (Sharma,
Jitendra, Sanjeev, 2013). One of the classification
models is in the form of decision tree and decision
rules.
C4.5 algorithm is the algorithm used to form a
decision tree that can be used to predict a decision by
implementing a series of decision rules (Larose,
Daniel T., 2005). A decision tree is a flow chart where
each internal node denotes the attribute being tested,
each branch presents certain classes or classes
distribution.
The main function of the application of the
decision tree is a decision tree's ability to break down
complex decision-making processes into more simple
one (Sharma & Asst., Prof. Rupali, Bhartiya, 2012).
Through the decision tree, the decision-maker will
better interpret the solution to the problem (Dai, W.,
Ji, W., 2014). Besides this, decision tree are useful for
exploring data, finding hidden relationships between
several input variables with output variables. The
decision tree combines data exploration and
modeling.
The problem of student resignation is a problem
that occurs at every college. The resignation of
students can occur due to several things, including
Nababan, D., Silitonga, P., Simanjuntak, M., Saragih, R. and Kelen, Y.
C4.5 Implementation to Predict the Rate of Resignation of Students in the University.
DOI: 10.5220/0009319600050011
In Proceedings of the International Conferences on Information System and Technology (CONRIST 2019), pages 5-11
ISBN: 978-989-758-453-4
Copyright
c
2020 by SCITEPRESS – Science and Technology Publications, Lda. All rights reserved
5

parent's job transfer, job factors, inability to continue
their education, tuition fees, and many other factors.
The factors that resulted in the student's
resignation were varied and several cases did not
explain the reason for the resignation. But in general
cases of student resignation are caused by factors
such as poor student Achievement Index Rating,
attendance rates and income of parents that affect the
tuition fee.
Based on this, a study was conducted to find
factors that influenced the level of the resignation of
students at the University by using the C4.5
algorithm. The results of this study were expected to
help the college to anticipate the level of student
resignation so that it did not become too high.
2 DATA MINING
Data mining is a term that is often said to be a way
to describe and to search for knowledge discovery in
a database. One of the difficulties to define data
mining is the fact that data mining inherits many
aspects and techniques from various established
fields of science.
Data mining is a process that uses statistical
techniques, mathematics, artificial intelligence and
machine learning to extract and identify useful
information and related knowledge from various
large databases (Silitonga, Parasian, Irene Sri
Morina., 2018). According to Partner Group, Data
Mining is a process of finding meaningful
relationships, patterns, and tendencies by examining
in a large collection of data stored in storage using
pattern recognition techniques such as statistical and
mathematical techniques (Larose, 2005).
One of the data mining techniques is
classification. Classification is the process of finding
a model or function that explains or distinguishes a
concept or class of data, to be able to estimate the
class of an object which label is unknown. The model
itself can be an if-then rule, decision tree,
mathematical formula or neural network.
2.1 Classification
Classification is a process in data mining that is
used to find models or functions that explain or
differentiate concepts or data classes (Saputra, Rizal.,
2014). Classification of data is used to estimate a
class of an object whose label is unknown (Sharma,
Jitendra, Sanjeev, 2013).
Data mining classification is done by placing
objects into one of several predetermined categories.
Classification is used widely to predict classes on a
particular label. That is by classifying data (building
models) based on training sets and values (class
labels) in classifying certain attributes and using them
in classifying new data (Breiman, et al., 1984). The
stages of classification in data mining consist of (Lior
Rokach & Oded Maimon., 2005):
1. Building a model, in this stage, a model is
created to solve the problem of class
classification or attributes in the data, this model
is built based on a training set - an example of
data from a problem encountered, this training
set already has complete information both
attributes and classes.
2. Implementation of the model, at this stage the
model that has been built previously is used to
determine the attribute/class of new data whose
attributes/class is not known before.
3. Evaluation, at this stage the results of the
application of the model in the previous stage
are evaluated using measured parameters to
determine whether the model is acceptable.
2.2 Decision Tree
Decision tree and decision rules are data mining
methodologies that applied widely as a solution to
classify problems (Arcega, et al., 2013). Data mining
is a term that is often said to be a way to describe and
find discoveries in the form of knowledge in a
database (Silitonga, Parasian.2017).
The main function of the application of the
decision tree is a decision tree's ability to break down
the complex decision making processes more simple
(Sarma, Sunil, 2013). Through the decision tree,
decision-makers will interpret the solution to the
problem more (Dai, W., Ji, W., 2014). Besides this,
decision tree are useful for exploring data, finding
hidden relationships between several input variables
with output variables. The decision tree combine data
exploration and model.
Decision tree representations are considered as
a logical method which often used in the discussion
of applied statistics and learning machine (Ling.,
Charles X., et. Al., 200 4). Decision tree making uses
a supervised learning method is a learning process
where new data is classified based on existing
training samples.
Decision tree consist of nodes that are attributes
of the sample data. Branches come out of the node the
values or outcomes that are associated with the
attributes (nodes). While the leaves in the decision
tree show the class of the tested data sample.
CONRIST 2019 - International Conferences on Information System and Technology
6

Figure 1. Illustration of Decision Tree
In general, the steps in the C4.5 algorithm for building
decision tree are as follows (Adhatrao, et al., 2013):
1. Select an attribute as root.
2. Create a branch for each value.
3. Divide the case into the branches.
4. Repeat the process for each branch until all
cases in the branch have the same class.
To select an attribute as root, select the one with
the highest Gain value from all the attributes that
present. To calculate the value of a Gain attribute is
used following equation 1 ().
Gain
S,A
=Entropy
S
-
∑
|S
i
|
|S|
*Entropy S
i
n
i=1
(1)
Where:
S = Case Set
A = Attribute
n = Attribute partition A
|S
i
| = Number of cases on the i partition
|S| = Number of cases in S
While the calculation of Entropy values is carried out
by Equation 2.
Entropy
S
= - pi* log
2
pi
n
i=1
(2)
Where:
S = Case Set
n = Total Partition of S
pi = Proportion of S
i
to S
2.4 Achievement Index Rating
Achievement Index Rating is an average credit
value which is the final value unit that describes the
value of the teaching and learning process every
semester or can also be interpreted as a quantity or
number that states the achievement of success in the
teaching and learning process of students in one
semester (H, Burhanuddin Salam., 2003 ).
The Achievement Index Rating is divided into
Semester Achievement Index Rating and Cumulative
Achievement Index Rating (Nasir et al., 2011).
Semester Achievement Index Rating is an index of
achievement that is calculated based on subjects
covered during a certain semester. While
Achievement Index Rating is a student achievement
index based on all courses taken. Calculation of
Achievement Index is carried out by Equation 3.
AIR=
∑
SKS*N
∑
SKS
(3)
Where :
AIR = Achievement Index Rating
SKS = Semester Credit System Weight
N = Course weight
3 IMPLEMENTATION
The purpose of this study was to determine the
classification factors that resulted in students who
resigned from college. The variable that becomes the
decision criterion consists of the Cumulative
Achievement Index, Attendance Level in Lecture and
Parental Income. Whereas variables become the
destination parameter is the Decision Variable.
Research conducted on students of the College in the
year 2014 and 2015 as many as 180 students with a
table structure as in Table 1.
Table 1. Table Structure Problem
N
o. Variable Information
1. SID Student ID
N
umbe
r
2.
N
ame Student Name
3. AIR Achievement Index
Ratin
g
4. Attendance Attendance Rate
5. Income The income of Parents
Ever
y
Month
6. Decision The decision to stay.
(Yes or No)
The first step was taken after the data collection
process was a pre-batch-process, grouped the data
into classes (K) by using Equation 4 (Drs. Riduwan,
MBA, 2003).
C4.5 Implementation to Predict the Rate of Resignation of Students in the University
7

Number of Classes (K) = 1 + 3.3 log n. (4)
Where: n = amount of data
So:
K = 1 + 3.3 log(180)
K = 1 + 3.3 * 2.25527
K = 8.443239
Based on the class grouping process, there are 8
classes (K).
Achievement Index Rating
The Student’s Achievement Index Rating is grouped
according to table 2.
Table 2. Classification of Cumulative Achievement
Index Rating
Achievement Index
Rating (AIR)
Category
0.00 <= AIR <=0.50 1
0.50 < AIR <= 1.00 2
1.00 < AIR <= 1.50 3
1.50 < AIR <= 2.00 4
2.00 < AIR <= 2.50 5
2.50 < AIR <= 3.00 6
3.00 < AIR <= 3.50 7
AIR >3.50 8
1. Income (Parents Monthly Income)
The grouping of income variables for each month is
presented as in table 3.
Table 3. Classification of Parent’s Income
Parents Monthly
Income (Rupiah) Category
500.000 <= Income <= 1.500.000 1
1.500.000 < Income <= 3.000.000 2
3.000.000 < Income <= 4.000.000 3
4.000.000 < Income <= 5.000.000 4
5.000.000 < Income <= 6.500.000 5
6.600.000 < Income <= 7.500.000 6
7.000.000 < Income <= 8.500.000 7
Income > 8.500.000 8
1. Students’ Attendance Level
The students’ attendance level is categorized is
presented in Table 4.
Table 4. Student Attendance Level Classification
Student Attendance
Percentage (%)
Category
0 <= Attendance <= 12.5 1
12.5 < Attendance <= 25 2
25 < Attendance <= 37.5 3
37.5 < Attendance <= 50 4
50 < Attendance <= 62.5 5
62.5 < Attendance <= 75 6
75 < Attendance <= 87.5 7
Attendance > 87.5 8
2. Decision
Decision Variable is the objective parameter in the
case of student resignation. Decision Variable
categorized on Yes and No.
Decision Tree To Predict Students Who Resign
1. Decision Tree Root Attribute (Node Level 0)
Determination of the root attribute in the decision tree
is based on the highest Gain value of each attribute.
The calculation of the Gain value of the attribute is
done after the total entropy value of the case is
obtained and the entropy of each attribute
corresponds to Equation 2.
Entropy (Case)
= -
141
180
*log
2
141
180
+
-
39
180
*log
2
39
180
= 0.754034056
Entropy AIR
Entropy (1)
=
∗ log
∗ log
= 0
Entropy (2)
= -
0
5
*log
2
0
5
+
-
5
5
*log
2
5
5
= 0
This is done so on each partition on each variable.
After obtaining the entropy value of each attribute,
CONRIST 2019 - International Conferences on Information System and Technology
8
Node
Category
Total
Case
(S)
D
e
c
i
s
i
o
n
To
Stay
Entropy Gain
Y
e
s
(S
1
)
No
(S
2
)
1 Case 180 141 39 0.754034056
AIR 0.473613716
1 9 0 9 0
2 5 0 5 0
3 10 3 7 0.881290899
4 38 24 14 0.949452015
5 63 59 4 0.088628184
6 28 28 0 0
7 18 18 0 0
8 9 9 0 0
Attendance
1 0 0 0 0 0.378020383
2 0 0 0 0
3 0 0 0 0
4 24 2 22 0.41381685
5 13 5 8 0.961236605
6 36 31 5 0.581321499
7 70 68 2 0.187176257
8 37 35 2 0.303374836
Income
1 9 0 9 0 0.289148361
2 21 7 14 0.918295834
3 26 18 8 0.89049164
4 34 30 4 0.522559375
5 29 28 1 0.216396932
6 22 21 1 0.266764988
7 23 22 1 0.258018669
8 16 15 1 0.337290067
Node
Categor
y
Jumlah Kasus
(S)
Decision To Stay
Entropy Gain
Yes
(S
1
)
No
(S
2
)
1.
2 AIR (4) 38 24 14
0
.9
4
9
4
52
0
1
5
Attendance
0
.55
0
4
715
0
3
4 7 0 7 0
5 3 0 3 0
6 5 5 0 0
7 14 12 2
0.59167277
9
8 9 7 2
0
.76
4
2
0
4
5
0
7
Income
1 4 0 4 0
0.39828209
8
2 13 7 6
0
.995727
4
5
2
3 8 4 4 1
4 4 4 0 0
5 5 5 0 0
6 1 1 0 0
7 3 3 0 0
next is determining the Gain attribute value by
equation 3.
Gain (Case, AIR) =
Entropy(S) -
∑
||
||
* Entropy (𝐼𝑃𝐾
).
= 0.754034056 –
∗0
∗
0.99107606
∗1
⋯
= 0.473613716
Thus, it is done to obtain the Gain value of each
attribute. The results of the calculation of Gain and
Entropy for each attribute in the prediction process of
student resignation are presented in Table 5.
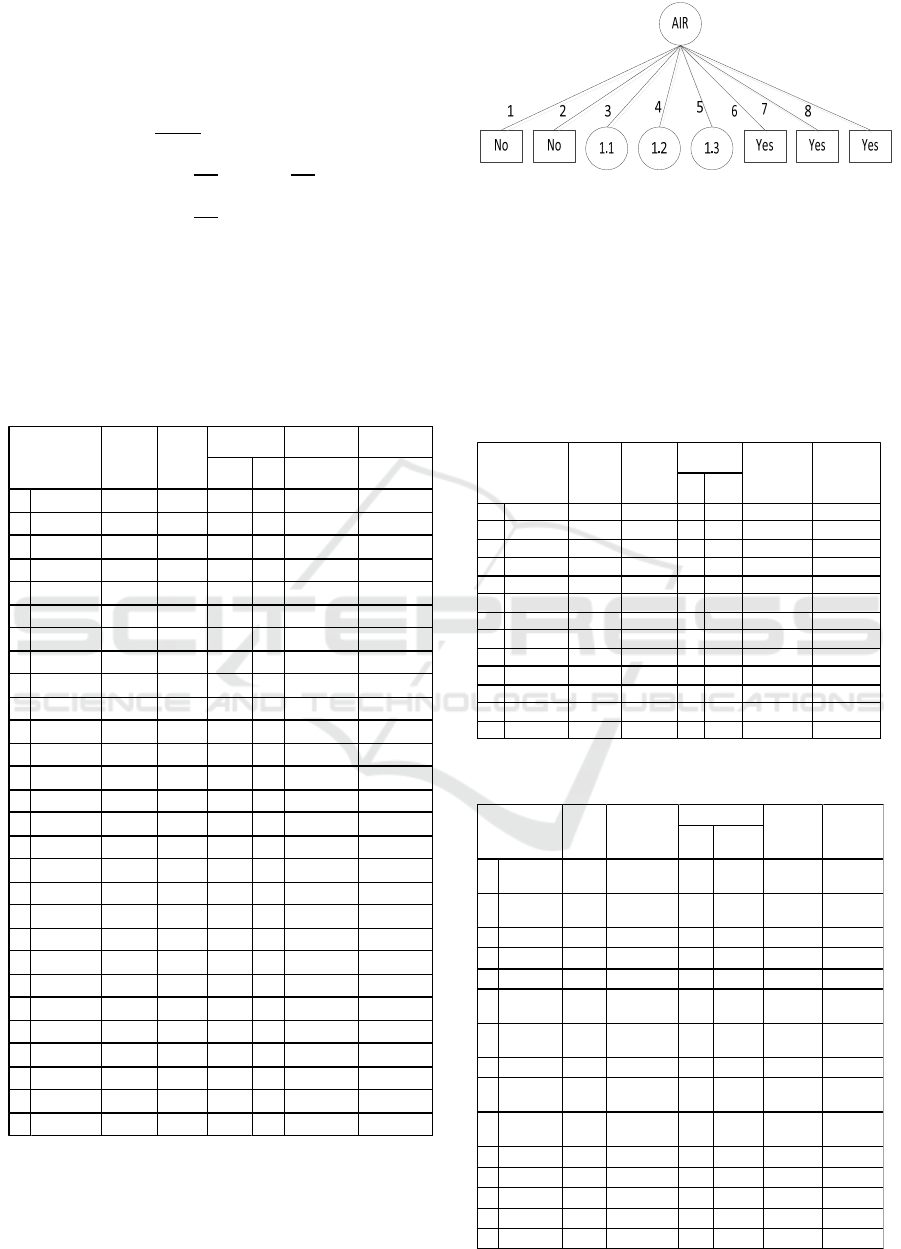
Table 5. Calculation of Node 1.
Based on the results in Table 5 shows that the School
Attendance Highest Gain value, thus Attendance me
njadi roots in a decision tree. The Node 1 decision tree
is presented in Figure 1.
Figure 2: Node Decision Tree of Node Level 0.
1. Node Level 1 Decision Tree Attributes
Next, determine the node in Node 1.1 and Node 1.2
of the remaining attributes, namely the Achievement
Index and the Parent's Earnings every Month.
Calculation results of Gain and Entropy Node 1.1,
Node 1.2 and Node 1.3 are presented as in Table 6
Table 7 and Table 8.
Table 6. Calculation of Node 1.1
Table 7. Calculation of Node 1.2
Node Catogory
Total Case
(S)
D
e
c
i
s
io
n
To
Stay
Entropy Gain
Yes
(S
1
)
No
(S
2
)
1.1 AIR (3) 10 3 7 0.881290899
Attendance
4 5 0 5 0 0.605802149
5 1 0 1 0
6 3 2 1 0.918295834
7 1 1 0 0
Income
1 2 0 2 0 0.681290899
2 3 0 3 0
3 1 1 0 0
4 1 1 0 0
5 2 1 1 1
7 1 0 1 0
C4.5 Implementation to Predict the Rate of Resignation of Students in the University
9
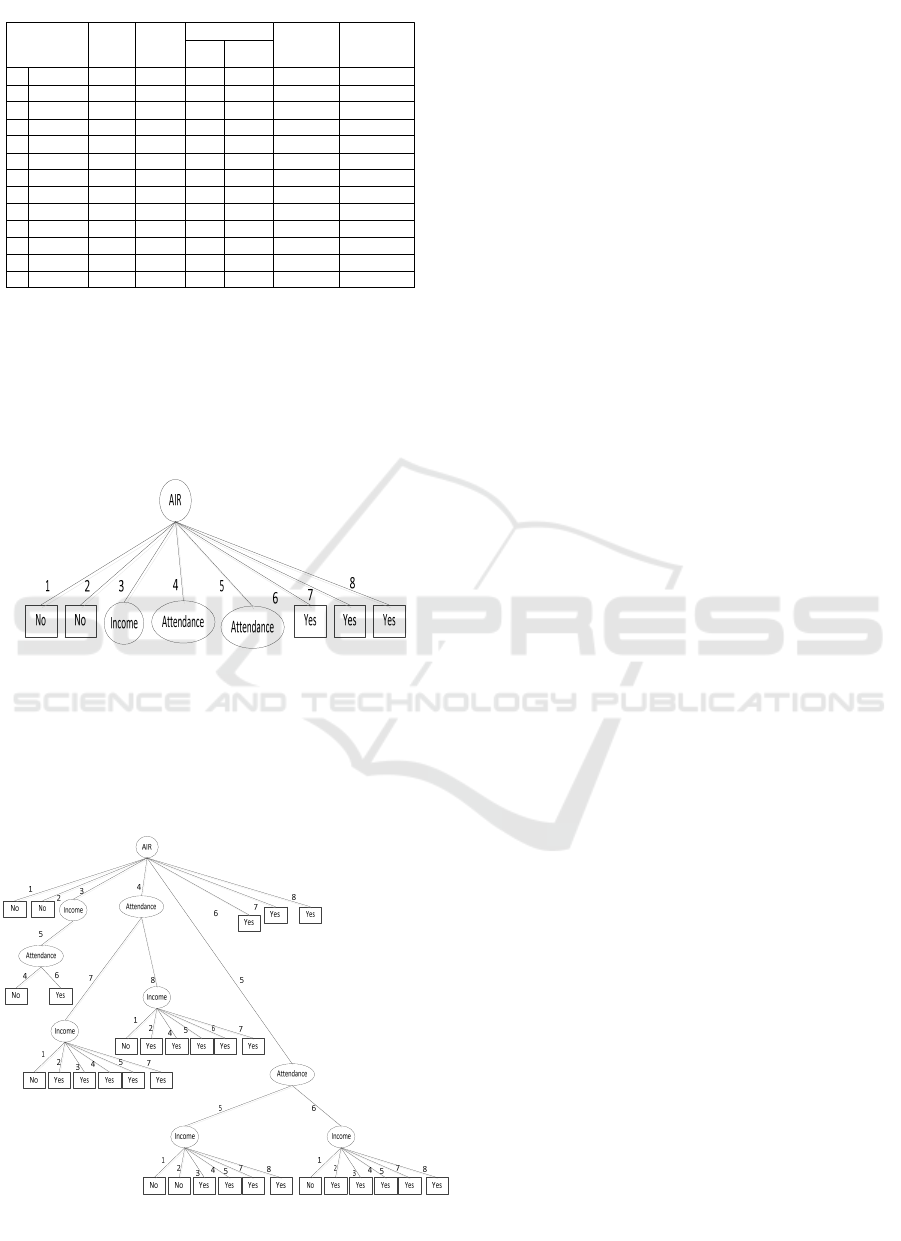
Table 8. Calculation of Node 1.3
The results of calculations in Table 6 show that
parents' income gets the highest Gain value. Whereas
the calculations in Tables 7 and 8 show that the
student attendance level has the highest Gain score.
Based on the results in Table 6, Table 7 and Table 8
obtained the Level 1 decision tree as in Figure 2.
Figure 3: Decision Tree of Node Level 1
Next is completing to calculate level 2 Nodes. The
results of calculating Gain and Entropy Node level 2
are presented in the form of a decision tree as shown
in Figure 3.
Figure 4: Decision Tree of Node Level 2
4 CONCLUSION
1. Based on the results of data collection, it was
found that as many as 21% of 2014 and 2015 class
year students who resigned from the College.
2. Achievement index rating, students’ attendance
level and small parents’ income greatly influence
the level of the resignation of students from the
College.
3. Based on the decision tree produced, that the
students who resigned from the College is the
students who have achievement index between
1.00 and 2.50.
ACKNOWLEDGMENT
This research has limitations, especially in
determining the variables and methods used. The
author is open to all suggestions and critics and hopes
that this research can be used for other researches.
REFERENCES
Adhatrao, Kalpesh, Aditya, Gaykar, Amiraj,
Dhawan, Rohit, Jha & Vipul Honrao. (2013).
Predicting Students’ Performance Using Id3 And
C4.5 Classification Algorithms. International
Journal of Data Mining & Knowledge
Management Process (IJDKP), Vol.3, No.5,
September, DOI: 10.5121/ijdkp.2013.3504.
Arcega, Anilu Franco, Jesús Ariel Carrasco Ochoa ,
Guillermo Sánchez Díaz & José Francisco
Martínez Trinidad. (2013). Decision Tree based
Classifiers for Large Datasets. Computación y
Sistemas, Vol. 17 No.1, 2013 pp. 95-102, 1405-
5546.
Breiman, L., Friedman, J., H., Olshen, R., A. & Stone,
C., J. (1984). Classification and Regression Tree.
Chapman & Hall, New York.
Dai, W., & Ji, W. (2014). A Map-Reduce
Implementation of C4. 5 Decision Tree
Algorithm. International Journal of Database
Theory and Application, Vol.7, No.1, pp. 49-60.
DOI : 10.14257/ijdta.2014.7.1.05.
H., Burhanuddin Salam. (2003). Successful Learning
Methods in Higher Education. Rineka Cipta.
Jakarta.
H., Li & X., M., Hu. (2008). Analysis and
Comparison between ID3 Algorithm and C4. 5
Algorithm in Decision Tree. Water Resources and
Power, Vol. 26, No. 2, pp. 129-132.
Node Catogory
Jumlah
Kasus (S)
Decision To Stay
Entropy Gain
Yes
(S
1
)
No
(S
2
)
1.3 AIR (5)
63 59 4 0.341153893
Attendance
0.120609708
5 3 2 1 0.918295834
6 16 13 3 0.69621226
7 30 30 0 0
8 14 14 0 0
Income
0.118813931
3 6 4 2 0.918295834
4 15 13 2 0.566509507
5 15 15 0 0
6 10 10 0 0
7 12 12 0 0
8 5 5 0 0
CONRIST 2019 - International Conferences on Information System and Technology
10

Larose, Daniel, T. (2005). Discovering Knowledge in
Data: An Introduction to Data Mining. A Jhon
Wiley & Sons, Inc Publication. Canada.
Lin, Charles, X., Qiang Yang, Jianning Wang
&Shichao Zhang. (2004). Decision Trees with
Minimal Costs. Appearing Proceedings of the
21st International Conference on Machine
Learning (ICML), Banff. Canada.
Lior, Rokach & Oded Maimon. (2005). Data Mining
With Decision Tree. World Scientific Publishing
Co. Pte. Ltd. Series in Machine Perception
Artificial Intelligence Volume 69.
Nasir, Anthony, Tariq Mahmood Ali, Sheikh
Shahdin, Tariq Ur Rahman. (2011). Technology
Achievement Index 2009: Ranking And
Comparative Study of Nations, Scientometrics,
87:41–62, DOI: 10.1007/s11192-010-0285-6.
Riduwan. (2003). Research Variables Measurement
Scale. CV. Alvabeta. Bandung.
Saputra, Rizal Amegia. (2014). Comparison of
Classification Data Algorithm for Predicting
Tuber Culosis (TBC): Case Study of Karawang
Health Center. National Seminar on Innovation
and Trends (SNIT).
Sharma, Himani & Sunil, Kumar. (2013). A Survey
on Decision Tree Algorithms of Classification in
Data Mining. International Journal of Science
and Research (IJSR), Index Copernicus Value:
6.14, 2319-7064.
Sharma, Seema, Jitendra, Agrawal & Sanjeev,
Sharma. (2013). Classification Through Machine
Learning Technique: C4.5 Algorithm based on
Various Entropies. International Journal of
Computer Applications, Volume 82, No. 16, 0975
– 8887.
Sharma, Pooja & Asst., Prof. Rupali, Bhartiya.
(2012). Implementation of Decision Tree
Algorithm to Analysis of the Performance.
International Journal of Advanced Research in
Computer and Communication Engineering, Vol.
1, Issue 10, December 2012, 2319-5940.
Silitonga, Parasian. (2017). Clustering of Patient
Disease Data by Using K-Means Clustering,
International Journal of Computer Science and
Information Security (IJCSIS), Vol. 15, No. 7,
July 2017, 1947-5500.
Silitonga, Parasian & Irene, Sri, Morina, (2018).
International Journal of Computer Science
Engineering (IJCSE), Vol. 7 No.1 Jan-Feb 2018,
2319-7323.
C4.5 Implementation to Predict the Rate of Resignation of Students in the University
11
