
User Experience Evaluation on University's Learning Management
System (LMS)
Emil R. Kaburuan
1
, Ang Swat Lin Lindawati
2
,
Nikolaus Permana Tri Rahmanto
1
1
Information Systems Management Department, BINUS Graduate Program –
M
aster of Information Systems Management,
Bina Nusantara University, Jakarta, Indonesia
2
Accounting Department, Faculty of Economics & Communication, Bina Nusantara University, Jakarta, Indonesia
Keywords: User experience, LMS, evaluation
Abstract: Learning Management System have become a crucial system in learning environment nowadays. The User
Experience of LMS has always become a discussion topic to be reviewed. This research goals is to see how
hedonic quality and also pragmatic quality affect the attractiveness of LMS. The LMS that we used is
BINUSMAYA and we collect valid data from 248 undergraduate college student in BINUS University. The
result shows that, hedonic and pragmatic have impacts to attractiveness and some practical result for
BINUSMAYA evaluation.
1 INTRODUCTION
Rapid technological developments have
penetrated the world of education in the past decade.
The transfer of learning has begun to change from
traditional learning methods to learning ways with an
internet-connected environment. Causing new
challenges to create an active and interactive
environment. E-Learning is one of the topics that
emerged in this decade, e-learning involves digital
tools for teaching and learning activities, e-learning
uses all existing technologies to enable learning
activities wherever and whenever.(Abaidoo and
Arkorful, 2015).
The Learning Management System is increasingly
developing and has become the main tool for
delivering e-learning material. Increasing existing
materials, and existing needs increase the complexity
of LMS platforms that require more knowledge, time,
and effort.
BINUS University is one of the tertiary
institutions with 30,000 active students. BINUS
University has five campuses in Jakarta and one
campus in the Alam Sutra, Tangerang and one
campus in the Bekasi area. Since 2001, BINUS
University has implemented LMS in helping deliver
learning content and information services to students
and lecturers. Even BINUS University has
implemented a mobile version of LMS for students
and lecturers. In its development, the LMS that has
been implemented has undergone four changes
(BINUSMAYA 1.0, BINUSMAYA 2.0,
BINUSMAYA 3.0 and BINUSMAYA 5.0). Seeing
the development of BINUSMAYA and the increasing
features provided, it is necessary to see the usefulness
of these features especially for S1 student users.
This research was conducted to find out whether
users (in this case students) have sufficient User
Experience at BINUSMAYA from existing factors.
The final results of this study can be used as
suggestions for evaluating BINUSMAYA, what are
the aspects that must be improved.
2 LITERATURE REVIEW
2.1 Learning Management System
A Learning Management System is a web or
cloud-based software program that helps in the
teaching and learning process and assists in delivering
effective teaching, training and program
development. The Learning Management System
facilitates instructors, students and administrators to
use and access services and are outside the time limit
and place in the teaching and learning process
(Takahashi et al., 2014). The technical term for LMS
is application software for administration,
176
Kaburuan, E., Lindawati, A. and Rahmanto, N.
User Experience Evaluation on University’s Learning Management System (LMS).
DOI: 10.5220/0009318601760184
In Proceedings of the 1st International Conference on Intermedia Arts and Creative Technology (CREATIVEARTS 2019), pages 176-184
ISBN: 978-989-758-430-5
Copyright
c
2020 by SCITEPRESS – Science and Technology Publications, Lda. All rights reserved

documentation, tracking, reporting, and delivery by
educational courses or e-learning training programs
(Ellis, 2009).
The Learning Management System has two
specifications that affect users: 1) The usefulness of
LMS lies in the needs determined by individuals or
organizations. This means that LMS can be useful and
very effective for academic purposes, but that does
not mean that LMS will be suitable for industry too
2) LMS assistants who are well-treated technically for
ongoing support (Abaidoo and Arkorful, 2015).
In higher education, LMS has a range of tasks
than usual. A consistent finding is that LMS is used
most often for the distribution of learning materials,
more rarely for communication between instructors
and students, and even more rarely for online
assessment or collaborative learning (Woods, Baker
and Hopper, 2004; Blin and Munro, 2008;
Mahdizadeh, Biemans and Mulder, 2008; Larsen,
Sørebø and Sørebø, 2009; Brown, 2014; Garrote and
Pettersson, 2016).
Based on the research conducted by Broadbent
(Broadbent and Poon, 2015), it was found 10 self-
regulated learning strategies in online learning
systems. Of the 130 papers that passed the filter for
review and then filtered again into 12 papers, 10
online self-learning strategies were found, namely;
Self-regulated learning strategies combined,
Metacognition, Time management, Effort regulation,
Peer Learning, Elaboration, Rehearsal, organization,
critical thinking, help seeking.
2.2 User Experience
According to the definition given by ISO in
2008, User Experience (UX) is defined as a person's
perception and response that results from anticipated
use and use of a product, system or service.
According to research conducted by Law in 2009, the
definition of UX is focused on the consequences of
use which directly impacts user experience.
Hassenzahl, assesses that there are two
dimensions when a user interacts with a product.
Pragmatic Quality refers to the product's ability to
support the achievement of "do-goals" (goals that
must be done)(Hassenzahl, 2010). Pragmatic quality
focus on the product, the benefits and uses of the
product with its relation to tasks. Hedonic Quality
refers to the ability of the product to support the
achievement of "be-goals". Hedonic tends to focus on
oneself, such as why a person owns and uses a
particular product.
Experience is a subjective matter, it arises from a
situation, object, person, the interrelationship
between all things, and relations with the experience
/ user, but all these things are made and remain in the
mind of the user. So that a product cannot only be
assessed objectively (for example Usability Testing),
that quality must also be experienced to have an
impact
Experience is also a comprehensive thing, not an
intermediary in an HCI (Human Computer
Interaction), an action always has a goal mediated by
interactive products (technology). But often do not
see the goal as a whole, there is a hierarchy of three
levels regarding goals (goals) which are divided into
be-goals, do-goals, motor-goals. In paying attention
to the experience of a user the three things must also
be noticed.
Experience is also situated that is located in
certain circumstances, where this happens uniquely
and may not be repeated exactly. But that does not
mean experience cannot be categorized. Experience
is also dynamic, it is continuous, starting from seeing,
taking action, thinking, and feeling. Likewise also in
interacting with a product, in every interaction there
are experiences that occur and vary.
Lastly, Experience is positive, positive here does
not mean endless pleasure, or a superficial
entertainment. A more appropriate word to describe
is "useful" or "valuable". Pleasant experiences fall
into the beneficial category because they meet the
psychological needs of users. Bad or unpleasant
experiences can also be in a useful category, when
you can direct to a higher or more valuable end.
2.3 Be Goals & Hedonic Quality
In the hierarchy of goals that are the highest level
are be-goals. Be-goals have a nature where this comes
out from within the user, very close to users, which
when compared to motor goals is very different,
because motor goals are closer to the world, namely
things like interaction with products. Be-goals are
those that motivate an action, and give action is a
meaning. Examples of be-goals are "being
competent", "admired", "being close to others",
"being autonomous", "being stimulated".
The ability of a product to support the
achievement of "be-goals" is important, because these
be-goals are the drivers of experience. Lack of
usability (usability) causes a barrier to achieving be-
goals such as being autonomous, competent,
connected with others, stimulated, and popular
through the use of technology.
Hedonic quality that looks will be a potential
indicator of achieving be-goals through interaction
with the product. The experience that is felt by the
User Experience Evaluation on University’s Learning Management System (LMS)
177

user occurs / is made through the fulfilment of the be-
goals.
Hedonic quality can be said to be a "motivator"
that captures the visible ability of the product to make
a positive experience through meeting the needs of
users.
2.4 Do goals, Motor Goals, &
Pragmatic Quality
In the middle level we know the do-goals. Do-
goals are concrete results that users want to achieve,
such as "making phone calls" or "watching a film".
The existence of a do-goals is outside of a technology,
but not entirely independent. For example "making
phone calls" can be achieved through various types of
telephone, communication software, and many
others. This activity will not be born without a
technology, so the do-goals themselves are born of
technology.
At the lowest level in the goals hierarchy are
motor goals. Motor goals are ways to achieve a do-
goals. For example "making a phone call" has several
sub-goals before reaching that goal, such as pressing
a button, reading the words in the screen.
Traditionally, the design of an interaction is
understood as designing a structure under the do-
goals, which is to regulate everything that includes
the sub-goals in achieving the do-goals.
The ability of a product to achieve "do-goals"
supports the fulfilment of the goals requirements.
Pragmatic quality focuses on how a product
successfully performs tasks according to their needs,
when compared to hedonic quality with hedonic
quality which directly influences the achievement of
be-goals, pragmatic quality affects indirectly by
influencing do-goals. So that it can be concluded that
pragmatic quality helps to achieve be-goals easier.
Pragmatic quality can be said as a "hygiene
factor" that enables the fulfilment of user needs
through boundaries but is not a positive source of
experience itself.
2.5 Relations between Hedonic and
Pragmatic Quality
The model made by Hassenzahl argues that needs
(be-goals, motives) are the source of experience and
the driver of product use. It takes fulfilment, where a
"meaning" is created when interacting with the
product. However, to achieve fulfilment of needs, the
product must also be able to be a helper, who is able
to make or shape the desired experience. In
Hassenzahl's model, all levels of the hierarchy must
be aligned and shaped by and return to the
superordinate level.
Fun, usability, and functionality are entities.
Usability and functionality are conditions that must
be achieved before achieving pleasure, but usability
and functionality without pleasure are meaningless.
Fun, usability, and functionality are three
different things, but they must be aligned in order to
create a positive experience. So that it can be
concluded that a product cannot provide functions
without a meaning, and also cannot give meaning
without a function.
2.6 Attractiveness
Attractiveness is the overall impression by the
user, whether they like the product, annoying / can be
enjoyed, good / bad, pleasant / unpleasant, interesting
/ not attractive, friendly / unfriendly.
2.7 User Experience Questionnaire
(UEQ)
User Experience Questionnaire (UEQ) is a
collection of questions to test hedonic and pragmatic
quality of a product, and see the relevance to
attractiveness of the product.
UEQ was created in 2005 with an analytical data
approach to ensure the practical relevance of the scale
that has been built which relates to differentiating
aspects of quality. The item in this questionnaire is a
reduction of 80 raw questions and then after the
validity and reliability tests are broken into 6 scales
with 26 questions.
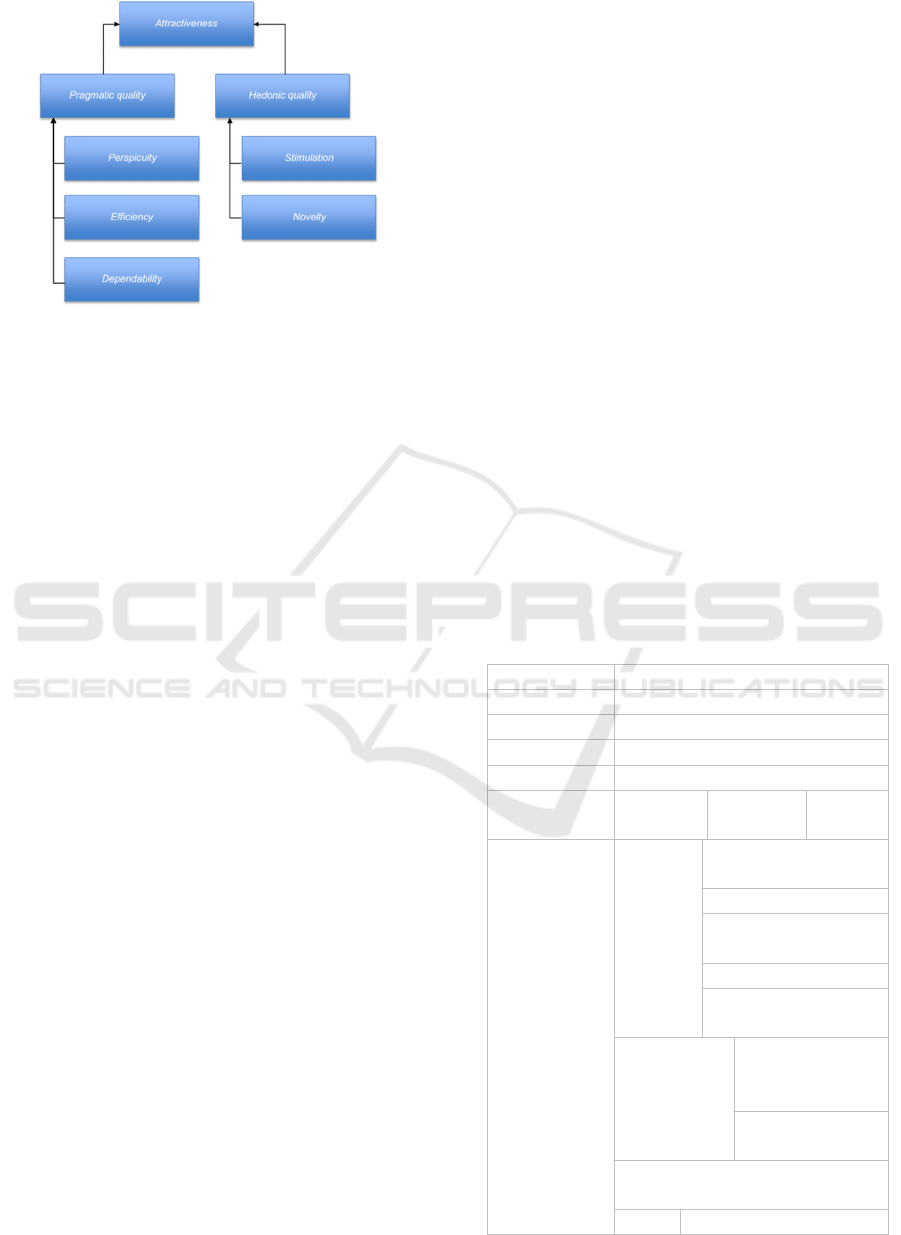
The questionnaire divides the research component
into 6, namely:
• Attractiveness (rate of attractiveness)
• Perspicuity (Level of clarity)
• Efficiency (level of efficiency)
• Dependability (Ability to be relied upon)
• Stimulation (level of stimulation)
• Novelty (Level of Novelty / Innovation)
Attractiveness is a pure valence dimension.
Perspicuity, efficiency, and dependability enter into
the aspect of pragmatic quality while stimulation and
novelty enter into the hedonic quality aspect. Figure
1 will show the structure of this questionnaire.
CREATIVEARTS 2019 - 1st International Conference on Intermedia Arts and Creative
178
.
2.8 Previous Research on User
Experience in LMS
In 2014 Zaharias et al conducted research on the
quality of LMS viewed from a User Experience
perspective. In this paper it was found that 50% of the
respondents to the previous survey changed their
LMS platform due to user experience issues (Zaharias
and Pappas, 2016). While most of the existing
literature focuses on the capabilities of LMS in terms
of administration and management of the learning and
teaching process. From this study a conceptual
framework and LMS evaluation model were created
from the user experience perspective. They conducted
an online survey of 466 professional teachers and
from the results of their survey made a user-oriented
evaluation with four dimensions. That is; pragmatic
quality, authentic learning, motivation and
engagement. But this model has not been tested
enough for its validity and reliability, so when
compared with the model that User Experience
Questionnare provides, it is still rarely used. Because
the UEQ model has proven its validity and reliability.
In a research publication in 2014 which was still
in operation,(Santoso et al., 2014) conducted a study
of the Student Centered E-Learning Environment
(SCELE) which was implemented to complement the
traditional teaching method in 2005 at Fasilkom UI.
An evaluation of the effectiveness of the e-learning
system used by the instructor has been carried out.
However, user experience evaluations for students
have not been implemented. 113 students enrolled in
the Informatics Engineering program were asked to
evaluate SCELE. Data collection is done
quantitatively and qualitatively, where quantitative
data collection is carried out with UEQ. Whereas
qualitative data is carried out by conducting
interviews. From the research results, it was found
that the Pragmatic Quality of SCELE was good (more
than 0.800) and the hedonic quality of SCELE was in
a neutral position.
3 RESEARCH METHODOLOGY
3.1 BINUSMAYA
BINUSMAYA is an LMS applied by BINUS
University to support the study process at BINUS.
Where students can access existing learning
resources, and can also be a portal to receive and send
assignments, and are used to verify attendance when
classes take place.
Since 2001, BINUS University has implemented
LMS in helping to deliver learning content and
information services to students and lecturers. In its
development, the LMS that has been implemented
has undergone 4 times changes (BINUSMAYA 1.0,
BINUSMAYA 2.0, BINUSMAYA 3.0 and
BINUSMAYA 5.0). Seeing the development of
BINUSMAYA and the increasing features provided,
it is necessary to see the usefulness of these features
especially for S1 student users.
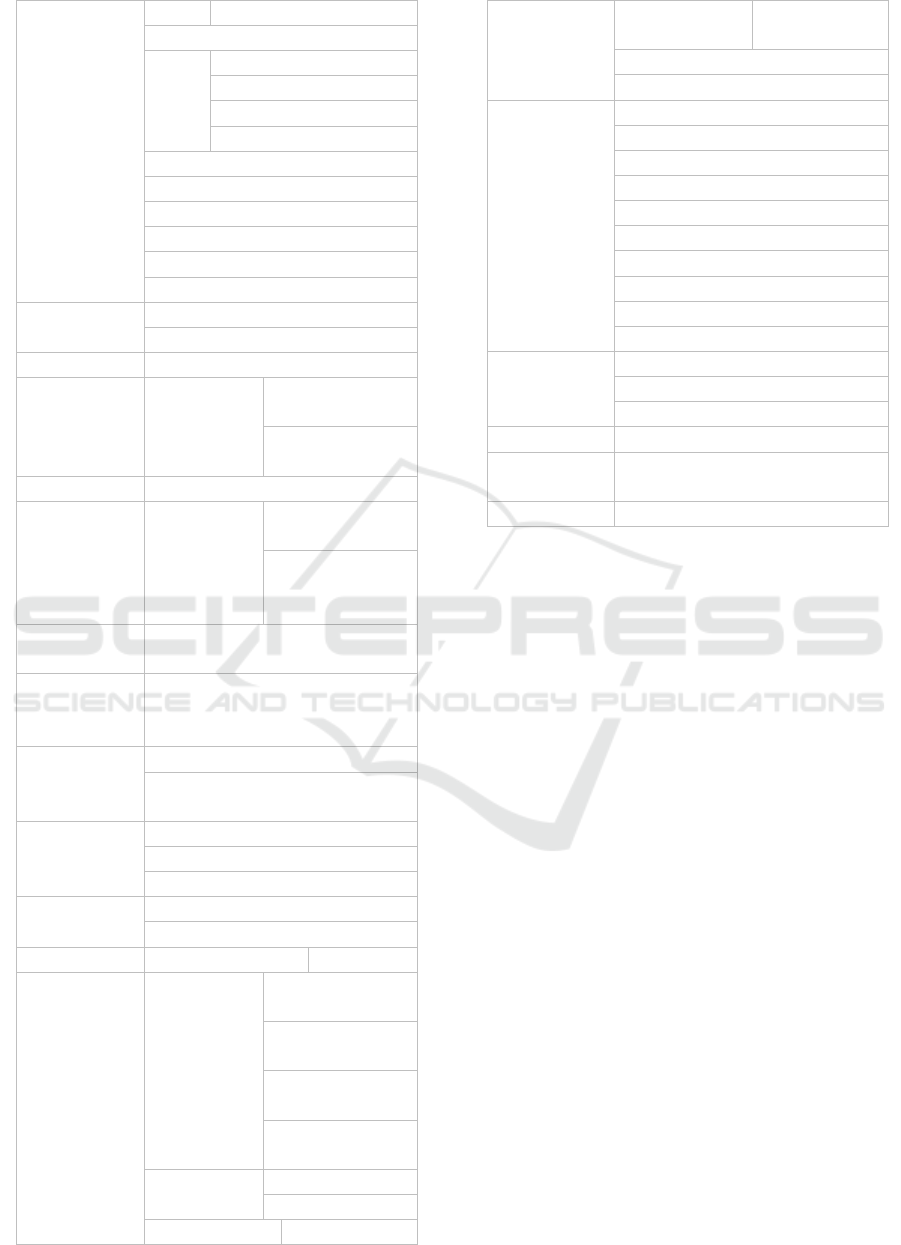
The modules in BINUSMAYA 5.0 are as follows:
Table 1 BINUSMAYA 5.0 Module
Modul Sub-Modul
News Stream -
Mail -
Message -
OneDrive -
Course Educati
on Level
Semester Course
Name
Learning Thesis Thesis Defence
Schedule
Download Center
Graduation Book
Photo Upload
Upload Thesis File
Graduation
Confirmation Form
Curriculum Prerequisites
for Internship
and Thesis
Course
Distribution
Internship/Seminar Exam
Schedule
Exa Exam Schedule
Figure 1 Questionnaire Structure
User Experience Evaluation on University’s Learning Management System (LMS)
179
m Print KMK
Class Schedule
Grad
es
View Score
View Grade
Score Protest
View Score Lab
Academic Calendar
English Score Test
Registration Calendar
Attendance Information
KRS Manager
Course Registration
Student
Service
Services Queue
Services Queue History
Forum -
Development
Program
Advisory Advisory
Activity
Schedule
Meeting
e-Certificate Certificate
Enrichment
Program
Registratio
n
Registration
Form
View
Registration
Form Result
Academic
Advisory
-
Student
Activity
Transcript
Total Point
Graduation Questionnaire
View Graduation Status and
Schedule
Feedback Send Feedback
View Feedback
FAQ
Financial Financial Summary
Payment Receipt
Event My Event History Event List
FEP Courses General
Orientation
Academic
Orientation
Campus Life
Orientation
English
Foundation
Exam Exam Schedule
Print KMK
BC Download
Coordinator and Upload
Interview
Class Schedule
Attendance Information
Registration Telegram Registration
Vital Source Registration
Blog Registration
Bee Presenter
Leave, Reactive & Resign
Self Service Campus Solution
Binus Access
Cashless Vaganza
MSDNAA
BC Registration
Support Download Center
Letter Request
Requesting History
Binus TV -
Binus
Square
-
Library -
3.2 Research Stage
First, the identification of problems that need to be
discussed in the research is carried out, as well as
formulating research problems according to the topics
taken. Then, learning that is related to the topic of
research is carried out by reading a journal about
related research that has been done before. After that
the research model and the variables needed in this
study will be determined. The research model is seen
from the studies that have been done before, and
variables taken from the research model. then the
questionnaire to test the hypothesis of the research
model was made, the questionnaire was seen from
previous studies. Then the questionnaire is distributed
to BINUS University Active S1 students, according
to their sample needs. After collecting answers from
respondents, and the number of respondents fulfilling
the required sample, it will be tested for validity and
reliability of each research variable. Data analysis
was carried out with the help of Microsoft Excel
provided by UEQ. Of all the information obtained
after processing the data a conclusion will be drawn
that is related to the initial hypothesis of the study.
3.3 Data Collection
Data collection was carried out by distributing
questionnaires through an online survey distributed to
CREATIVEARTS 2019 - 1st International Conference on Intermedia Arts and Creative
180
BINUS University S1 active students. The scale used
is a seven-point Likert scale, the reason for using this
scale is because the questionnaire used is User
Experience Questionnaire (UEQ) where the
assessment is determined from a value of minus three
to three which is helped by a seven-point Likert scale.
The questionnaire was used to assess the three
components of User Experience, namely hedonic
quality, pragmatic quality, and attractiveness.
Hedonic quality and pragmatic quality are
represented by several more detailed dimensions.
In determining the research sample, the Binus
population was taken with the assumption of 30,000
students, of which in the latest data in the 2017/2018
school year, BINUS University active students were
in the number 23,000 students rounded up.
This study uses stratified sampling because of the
plurality of respondents and has heterogeneous
demographics.
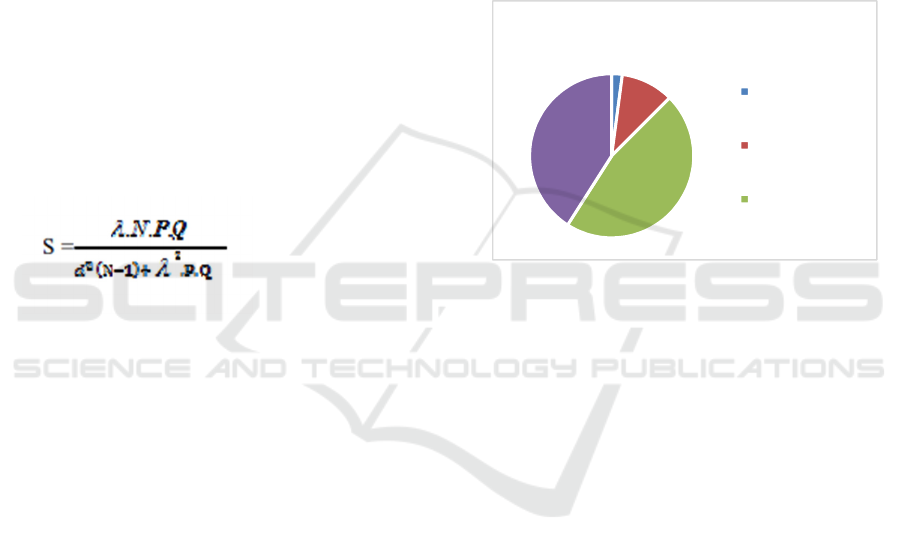
The formula to be used in calculating samples from
the population will be calculated by the sampling
formula Isaac and Michael:
S = Sample Size
λ2 = Chi Squared, with dk = 1, the problem level
is between 1%, 5%, or 10%
N = Total Population
P-Q = 0.5
d = 0.05
With the table determining the number of samples
from Isaac and Michael provides convenience in
determining the sample, where the level of error to be
used is 10% and population N is 30,000, a sample of
268 people is needed.
3.4 Data Analysis
Analysis of the data in this study was carried out
with the help of a statistical software tool namely
Microsoft Excel which has been modified to be a tool
to measure the results of UEQ answers. Validity and
Reliability Tests do not need to be done anymore
considering UEQ has been used several times as a
tool to evaluate an LMS.
4 RESULT
4.1 Demographics
In this study the number of answers to the
questionnaires to be analyzed and processed were 288
respondents.
The demographics of the respondents in this study
included binusian/class, department, and frequency
using BINUSMAYA. The following data collected
from respondents samples formed in the graph in
Figure 2.
Figure 2 Frequency of Use
Of the 288 respondents who filled out the
questionnaire, 6 people or 2% of respondents access
BINUSMAYA above once a month, 30 people or
10% of respondents access BINUSMAYA every
month, 118 people or 41% of respondents access
BINUSMAYA every week, 134 people or 47% of
respondents access BINUSMAYA every day. From
this data it can be concluded that the majority of
respondents are BINUSMAYA users who are quite
routine.
4.2 Result of Analysis
In this study, the measurement tool used was a
questionnaire developed from UEQ. UEQ was
created in 2005 with an analytical data approach to
ensure the practical relevance of the scale that has
been built which relates to differentiating aspects of
quality. The item in this questionnaire is a reduction
Total
Morethan
onceamonth
Everymonth
Everyday
User Experience Evaluation on University’s Learning Management System (LMS)
181
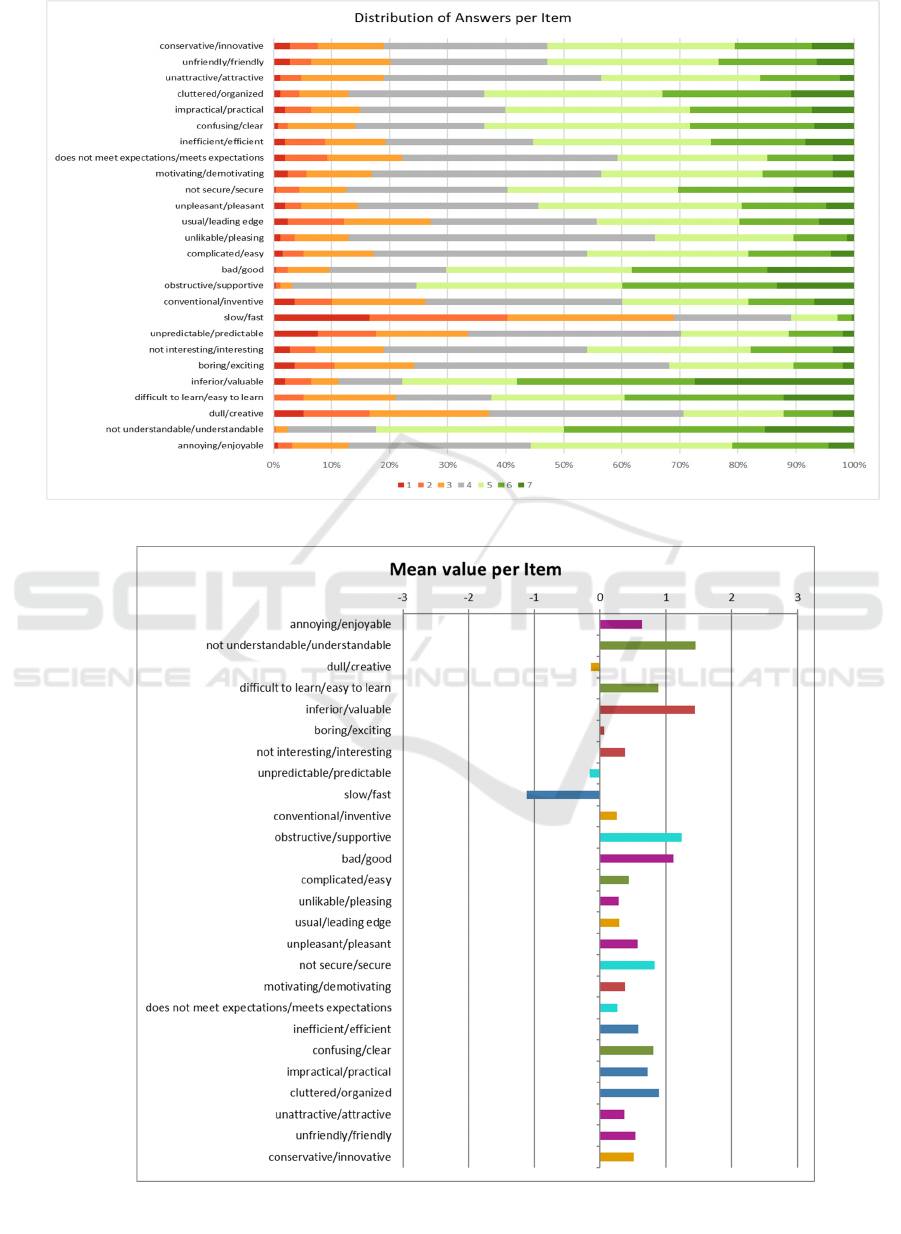
Figure 3 Response from the Participant
Figure 4 Mean Per Item
CREATIVEARTS 2019 - 1st International Conference on Intermedia Arts and Creative
182
of 80 raw questions and then after the validity and
reliability tests are broken into 6 scales with 26
questions. The scale of the research is carried out with
a 7-point Likert scale which later will be interpreted
to -3 to +3 and the data will be processed with an
excel template provided by UEQ. The following table
4. research variables given to respondents, fill data
randomized, not always positive variables on the
right, preventing charging seriously. So as to facilitate
the detection of inconsistent data collection.
A summary of the response results from 291
respondents is provided in Figure 3 Of the 288
respondents, it was found that respondents who were
detected had misinterpretations of the meaning, or did
not take seriously as many as 40 respondents, so that
the data considered valid only became 248
respondents because of a mistake in filling. Following
is the distribution of responses from questionnaires
provided.
After converting the questionnaire answers to the
values needed to evaluate UX from BINUSMAYA,
namely -3 to +3, the average value of each component
of the questionnaire is obtained. Tie the average value
below -0.8 so this represents a negative evaluation, if
the average value is between -0.8 to 0.8 then this
represents a neutral evaluation of the scale, which
needs to be increased but not too severe. Figure 4 will
provide the average response of each component of
the questionnaire.
UEQ is divided into six components, namely
attraction, efficiency, accuracy, stimulation, and
novelty. Each questionnaire question represents one
part of the component. Table 4.3. describe the
evaluation of UX BINUSMAYA from each
component
Table 2 UEQ mean and variance
UEQ Scales Mean Variance
Attractiveness
0.585 0.84
Perspicuity
0.895 0.92
Efficiency
0.269 1.06
Dependability 0.542 0.78
Stimulation 0.565 0.89
Novelty
0.228 1.10
From the results of the questionnaire it can be
seen that BINUSMAYA has a neutral level of
evaluation in various aspects. The aspect that can be
said to be good is only from the aspect of clarity,
where the average value is above 0.8. The most
needed value for improvement is the novelty value,
namely the level of innovativeness from
BINUSMAYA. However, for the size of
BINUSMAYA LMS, it has a fairly good UEQ value
compared to previous studies. The small distance
between confidence intervals indicates that this
research is quite accurate. Cronbach-alpha coefficient
averages above 0.7 except the accuracy that only has
0.67. Table 4.4, 4.5, 4.6. and 4.7 Will describe
coefficient data and confidence intervals.
4.3 Result of Analysis
UEQ benchmarks have been developed in recent
years. Benchmarks are built from evaluating 401
products and 18483 responses from various products
(Business software, web pages, web shops, social
networks).
Because benchmark datasets have a limited
number of evaluations, reciprocal responses are
divided into 5 categories for each scale:
• Excellent: enter in the best 10% results
• Good: 10% of datasets are better than
products, and 75% worse
• Above Average: 25% of datasets are better
than products, and 50% worse
• Below Average: 50% of datasets are better
than products, and 25% worse
• Bad: included in the category of 25% of bad
products
Table 3 will provide the average value of the UX
component provided by BINUSMAYA when
compared to the benchmark value.
Table 3 Benchmark Value Comparison
Scale Mean
Compari-
sson to
bench-
mark
Interpretation
Attractive-
ness
0.58 Bad
In the range of
the 25% worst
results
Perspicuity 0.90
Below
Average
50% of results
better, 25% of
results worse
Efficiency 0.27 Bad
25% of results
better, 50% of
results worse
Dependability 0.54 Bad
In the range of
the 25% worst
results
Stimulation 0.56
Below
Average
50% of results
better, 25% of
results worse
Novelty 0.23 Bad
In the range of
the 25% worst
results
The benchmarking results show many aspects that
must be improved by BINUSMAYA, but considering
User Experience Evaluation on University’s Learning Management System (LMS)
183

BINUSMAYA is an LMS, it is not fair to compare it
with other products. But from this data we can
conclude that from the attractiveness, efficiency,
accuracy, and novelty of BINUSMAYA, quality
needs to be improved.
5 CONCLUSIONS
Based on the results of the research conducted by
conducting a survey of 26 attributes representing 6
dimensions in UEQ, namely Attractiveness,
Efficiency, Accuracy, Clarity, Stimulation, and
Novelty. Conclusions can be drawn according to the
research objectives, namely evaluation of UX as
follows:
• From the overall evaluation, many neutral
evaluations must be carried out. Of the 6
dimensions that exist only the dimensions of
clarity that meet the needs and standards of
experience needed.
• From the results of the distributed questionnaire,
if viewed from 26 items that have been studied.
Speed is a major problem where this attribute is
the only attribute that is in a negative evaluation.
Which signifies the need for improvement in
terms of the speed of BINUSMAYA
• Interval distances that are not so large, and also
high alpha values indicate UEQ is an accurate
and consistent research suggestion.
• The average results of Hedonic quality,
pragmatic quality, and Attractiveness are not that
significant, but being at the midpoint shows the
relevance of these three components in a User
Experience
• The two things that must be improved first and
foremost in BINUSMAYA are matters relating
to efficiency in pragmatic quality and matters
relating to renewability in hedonic quality.
REFERENCES
Abaidoo, V. and Arkorful, N. (2015) ‘The role of e-
learning, advantages and disadvantages of its adoption
in higher education’, International Journal of
Instructional Technology and Distance Learning,
2(12), p. 7.
Blin, F. and Munro, M. (2008) ‘Why hasn’t technology
disrupted academics’ teaching practices?
Understanding resistance to change through the lens of
activity theory’, Computers & Education, 50(2), pp.
475–490. doi: 10.1016/j.compedu.2007.09.017.
Broadbent, J. and Poon, W. L. (2015) ‘Self-regulated
learning strategies & academic achievement in
online higher education learning environments: A
systematic review’, The Internet and Higher Education,
27, pp. 1–13. doi: 10.1016/j.iheduc.2015.04.007.
Brown, C. (2014) ‘The Impact of South Africa ’ s ICT
Infrastructure on Higher Education Brown , C .,
Thomas , H ., van der Merwe , A . & van Dyk , L . on
higher education . In D . Remenyi , Proceedings of the
3rd International Conference of E-Learning . Cape
Town , South A’, (January 2008).
Ellis, R. K. (2009) ‘Learning Management Systems Field
Guide to Learning Management Systems’, ASTD
learning circuits, pp. 1–7. doi:
10.1097/AIA.0b013e3181e5c1d5.
Garrote, R. and Pettersson, T. (2016) ‘Lecturers’ attitudes
about the use of learning management systems in
engineering education: A Swedish case study’,
Australasian Journal of Educational Technology,
23(3). doi: 10.14742/ajet.1256.
Hassenzahl, M. (2010) ‘Experience Design: Technology for
All the Right Reasons’, Synthesis Lectures on Human-
Centered Informatics, 3(1), pp. 1–95. doi:
10.2200/S00261ED1V01Y201003HCI008.
Larsen, T. J., Sørebø, A. M. and Sørebø, Ø. (2009) ‘The
role of task-technology fit as users’ motivation to
continue information system use’, Computers in
Human Behavior, 25(3), pp. 778–784. doi:
10.1016/j.chb.2009.02.006.
Mahdizadeh, H., Biemans, H. and Mulder, M. (2008)
‘Determining factors of the use of e-learning
environments by university teachers’, Computers &
Education, 51(1), pp. 142–154. doi:
10.1016/j.compedu.2007.04.004.
Santoso, H. B. et al. (2014) ‘Research-in-progress: User
experience evaluation of Student Centered E-Learning
Environment for computer science program’, in 2014
3rd International Conference on User Science and
Engineering (i-USEr). IEEE, pp. 52–55. doi:
10.1109/IUSER.2014.7002676.
Takahashi, S. et al. (2014) ‘The Role of Learning
Management Systems in Educational Environments :
An Exploratory Case Study’, Journal of Information
Systems Research and Innovation., 2(1), pp. 57–63. doi:
10.13140/RG.2.1.3751.6005.
Woods, R., Baker, J. D. and Hopper, D. (2004) ‘Hybrid
structures: Faculty use and perception of web-based
courseware as a supplement to face-to-face instruction’,
The Internet and Higher Education, 7(4), pp. 281–297.
doi: 10.1016/j.iheduc.2004.09.002.
Zaharias, P. and Pappas, C. (2016) ‘Quality Management of
Learning Management Systems: A User Experience
Perspective’, Current Issues in Emerging eLearning,
3(1), pp. 60–83. Available at:
http://scholarworks.umb.edu/ciee/vol3/iss1/5.
CREATIVEARTS 2019 - 1st International Conference on Intermedia Arts and Creative
184
